
Abstract
Background:
Softball is a popular sport played through both competitive and recreational leagues. While head and facial injuries are a known problem occurring from games, little is known about the frequency or mechanisms by which they occur.
Purpose:
To analyze head/face injury diagnoses and to identify the mechanisms associated with such injuries.
Study Design:
Descriptive epidemiological study.
Methods:
A public database was used to query data related to head/facial injuries sustained in softball. Data including age, sex, race/ethnicity, injury diagnosis, affected body parts, disposition, incident location, and narrative descriptions were collected and analyzed.
Results:
A total of 3324 head and face injuries were documented in the database over the time span of 2013 to 2017, resulting in a nationwide weighted estimate of 121,802 head/face injuries occurring annually. The mean age of the players was 21.5 ± 14.4 years; 72.1% of injured players were female, while 27.9% were male. The most common injury diagnoses were closed head injuries (22.0%), contusions (18.7%), concussions (17.7%), lacerations (17.1%), and fractures (15.1%). The overwhelming majority of injuries involved being struck by a ball (74.3%), followed by colliding with another player (8.3%), colliding with the ground or a fixed object (5.0%), or being struck by a bat (2.8%). For those injuries caused by a struck-by-ball incident, most occurred from defensive play (83.7% were fielders struck by a hit or thrown ball) as opposed to offensive play (12.3% were players hit by a pitch or runners struck by a ball). Although helmet usage was poorly tracked in the database, female players (1.3%) were significantly more likely to have been wearing a helmet at the time of injury than were male players (0.2%) (P = .002).
Conclusion:
The present study demonstrates that a large number of head and face injuries occur annually within the United States as a result of softball play. A variety of injuries were observed, with the majority involving defensive players being struck by the ball, which highlights the need for more focus on player safety by stronger adherence to protective headgear usage and player health monitoring.
Keywords
Softball is a popular sport in the United States, with an estimated 10 to 12 million people participating annually. 8,16 However, serious head and face injuries can be sustained as part of the sport, with rare cases even leading to death. For example, in 2007, a 12-year-old Michigan girl who was struck in the head by a ball while practicing with her team sustained a serious brain injury that led to her death a day later. 14 Also, in 2016, a 39-year-old Tennessee woman was umpiring for a charity softball game when a foul tip struck her face mask, resulting in a closed head injury (CHI). Postconcussive symptoms and cognitive dysfunction persisted, eventually leading to her death 2 days after the initial incident. 19
Many elements of softball play involve high-energy events that are capable of causing head and facial injuries, including pitching, batting, or running into other players or objects. For example, batted balls include energy from the original pitch as well as the swung bat, 17 resulting in ball speeds as high as 99 mph. The kinetic energy associated with a 99-mph ball is comparable with a well-executed karate strike, 6 and players such as pitchers may have as little as 0.36 seconds of reaction time before being impacted. 12 Foul tips or “bad hops” present a similar danger and may provide softball participants, such as catchers and umpires, with even less time to react to the impending impact.
To counteract the types of head/face injuries that can result from a softball impact, protective headgear exists for all softball player positions, both offensive and defensive. However, the mandated rules for protective headgear usage in softball differ across positions and leagues. Offensive players and catchers are typically only required to wear protective gear during organized competitive play (eg, fast-pitch), whereas defensive fielders are seldom required to wear protective headgear in any leagues. Generally, all types of protective headgear used in softball are intended to prevent ball contact with the face, thereby reducing the likelihood of contact-related injuries such as contusions, abrasions, and fractures. Although several studies have demonstrated that catchers’ masks and batters’ helmets are effective at reducing various types of head and facial injuries for baseball impacts, much less is known about their performance for softball impacts. 2,13,20 A paucity of experimental data exists regarding softball fielders’ masks, although recent data suggest that they mitigate facial contact under certain impact conditions and serve to reduce inertial exposures, although not to the same levels of protection seen with other types of headgear. 21 As such, brain injuries such as concussions may still occur even with protective headgear worn. 4
Within this context, a review of the current epidemiological literature on softball-related head injuries reveals that only 1 study has investigated concussive injuries, 9 and no information on the broader spectrum of head and facial injuries is available. We therefore aimed in this study to investigate emergency department (ED) injury data related to softball impacts to identify trends regarding the nature and frequency of head and facial injuries sustained during softball play. More specifically, the objective of this study was to evaluate nationwide ED data to determine the statistical distribution of diagnosed head/face injuries sustained during softball play and to identify specific causal mechanisms associated with these injuries. Such data could be helpful during initial triage and/or the treatment of injured players and may also serve to promote the broader use of protective headgear for participating players.
Methods
The National Electronic Injury Surveillance System (NEISS) was accessed to obtain data regarding head and facial injuries sustained in softball over a 5-year time span (2013-2017). The NEISS collects data from approximately 100 hospitals nationwide as a probability sample of all the >5000 hospitals in the United States with EDs. Data collected for each case include the patient’s age, sex, race/ethnicity, injury diagnosis, affected body parts, disposition, incident location, and brief narrative description of the incident. The NEISS uses an extrapolating algorithm, based on sample weights and a national probability sample, to produce national estimates. The overall system that the Consumer Product Safety Commission employs in the NEISS has been well established for many years and is widely used by researchers and government agencies. 3,11,22
The database was accessed in May 2018 and queried using the product code “softball” (5034). Codes for the following body parts were used to refine the query so that it was limited to head and facial injuries: head, face, eyeball, mouth, and ear. The narrative description for each entry was further screened to provide insight on the use of protective equipment and to determine the injury mechanism. Four categories were used to classify protective equipment usage: helmeted (if the narrative specifically identified the player as wearing a helmet or mask at the time of injury), unhelmeted (if the player was specifically identified as not wearing protective headgear), unknown, and equivocal.
After initially reviewing the data, 6 categories of injury mechanisms were created: struck by ball, struck by bat, collision with another player, collision with the ground or a fixed object, other (events such as heat exhaustion or a foreign body in the eye), and equivocal/not specified. Subcategories within the struck-by-ball mechanism group were further created because being struck by a ball proved to be the most common injury mechanism, and many narratives provided additional detail on the contextual setting of the ball strike. These subcategories included hit by pitch (all players struck by a pitched ball, including batters and catchers), base runner (any offensive player struck by a hit or thrown ball during the act of running bases), defender (fielder) struck by batted ball, defender struck by thrown ball, equivocal defensive play (players identified as being struck in the act of attempting to catch a ball as part of defensive play but in which it was unknown if the ball was hit or thrown), other (for events not involving offensive or defensive play, such as players in the dugout, base coaching, etc), and equivocal/not specified.
Statistical analysis of the data was performed using Stata statistical software (v 10; StataCorp). This included standard descriptive statistics, Pearson chi-square comparisons for categorical variables, Student t tests, and analyses of variance for continuous variables.
To provide insight on whether specific aspects of game play were related to particular injury types, the same statistical analyses were performed for subcategories of injury diagnoses. These subcategories were limited to injuries that were both frequent (>3% of diagnosed injuries) and relatively severe (contusions and lacerations were excluded). This ultimately resulted in 2 subcategories being analyzed: patients with a fracture diagnosis and patients with a head/brain injury diagnosis (where CHI and concussion diagnoses were grouped together).
Finally, as the NEISS uses 2 separate diagnosis categories for head injuries, those distinctions were maintained within the present analysis. Specifically, when coding events in the NEISS, clinicians are instructed to code the most severe and specific diagnosis. If internal head injuries such as subdural hematomas or cerebral contusions are documented, then a diagnosis of “internal organ injury” is entered (which we use interchangeably with “brain injury”). Otherwise, if only concussive symptoms are observed, then a diagnosis of “concussion” was used.
Results
During the 5-year time span, a total of 3324 injuries involving the face and head were recorded in the NEISS. Through the algorithm that the NEISS uses, the weighted annual estimate of these injuries within the United States was calculated to be 121,802. The mean age of the injured players was 21.5 ± 14.4 years. Female players accounted for 72.1% of the injuries, while male players accounted for 27.9%. Regarding disposition, 96.3% of patients were discharged home from the ED, whereas 2.1% were admitted, and 0.5% were transferred to another facility (Table 1).
Patient Demographics and Disposition
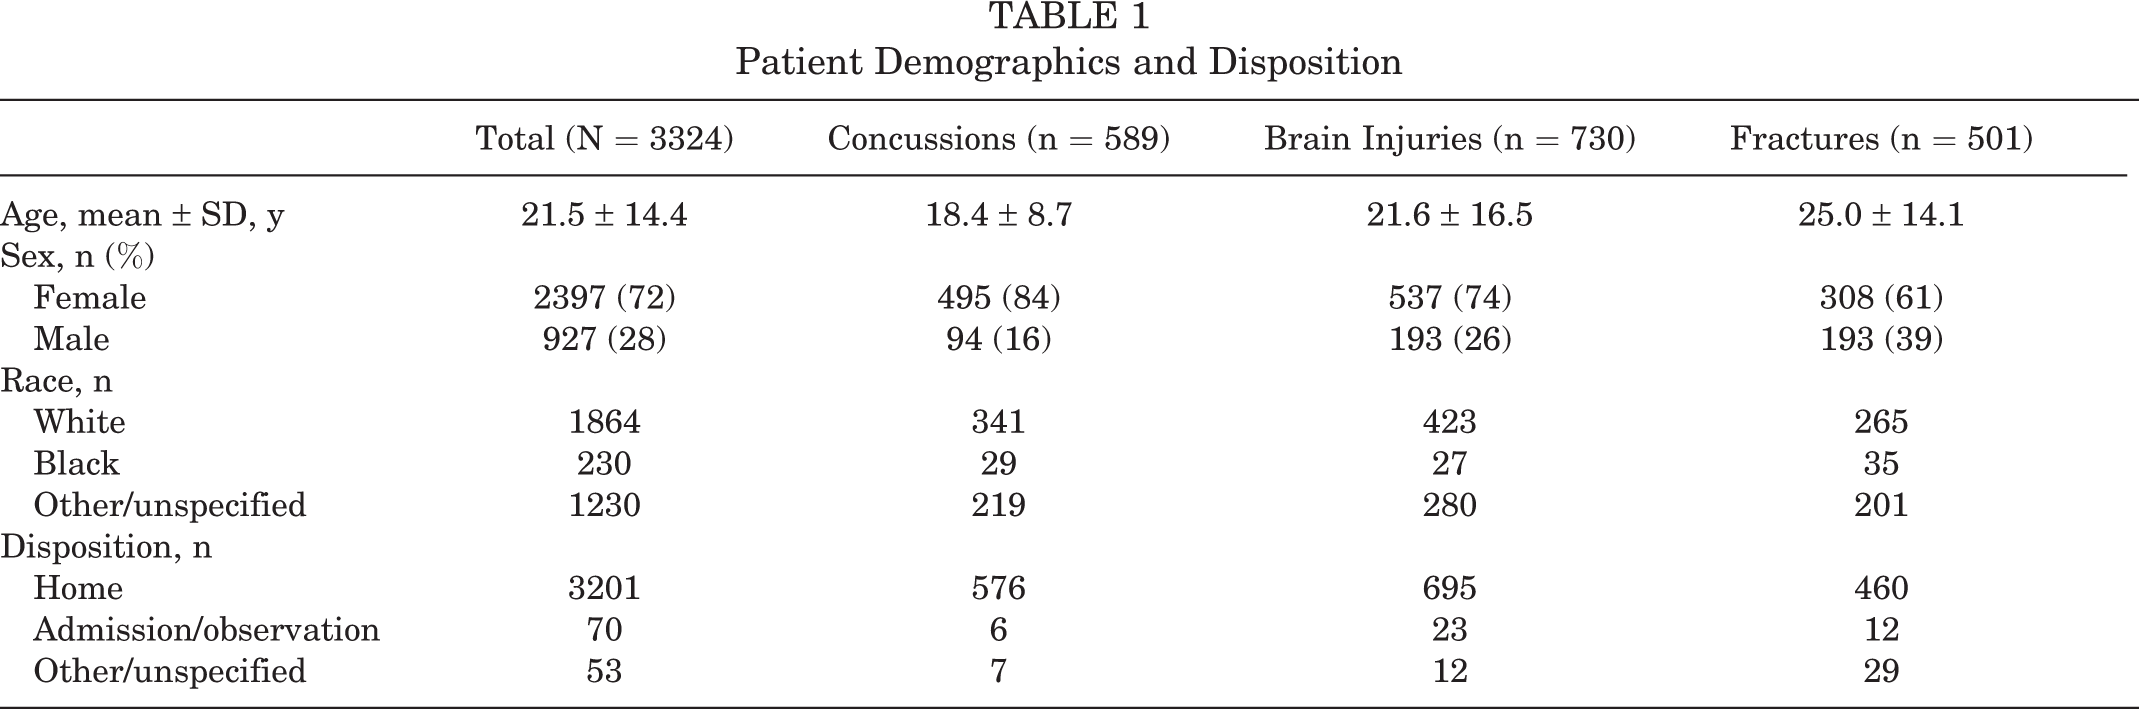
The head (45.0%) and face (42.4%) were the most commonly injured body parts, although an appreciable number of mouth (8.8%) and eye (3.0%) injuries were also reported. The most common injury diagnoses were “internal organ injuries” (22.0%; referring to subdural hematomas, cerebral contusions, and other head injuries that would be considered severe), followed by contusions (18.7%), concussions (17.7%), lacerations (17.1%), fractures (15.1%), and dental injuries (2.4%). Other injuries, such as hematomas, nerve damage, punctures, hemorrhages, and avulsions, occurred at a much smaller frequency (typically <1.0%) (Figure 1).

Percentage breakdown of injury diagnoses. The category labeled “Other Diagnoses” includes injury diagnoses that were unspecified or diagnoses with fewer than 3 documented cases.
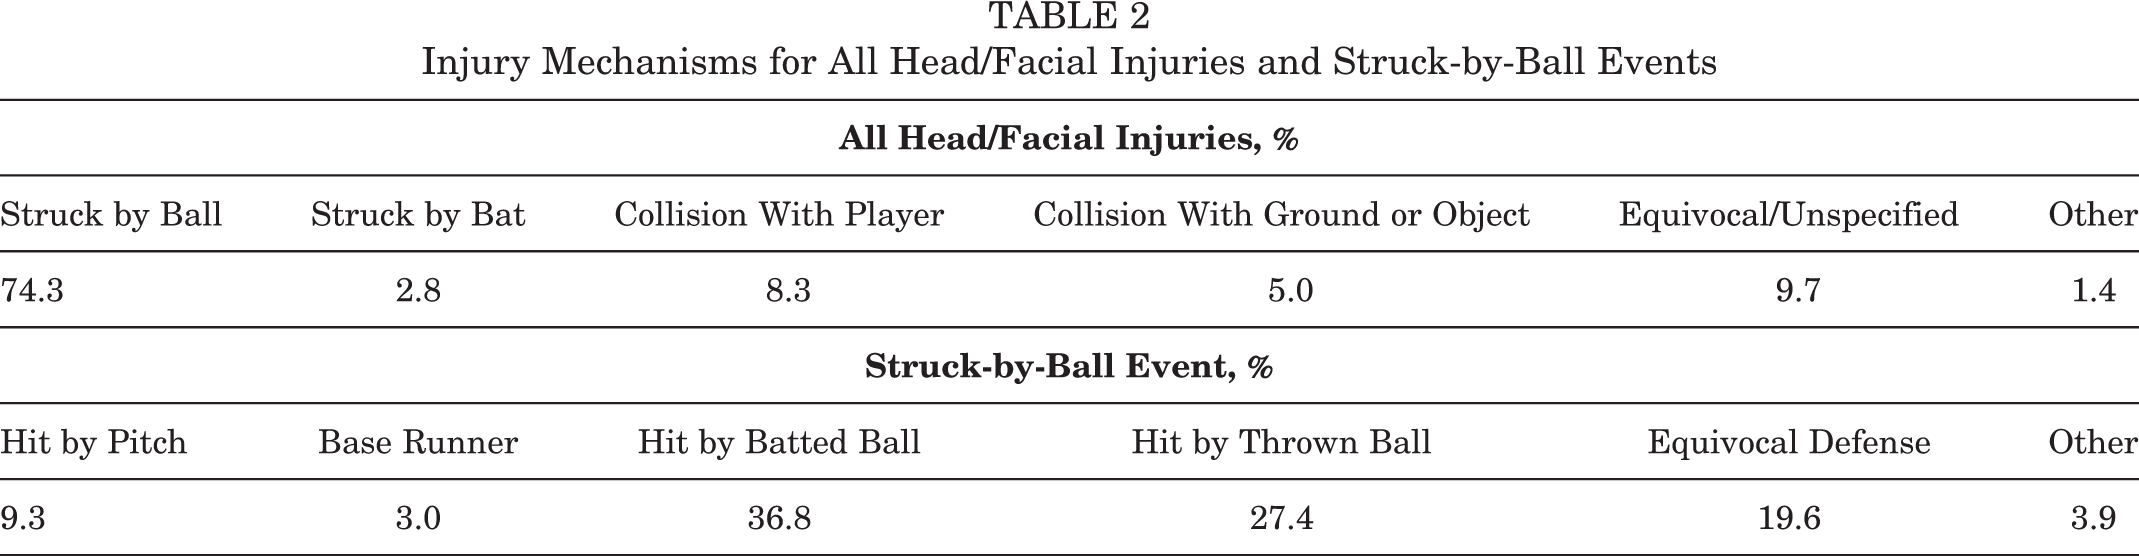
The use of a helmet or other protective gear was unknown in 98.3% of cases; only 34 instances (1.0%) of helmet use were recorded, and 12 instances (0.4%) of nonuse were recorded. In the cases where helmet use was recorded, female players were significantly more likely to have worn a helmet/mask compared with male players (1.3% vs 0.2%, respectively; P = .002). The most common injury mechanism (Table 2) involved players being struck by a ball (74.3%), followed by collision with another player (8.3%), collision with the ground or a fixed object (5.0%), and being struck by a bat (2.8%). Within the struck-by-ball mechanism group, most narratives (73.5%) failed to provide sufficient information to understand the context of injury. However, for those that described the aspect of play at the time of ball strike, 83.8% came from defensive play, while 12.3% came during offensive play.
Injury Mechanisms for All Head/Facial Injuries and Struck-by-Ball Events
The subgroup consisting of concussion and CHI diagnoses represented 39.7% of all reported face/head injuries, with a weighted estimate of 46,056 occurring annually. Disposition statistics were similar to the overall face/head distribution (no metric varied by more than 0.4%). Within this class of injuries, the mean age of injured players was slightly younger (19.8 ± 11.4 years), and female players represented a greater percentage of injuries (78.3%) than in the general data set. Helmet usage was recorded slightly more frequently in this subset; 2.7% of injured players were wearing a helmet, whereas 1.6% were not. Injury mechanisms displayed a small shift away from struck-by-ball injuries (65.9%) to collisions with other players (13.3%) and collisions with the ground or a fixed object (8.4%) (Figure 2 and Table 3). Within the struck-by-ball mechanism group with known causal events, 79.2% came from defensive play, while 16.8% came from offensive play.

Distribution of injury mechanisms across diagnosis categories. CHI, closed head injury.
Injury Mechanisms for Closed Head Injuries and Concussions and Struck-by-Ball Events

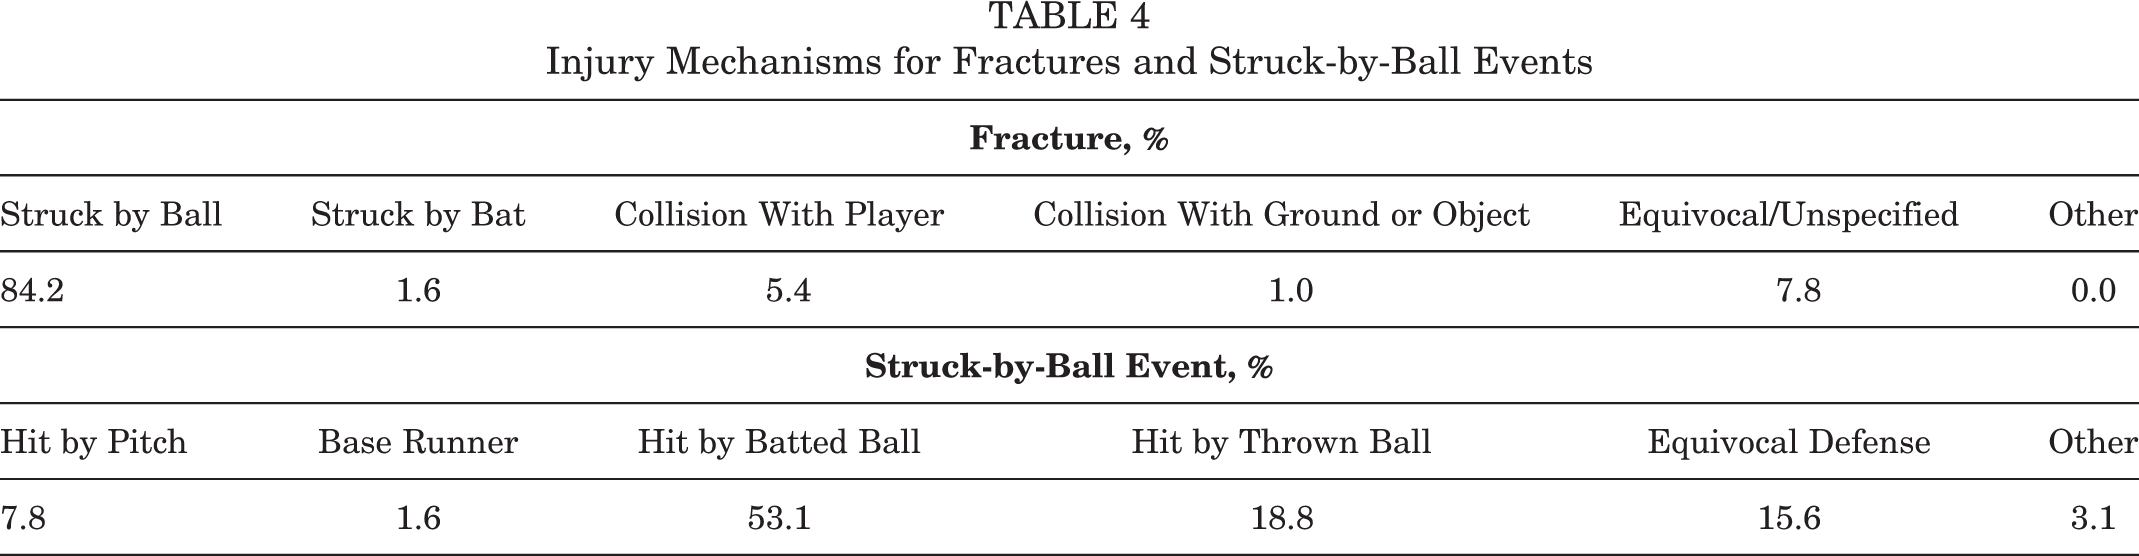
The subgroup of fracture diagnoses represented 15.1% of all reported face/head injuries, with a weighted estimate of 18,127 occurring annually. Demographic factors were not predictive of fractures. Injury mechanisms appreciably shifted toward struck-by-ball injuries (84.2%), with all other categories decreasing relative to the overall injury group (Table 4). Within the struck-by-ball mechanism group with known causal events, 87.5% came from defensive play, while 9.4% came from offensive play.
Injury Mechanisms for Fractures and Struck-by-Ball Events
Discussion
This study is novel in that it presents data relating to the entire spectrum of head and face injuries sustained across all softball play and analyzes injury mechanisms in detail. Overall, it is estimated that EDs in the United States see 121,802 softball-related head and facial injuries annually. Querying the NEISS with the same search parameters for different sports reveals that more head and facial injuries occur annually in softball than in ice hockey (n = 35,333) and lacrosse (n = 23,174) combined. In fact, the number of annual softball injuries is on the same order of magnitude as football (n = 396,276) and baseball (n = 255,250), 2 sports that traditionally garner a great deal of academic and medical attention. Although the absolute rates at which such injuries occur within each of these sports are unknown (because the total participation numbers are not known), these data nonetheless indicate that further research into softball injury mechanisms and prevention may be warranted.
With regard to previously published research, we are aware of only 1 study that has examined the epidemiology of softball injuries; however, it only examined concussion diagnoses and was interpreted within the context of fast-pitch versus slow-pitch softball. 9 Although female players represented the majority of injuries, we observed an appreciable number of male players in the database (accounting for ∼28% of the injuries), most likely reflective of recreational or slow-pitch play. Most patients were also relatively young (with the mean age being ∼22 years), but extremes on each end of the spectrum were observed; the oldest player was 79 years old, and the youngest was 5 years old. As such, medical complications associated with treating very old or young patients may be encountered when dealing with softball-related injuries.
Almost all injuries in the database could be classified into 1 of 4 categories of causal mechanisms: being struck by a ball, being struck by a bat, colliding with another player, or colliding with the ground or a fixed object. Within these groups, the overwhelming majority of injuries occurred from being struck by a ball (∼3 times more common than all other mechanisms combined), which is consistent with previously published findings. 9 Based on this observation, we chose to establish subcategories within the struck-by-ball mechanism group, providing unique data on the specific elements of game play responsible for such injuries. Several aspects of defensive play were identified as being responsible for the majority of ball impacts, with batted balls representing the plurality. Within the narratives describing defensive players struck by a batted ball, many instances of “line drives” striking pitchers and infielders were encountered, as would be expected. However, descriptions of “bad hops” and players being struck by “fly balls” were also common, indicating that all defensive positions are vulnerable to such impacts. The susceptibility of all defensive player positions was further confirmed by the appreciable number of injuries caused by thrown balls and missed catches. Finally, although we note that our classification system incorrectly grouped catchers into offensive play, this was done because both the element of game play and the mechanism of injury are the same for catchers as for offensive players struck by pitches. As such, the true proportion of defensive injuries is slightly higher than reported here.
The subgroup of concussion and CHI diagnoses represented a large proportion of injuries in the database. Although a concussion diagnosis is reflective of neurological/cognitive dysfunction (ie, symptom-based) and a CHI diagnosis reflects a nonpenetrating head injury (ie, objective observation), we chose to group these diagnoses together because they are both generally reflective of intracranial trauma and often coexist. 18 While nearly all of these diagnoses resulted in patients being discharged, we caution that the NEISS does not typically contain information on follow-ups, and the ultimate course of these injuries is not known. As noted previously, isolated case studies have demonstrated that the course of CHIs from softball impacts can be severe and can unfold over the span of days, 19 and therefore, cautious monitoring and follow-up evaluations of head injuries may be appropriate if persistent symptoms are observed. The frequency of observed CHIs and concussions from softball impacts raises additional concerns, as seen in other sports with a high risk of traumatic brain injuries. For example, football players with a history of concussions have an increased chance of sustaining another one compared with those with no history. 7 Cumulative softball-related head injuries may also pose a risk for long-term neurodegenerative diseases, such as chronic traumatic encephalopathy, or other forms of cognitive disorders, as seen in observations after repetitive head impacts from football. 1 Therefore, adherence to return-to-play guidelines may be appropriate for both organized and recreational softball play.
Unfortunately, helmet usage was poorly tracked in this data set, and few (if any) conclusions can be directly reached regarding adoption rates or associated efficacy in injury prevention. Nonetheless, most fractures observed in this study were caused by ball strikes experienced during defensive play. The types of masks and protective headgear available to fielders and pitchers are typically designed to prevent contact injuries to the face from a softball 15 but are rarely mandated to be worn. In contrast, protective headgear is required much more often in offensive play and for catchers, particularly so in the case of competitive play (as compared with recreational leagues). This mandated use may partially explain why our study documented relatively few face/head injuries sustained from ball strikes during offensive play. The present data also suggest some areas of helmet testing and design that could benefit from future research. For instance, CHIs and concussions represented about 40% of all injuries in the data set, the majority of which were caused by ball strikes in defensive play. However, fielders’ masks are less substantial in their construction and padding as compared with batters’ helmets and catchers’ masks, 2,13,20,21 and to our knowledge, the ability of fielders’ masks to attenuate concussive accelerations is not well established. This remains an avenue of future research that should be pursued.
A few limitations were encountered in this study that warrant discussion. First, the data collected by the NEISS are solely from patients treated at EDs and therefore do not account for injuries that were left untreated or those that were treated through means other than the ED. This may include diagnoses and/or treatment by coaches or on-site athletic trainers/physicians or the patient visiting urgent care clinics or outpatient doctors. In particular, athletes participating in the upper levels of competitive play (eg, high school and collegiate) likely receive medical care through their trainers/team doctors and therefore could represent a substantial source of unaccounted injuries. In addition, several studies have observed that head injuries, particularly traumatic brain injuries, are often left untreated or their diagnosis is missed. 5,10 What is more, the NEISS suffers from imprecise diagnosis codes, and nonexpert coders may not understand the difference or importance of the potentially life-threatening “subdural hematoma” versus a superficial “subgaleal hematoma.” Given the relative paucity of hospital admissions despite high numbers of reportedly more severe brain injuries in our sample, this was a definite limitation of the data set.
A second limitation is that the narrative descriptions provided in the NEISS often lacked sufficient details to fully understand the circumstances under which the injury occurred, thus limiting the statistical power of the analysis. This was specifically encountered in our attempt to quantify helmet/mask usage in the present data set. Third, several of the diagnoses provided by the data set, such as concussions and CHIs, are not radiology-based or standardized clinical examination–based diagnoses. In fact, we unexpectedly found a higher number of reported “brain injuries” as compared with concussions, which may be partially explained by a lack of advanced medical imaging to corroborate diagnoses. Despite this, limited conclusions could still be made based on our detailed categorization of injury mechanisms.
Conclusion
Results of the present study indicate that numerous head and facial injuries occur in softball, even though protective headgear exists for all player positions. Most patients were female in their teens and 20s, and the most common injury diagnoses included CHIs, contusions, lacerations, fractures, and concussions. Very few players were admitted to hospitals or held for observation. The overwhelming majority of injuries were caused by players being struck by softballs, particularly those in defensive fielder positions, and therefore, player safety efforts should be focused in that specific area of play. Overall, this study presents novel data related to head/facial injuries sustained in softball and unique information on injury mechanisms but also highlights the need for more details and research regarding the sport of softball.
Footnotes
The authors have declared that there are no conflicts of interest in the authorship and publication of this contribution. AOSSM checks author disclosures against the Open Payments Database (OPD). AOSSM has not conducted an independent investigation on the OPD and disclaims any liability or responsibility relating thereto.
Ethical approval was not sought for the present study.