
Abstract
Objectives:
The borderline dysplastic hip (characterized by a lateral centre-edge angle (LCEA): 20 - 25° and an acetabular index (AI): 10 - 15°) can pose a significant challenge as symptoms may be due to insufficient acetabular coverage, the presence of femoro-acetabular impingement (FAI) or both. Accordingly, different treatment options have been described, including peri-acetabular osteotomy (PAO), hip arthroscopy, open arthrotomy or a combination of procedures. This study aims to determine patient and deformity-specific characteristics that direct treatment decision-making in the borderline dysplastic hip. Furthermore, we describe the early-term results of both the PAO and hip arthroscopy in treating this challenging patient population.
Methods:
A prospective, multicenter, longitudinal surgical cohort of young adult hips was searched. From 2060 hips, 291 hips satisfied the inclusion criteria of idiopathic borderline dysplasia, adequate follow-up (> 1-year) and functional outcome. Demographic and radiographic features are included in Table 1. Fifty-five hips (19%) had a previous hip operation (most commonly a hip arthroscopy). A number of different procedure types were performed which were broadly divided into 3 groups; PAO-only (n=42), hip arthroscopy-only (n=127) or PAO and intra-articular treatment (either arthroscopically or open, addressing the cam morphology and/or labral pathology) (n=122). Outcome measures included complications-, re-operations- rates and clinical outcomes using the Harris Hip (HHS) and HOOS scores; pre-operatively and at follow-up; the difference was defined as Δ. Patient characteristics, radiographic morphology and clinical outcome measures were compared between the 3 groups.
Results:
Patients that underwent a PAO were younger and more likely to be female. The PAO groups had a greater number of previous hip procedures (26%, 24%), most of which were hip arthroscopies. The patients that underwent hip arthroscopy had greater incidence of high alpha angles (66%) compared to the PAO groups (35%, 38%) (p<0.001). The PAO groups having slightly more dysplastic features (LCEA, AI, ACEA) (Table 1). At a mean follow-up of 2.5 years, there were no differences in the complication (7-10%, p=0.8) or re-operation rates (13%). Pre-operatively, the PAO groups had inferior HOOS and WOMAC scores compared to the arthroscopy group (p=0.02-7). No differences in the post-op scores were seen (Table 1). The groups that addressed the intra-articular pathology (arthroscopy and PAO-articular treatment) had significantly greater ΔHHS (23) compared to PAO-only (13) (p=0.02).
Conclusion:
Younger patients, those with a failed previous arthroscopy, without evidence of intra-articular wear and with worse pre-operative function were more likely to receive a PAO (with or without articular adjunct treatment). Addressing the intra-articular and impingement-related pathology (in addition to a when a PAO is considered necessary) was associated with better improvement in PROMs and should be strongly considered in the borderline hip.
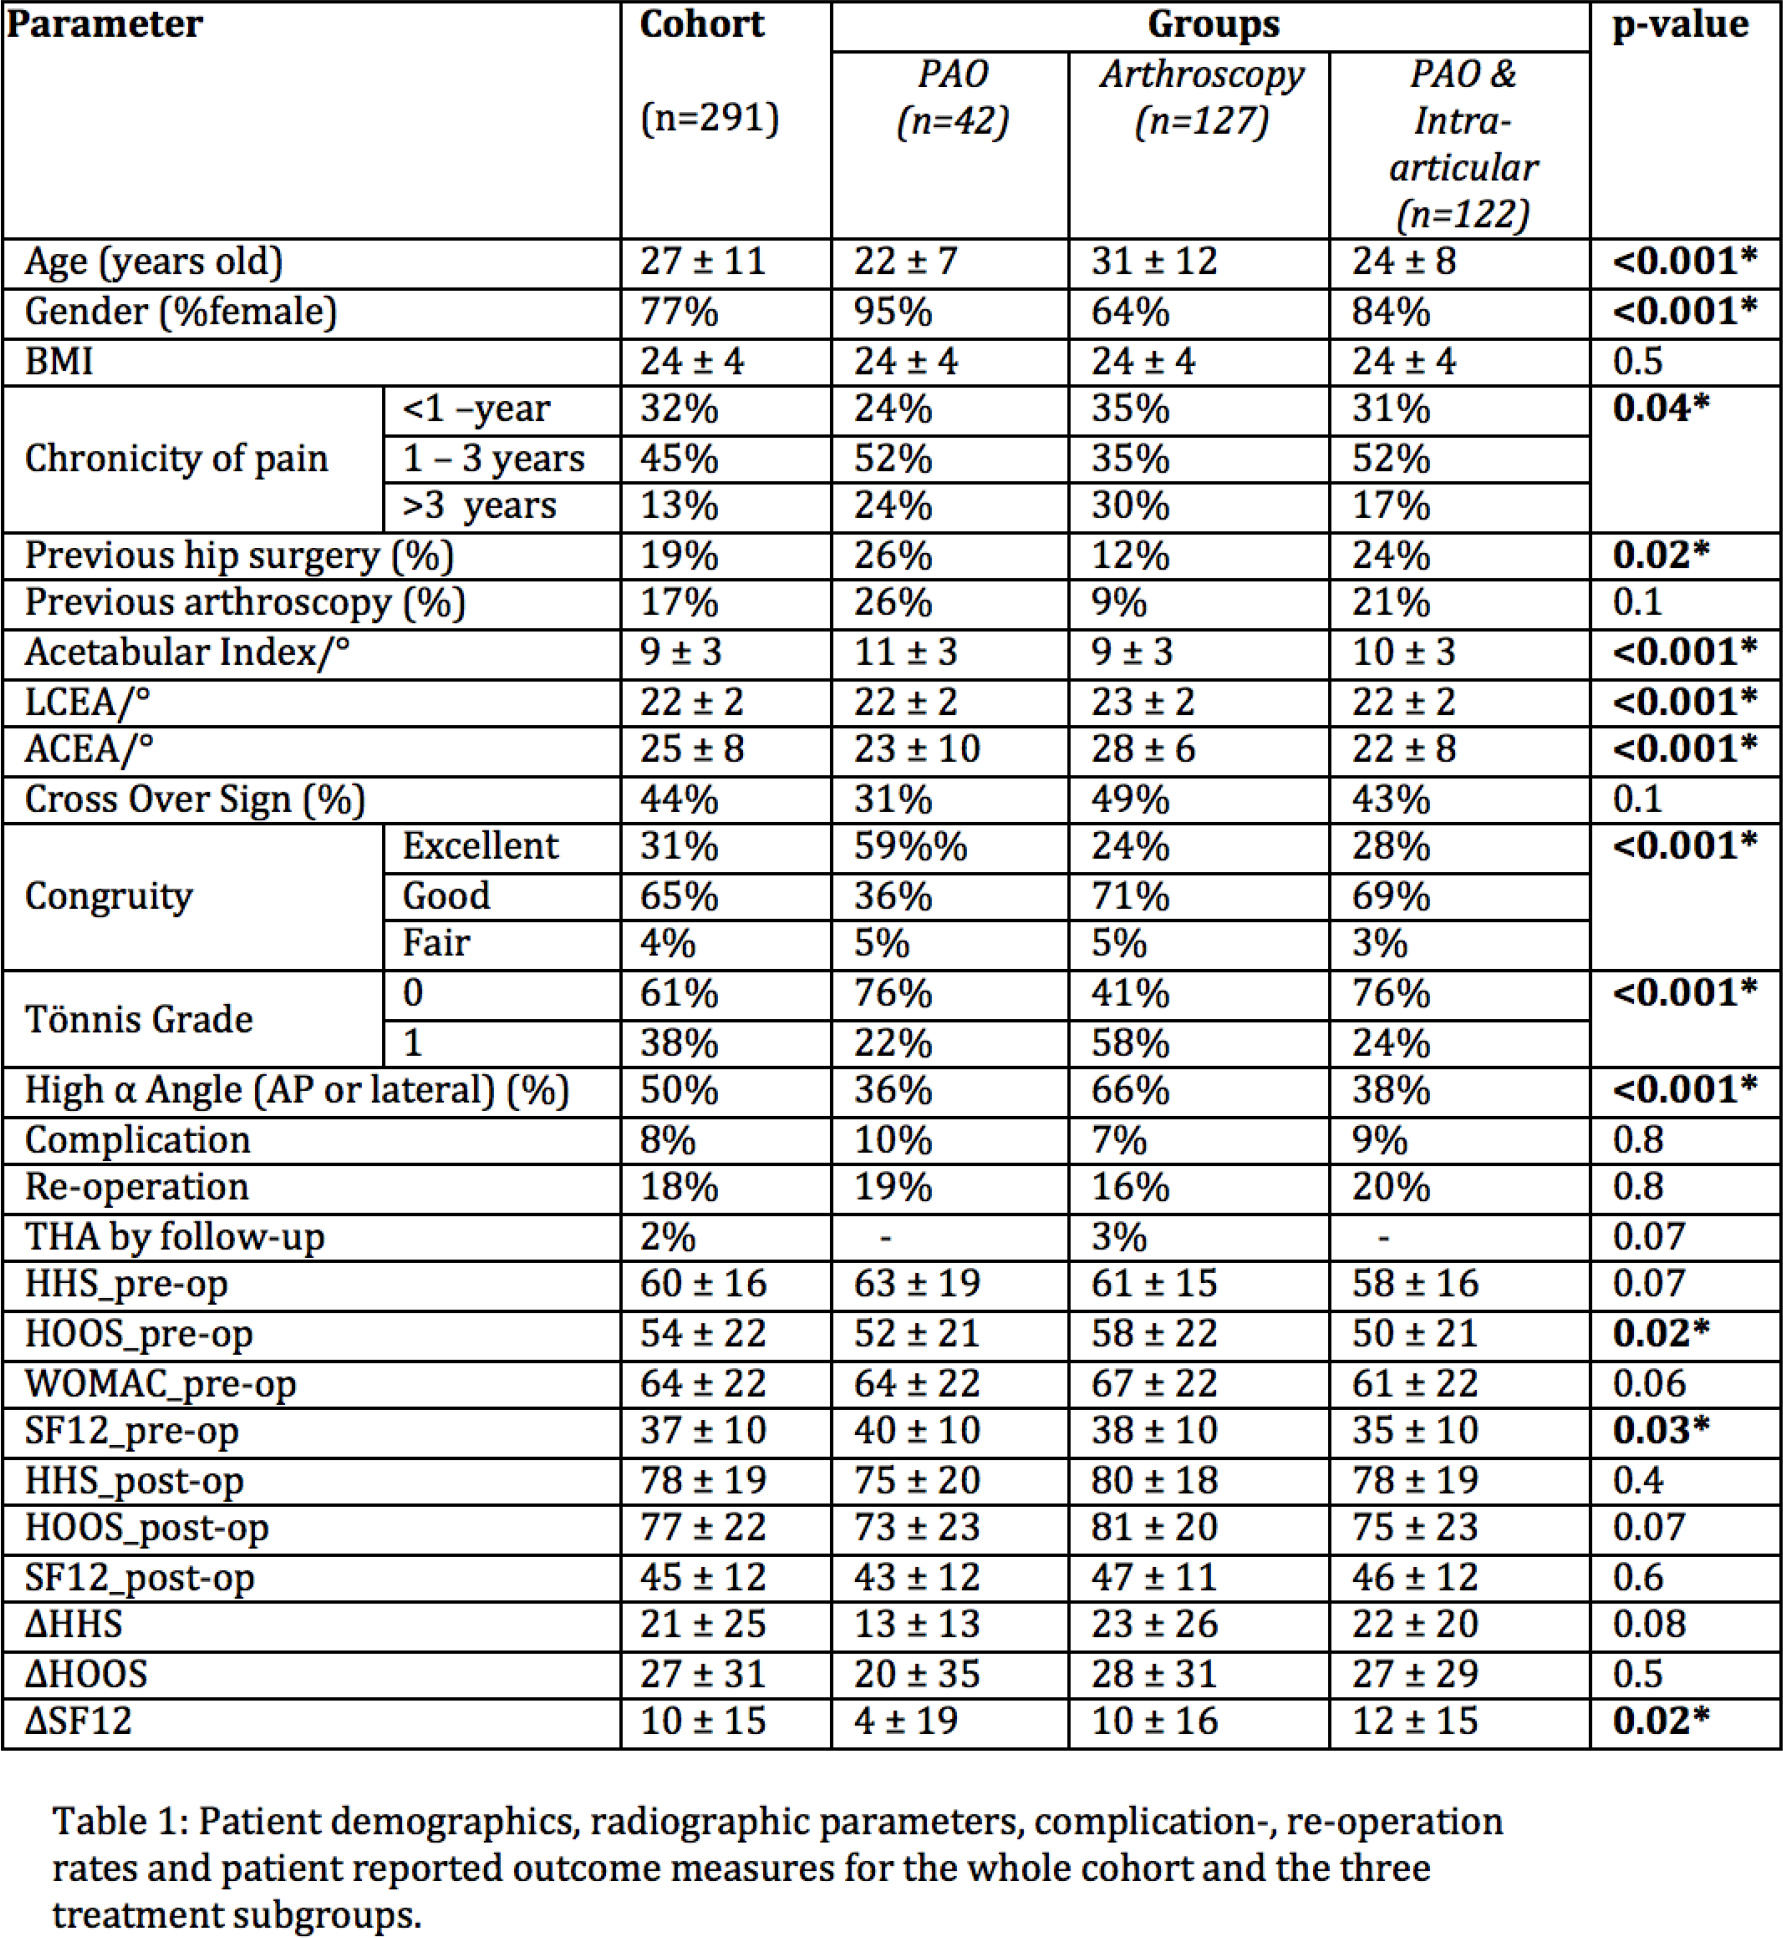
Patient demographics, radiographic parameters, complication-,re-operation rates and patient reported outcome measures for the whole cohort and the three treatment subgroups.
| Parameter | Cohort (n=291) | Groups | p-value | ||||
|---|---|---|---|---|---|---|---|
| PAO (n=42) | Arthrosropy (n=127) | PAO& Intro-articular (n422) | |||||
| Age (years old) | 27±11 | 22±7 | 31±12 | 24±8 |
|
||
| Gender (%female) | 77% | 95% | 64% | 84% |
|
||
| BMI | 24±4 | 24±4 | 24±4 | 24±4 | 0.5 | ||
| Chronicity of pain | <1-year | 32% | 24% | 35% | 31% |
|
|
| 1-3years | 45% | 52% | 35% | 52% | |||
| >3 years | 13% | 24% | 30% | 17% | |||
| Previous hip surgery(%) | 19% | 26% | 12% | 24% |
|
||
| Previous arthroscopy(%) | 17% | 26% | 9% | 21% | 0.1 | ||
| Acetabular Index/° | 9±3 | 11±3 | 9±3 | 10±3 |
|
||
| LCEA/° | 22±2 | 22±2 | 23±2 | 22±2 |
|
||
| ACEA/° | 25±8 | 23±10 | 28±6 | 22±8 |
|
||
| Cross Over Sign (%) | 44% | 31% | 49% | 43% | 0.1 | ||
| Congruity | Excellent | 31% | 59%% | 24% | 28% |
|
|
| Good | 65% | 36% | 71% | 69% | |||
| Fair | 4% | 5% | 5% | 3% | |||
| Tõnnis Grade | 0 | 61% | 76% | 41% | 76% |
|
|
| 1 | 38% | 22% | 58% | 24% | |||
| High α Angle (AP or lateral) (%) | 50% | 36% | 66% | 38% |
|
||
| Complication | 8% | 10% | 7% | 9% | 0.8 | ||
| Re-operation | 18% | 19% | 16% | 20% | 0.8 | ||
| THA by follow-up | 2% | - | 3% | - | 0.07 | ||
| HHS_pre-op | 60±16 | 63±19 | 61±15 | 58±16 | 0.07 | ||
| HOOS_pre-op | 54±22 | 52±21 | 58±22 | 50±21 |
|
||
| WOMAC_pre-op | 64±22 | 64±22 | 67±22 | 61±22 | 0.06 | ||
| SF12_pre-op | 37±10 | 40±10 | 38±10 | 35±10 |
|
||
| HHS_post-op | 78±19 | 75±20 | 80±18 | 78±19 | 0.4 | ||
| HOOS_post-op | 77±22 | 73±23 | 81±20 | 75±23 | 0.07 | ||
| SF12_Ppost-op | 45±12 | 43±12 | 47±11 | 46±12 | 0.6 | ||
| ΔHHS | 21±25 | 13±13 | 23±26 | 22±20 | 0.08 | ||
| ΔHOOS | 27±31 | 20±35 | 28±31 | 27±29 | 0.5 | ||
| ΔSF12 | 10±15 | 4±19 | 10±16 | 12±15 | 0.02* | ||