
Abstract
Background:
A navicular stress fracture (NSF) is a common and high-risk injury in distance runners. It is not clear whether there are differences in foot structure and function between runners who have and those who have not sustained an NSF.
Purpose/Hypothesis:
This study compared foot structure, range of motion, and biomechanics between runners with a history of unilateral NSFs and runners who had never sustained this injury. The hypothesis was that runners with a history of NSFs will have less dorsiflexion and subtalar range of motion in a clinical examination and greater rearfoot eversion and higher eversion velocity while running than either the noninvolved feet or healthy controls.
Study Design:
Cross-sectional study; Level of evidence, 3.
Methods:
Seven runners who sustained an NSF were matched with 7 controls without this injury history. Participants underwent a clinical orthopaedic examination, followed by a 3-dimensional running gait analysis. Clinical examination variables, foot kinematics, and ground-reaction forces were compared between injured and noninjured feet within the NSF group and between the NSF group and control group.
Results:
The NSF group demonstrated less plantar flexion on the clinical examination than the control group (P = .034, effect size [ES] = 0.69). The involved feet of the NSF group demonstrated greater rearfoot eversion excursion, greater eversion velocity, and reduced forefoot abduction excursion than either the noninvolved feet of the NSF group (P = .015, ES = 1.73; P = .015, ES = 1.86; and P = .015, ES = 0.96, respectively) or the control group (P = .012, ES = 1.40; P = .016, ES = 0.49; and P = .005, ES = 1.60, respectively).
Conclusion:
There are differences in foot kinematics but not ground-reaction forces, foot structure, or passive range of motion between runners who have and those who have not sustained an NSF. Runners who demonstrate increased rearfoot eversion and reduced forefoot abduction during stance may be more at risk for developing NSFs.
Stress fractures are among the most common injuries experienced by runners and are estimated to account for between 6% and 40% of all running-related injuries. 16,22,40 Stress fractures of the navicular bone in particular may account for up to 35% of all stress fracture injuries. 5,27 A navicular stress fracture (NSF) often presents with general nonspecific pain on the medial aspect of the foot and may not appear on standard radiographs, making them difficult to diagnose. 18,19,38 These stress fractures often occur along the middle third of the navicular bone, a relatively avascular region. 14,18,19,35 As a result, delayed healing, nonunion, or progression to full fractures are some of the negative outcomes associated with this injury. 11,19,33,39,43 The relatively high possibility for these negative outcomes, combined with the importance of the navicular bone for normal foot function, has led to the classification of NSFs as “high-risk” stress injuries. 4,17,28
Given the potential severity of an NSF, there is a sizable body of literature examining diagnoses, management protocols, and clinical outcomes. 6,18,39,42 However, there are only a few studies examining how an NSF influences foot function or if there are differences in foot structure and alignment between those who have and those who have not sustained an NSF. Retrospective studies have reported that, compared with controls, patients who have sustained an NSF demonstrate limited ankle dorsiflexion and subtalar joint range of motion, 19,43 an adducted first metatarsal, 30,35 and narrowing of the medial aspect of the talonavicular joint combined with plantar displacement of the navicular and cuneiforms. 35 However, to date, no studies have documented the statistical significance for any of these factors. Similarly, while a cavus foot type has been suggested to predispose patients to lower extremity stress fractures in general, 9 a relationship between foot type and NSF has not been established, as NSFs have been observed in patients with rectus, cavus, and planus feet. 11,18,35,38
There are even fewer studies examining how an NSF influences foot biomechanics. The most comprehensive of these is a study by Ting et al, 41 which examined rearfoot kinematics and ground-reaction forces in 10 competitive distance runners: 5 who had sustained an NSF and 5 control participants. No differences in the loading rate from the vertical ground-reaction force were observed, and while the runners with NSFs appeared to have higher amounts and velocities of foot pronation, these variables were not evaluated statistically, nor were any mean values provided. More recently, a study by North and Foley 30 reported plantar pressure measurements on 2 Australian rules football athletes who had previously sustained NSFs, with both athletes demonstrating higher peak pressures under the second metatarsophalangeal joint on the injured foot compared with the uninjured foot.
Given the relative paucity of studies examining foot biomechanics in runners with NSFs, the purpose of the current study was to compare anatomic alignment, foot structure, and foot biomechanics in runners with and without a history of surgically repaired unilateral NSFs. More specifically, comparisons were made between the involved and noninvolved feet of runners who had sustained an NSF as well as between the involved limbs of NSF participants and uninjured controls. It was hypothesized that the involved feet of the participants with an NSF would demonstrate less dorsiflexion and subtalar range of motion in a clinical examination and greater rearfoot eversion and higher eversion velocity while running than either the noninvolved feet or healthy controls.
Methods
Participants
Seven long-distance runners with a history of unilateral NSFs and a matching sample of healthy controls who had never sustained an NSF participated in this study. Participants were matched based on their age, weekly running mileage, and foot strike pattern (Table 1). At the time of testing, all control participants were healthy and participating in their regular training program. All 7 participants with an NSF had their stress fracture surgically repaired, with 4 of the 7 being treated at the clinical practice of one of the authors (S.J.). Surgical repair for these 4 patients consisted of screw fixation via two 4.0-mm cannulated screws placed perpendicular across the fracture site. Screws were placed under C-arm imaging using guide wires. Postoperatively, patients were nonweightbearing for 6 weeks, followed by 6 weeks using a walking boot, after which healing of the navicular in the anatomic position without collapse of the arch was confirmed via computed tomography. While the remaining 3 participants all had their fracture surgically repaired, the details of their surgical care, follow-up, and return to activity programs were not available. However, at the time of testing, all participants with an NSF had resumed their regular training and were running without restriction. Across all 7 participants, the mean time between their surgery and participation in this study was 3.2 ± 2.5 years. Before beginning the study, all participants read and signed an informed consent form approved by the university’s institutional review board.
Participant Demographics a
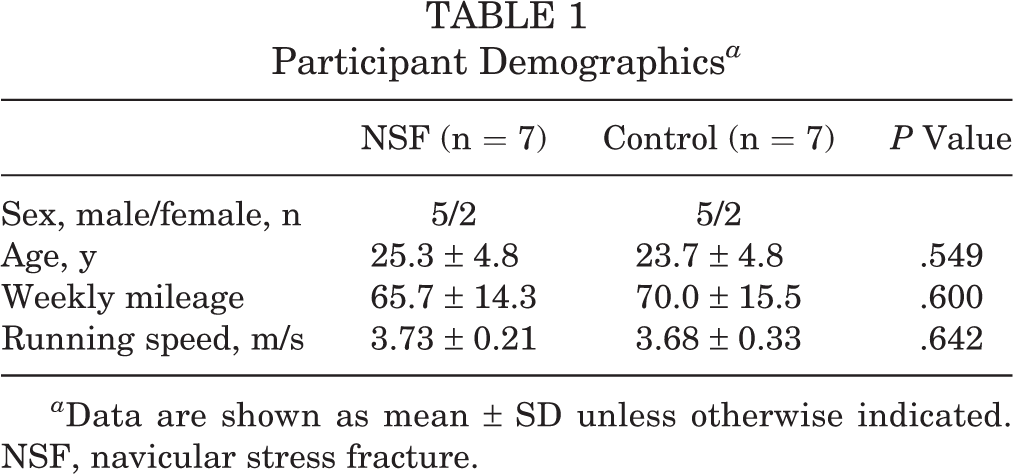
a Data are shown as mean ± SD unless otherwise indicated. NSF, navicular stress fracture.
Clinical Examination
Participants first underwent a clinical orthopaedic examination documenting lower extremity alignment, flexibility, and range of motion. Based on previously suggested anthropometric differences in runners with NSFs, 9,19,30,35,43 the following measurements were recorded: arch height, ankle active dorsiflexion and plantar flexion range of motion, passive subtalar joint inversion and eversion range of motion, eversion-inversion ratio, and standing tibia varus angle. Arch height was measured using the arch height index as described by Williams et al. 44 Dorsiflexion, plantar flexion, subtalar range of motion, and tibia varus angle were measured with a handheld goniometer using the techniques described by Wooden. 45 All measurements were performed by a single investigator (S.J.), an orthopaedic physician with over 50 years of experience performing these measurements and treating injured runners. The physician was not blinded to which foot had sustained the NSF, as he was the clinician who treated these runners on a regular basis.
Running Gait Analysis
After the clinical examination, participants completed a 3-dimensional running gait analysis. Retroreflective markers were placed on the midpoint between the posterior superior iliac spines and bilaterally on the following anatomic landmarks: anterior superior iliac spines, medial and lateral femoral epicondyles, medial and lateral malleoli, base of the fifth metatarsal, navicular tuberosity, and head of the second metatarsal. Additional tracking markers were placed bilaterally on the lateral aspect of the thigh and on the distal medial aspect of the shank. For the rearfoot segment, 2 markers were placed along the vertical bisection of the heel counter and 1 marker on the lateral aspect of the heel counter. All markers on the feet were visible through holes cut in the shoes and were either placed directly on the skin or on small wands which protruded through the holes in the heel counter (Figure 1).

Rear and lateral views of foot marker placement.
A static calibration trial was performed, after which the markers on the medial femoral epicondyles and medial malleoli were removed. Participants were allowed 5 minutes of jogging on a treadmill to warm up. They then ran continuous laps around a short (∼50-m) track in the laboratory. 3 Data were collected while participants passed through the middle 5 m of one straight section. Whole-body kinematics were recorded using a 10-camera motion capture system (Motion Analysis), sampling at 200 Hz. Ground-reaction forces were recorded using 3 force plates (AMTI), sampling at 1000 Hz. Participants ran continuous laps at a speed that approximated their easy training pace until at least 8 acceptable trials per foot were recorded. A trial was deemed acceptable if the foot landed in the middle of 1 of the 3 force plates with no visual evidence that the participant modified his or her stride to target the force plate.
Data Processing and Analysis
Raw marker trajectories and ground-reaction forces were exported to Visual3D (C-Motion), where they were filtered using fourth-order, zero-lag Butterworth filters with cutoff frequencies of 8 Hz and 50 Hz, respectively. A 2-segment foot model was used to describe foot kinematics. The rearfoot segment included the calcaneus and talus, with the coordinate system established according to recommendations of the International Society of Biomechanics. 46 The forefoot segment included the tarsals, metatarsals, and phalanges. The origin for the forefoot coordinate system was the midpoint between the navicular tuberosity and fifth metatarsal tuberosity markers. The forefoot x-axis pointed from the forefoot origin to the marker on the second metatarsal; the y-axis was perpendicular to the plane defined by the navicular, fifth metatarsal, and second metatarsal markers, pointing superiorly; and the z-axis was orthogonal to both the x- and y-axes, pointing laterally. Ankle and rearfoot-forefoot joint angles were calculated as Cardan angles describing the movement of the distal segment relative to the proximal segment using a dorsiflexion–plantar flexion, eversion-inversion, internal-external rotation (rearfoot-shank)/abduction-adduction (forefoot-rearfoot) sequence. Segment angles were calculated as rotations of the local segment coordinate systems relative to the fixed laboratory coordinate system using the same rotation sequence. From the filtered joint and segment kinematics, the following dependent variables were then calculated: tibia varus angle at foot contact, forefoot abduction at foot contact, forefoot abduction excursion, rearfoot eversion at foot contact, rearfoot eversion excursion, and maximum instantaneous rearfoot eversion velocity. From the filtered ground-reaction forces, the following dependent variables were calculated: peak anterior-posterior braking force, peak vertical ground-reaction force, and peak instantaneous vertical loading rate. If no discernable impact peak was present in the vertical ground-reaction force curve, then the peak instantaneous vertical loading rate was calculated as the peak value over the first 20% of the stance phase.
Statistical Analysis
Paired t tests were used to compare age, weekly running mileage, and running speed between the NSF and control groups during testing. For the clinical examination, kinematic, and kinetic variables, we were specifically interested in the following comparisons: differences between the involved and noninvolved feet of the NSF group, differences between the involved feet of the NSF group and control feet, and last, differences between the noninvolved feet of the NSF group and the control feet. Therefore, a 2 × 2 (foot × group) mixed analysis of variance was used to evaluate differences. Foot was a within-participant factor with 2 levels: the involved foot and noninvolved foot. Group was a between-participant factor, also with 2 levels: NSF group and control group. In the control group, the control foot was interpreted as the same foot in which the matched participant with an NSF had his or her stress fracture.
The third comparison was included to determine whether there is something unique about the involved feet of the NSF group compared with both the noninvolved feet and control feet. Statistically, this comparison would represent a significant foot × group interaction effect. However, it also represents a cross-comparison in a traditional 2 × 2 analysis of variance design. Therefore, in the event of a significant foot × group interaction, post hoc pairwise comparisons were conducted using paired t tests. To control for type I errors, an alpha of 0.0166 (.05/3) was used to indicate statistically significant differences for all pairwise comparisons. Effect sizes (Cohen d) were calculated to aid in the interpretation of significant differences, with ranges of ≤0.2, 0.21 to 0.5, and ≥0.51 representing small, medium, and large effects, respectively. 8 All statistical tests were conducted using Statistical Package for the Social Sciences version 23 (IBM).
Results
Clinical Examination Variables
Age, weekly mileage, and running speed during testing were all not different between the NSF and control groups (see Table 1). No significant foot × group interaction effects or main effects of foot were observed for any of the clinical examination variables (Table 2). There was a significant group effect for plantar flexion range of motion, with both the involved and noninvolved feet of the NSF group having significantly less plantar flexion range of motion than the control feet (F 1,12 = 5.75, P = .034). These differences demonstrated large effect sizes (Table 3). For all other clinical examination variables, the main effect of group was nonsignificant (Table 2).
Measurements for Clinical Examination, Kinematic, and Kinetic Variables a
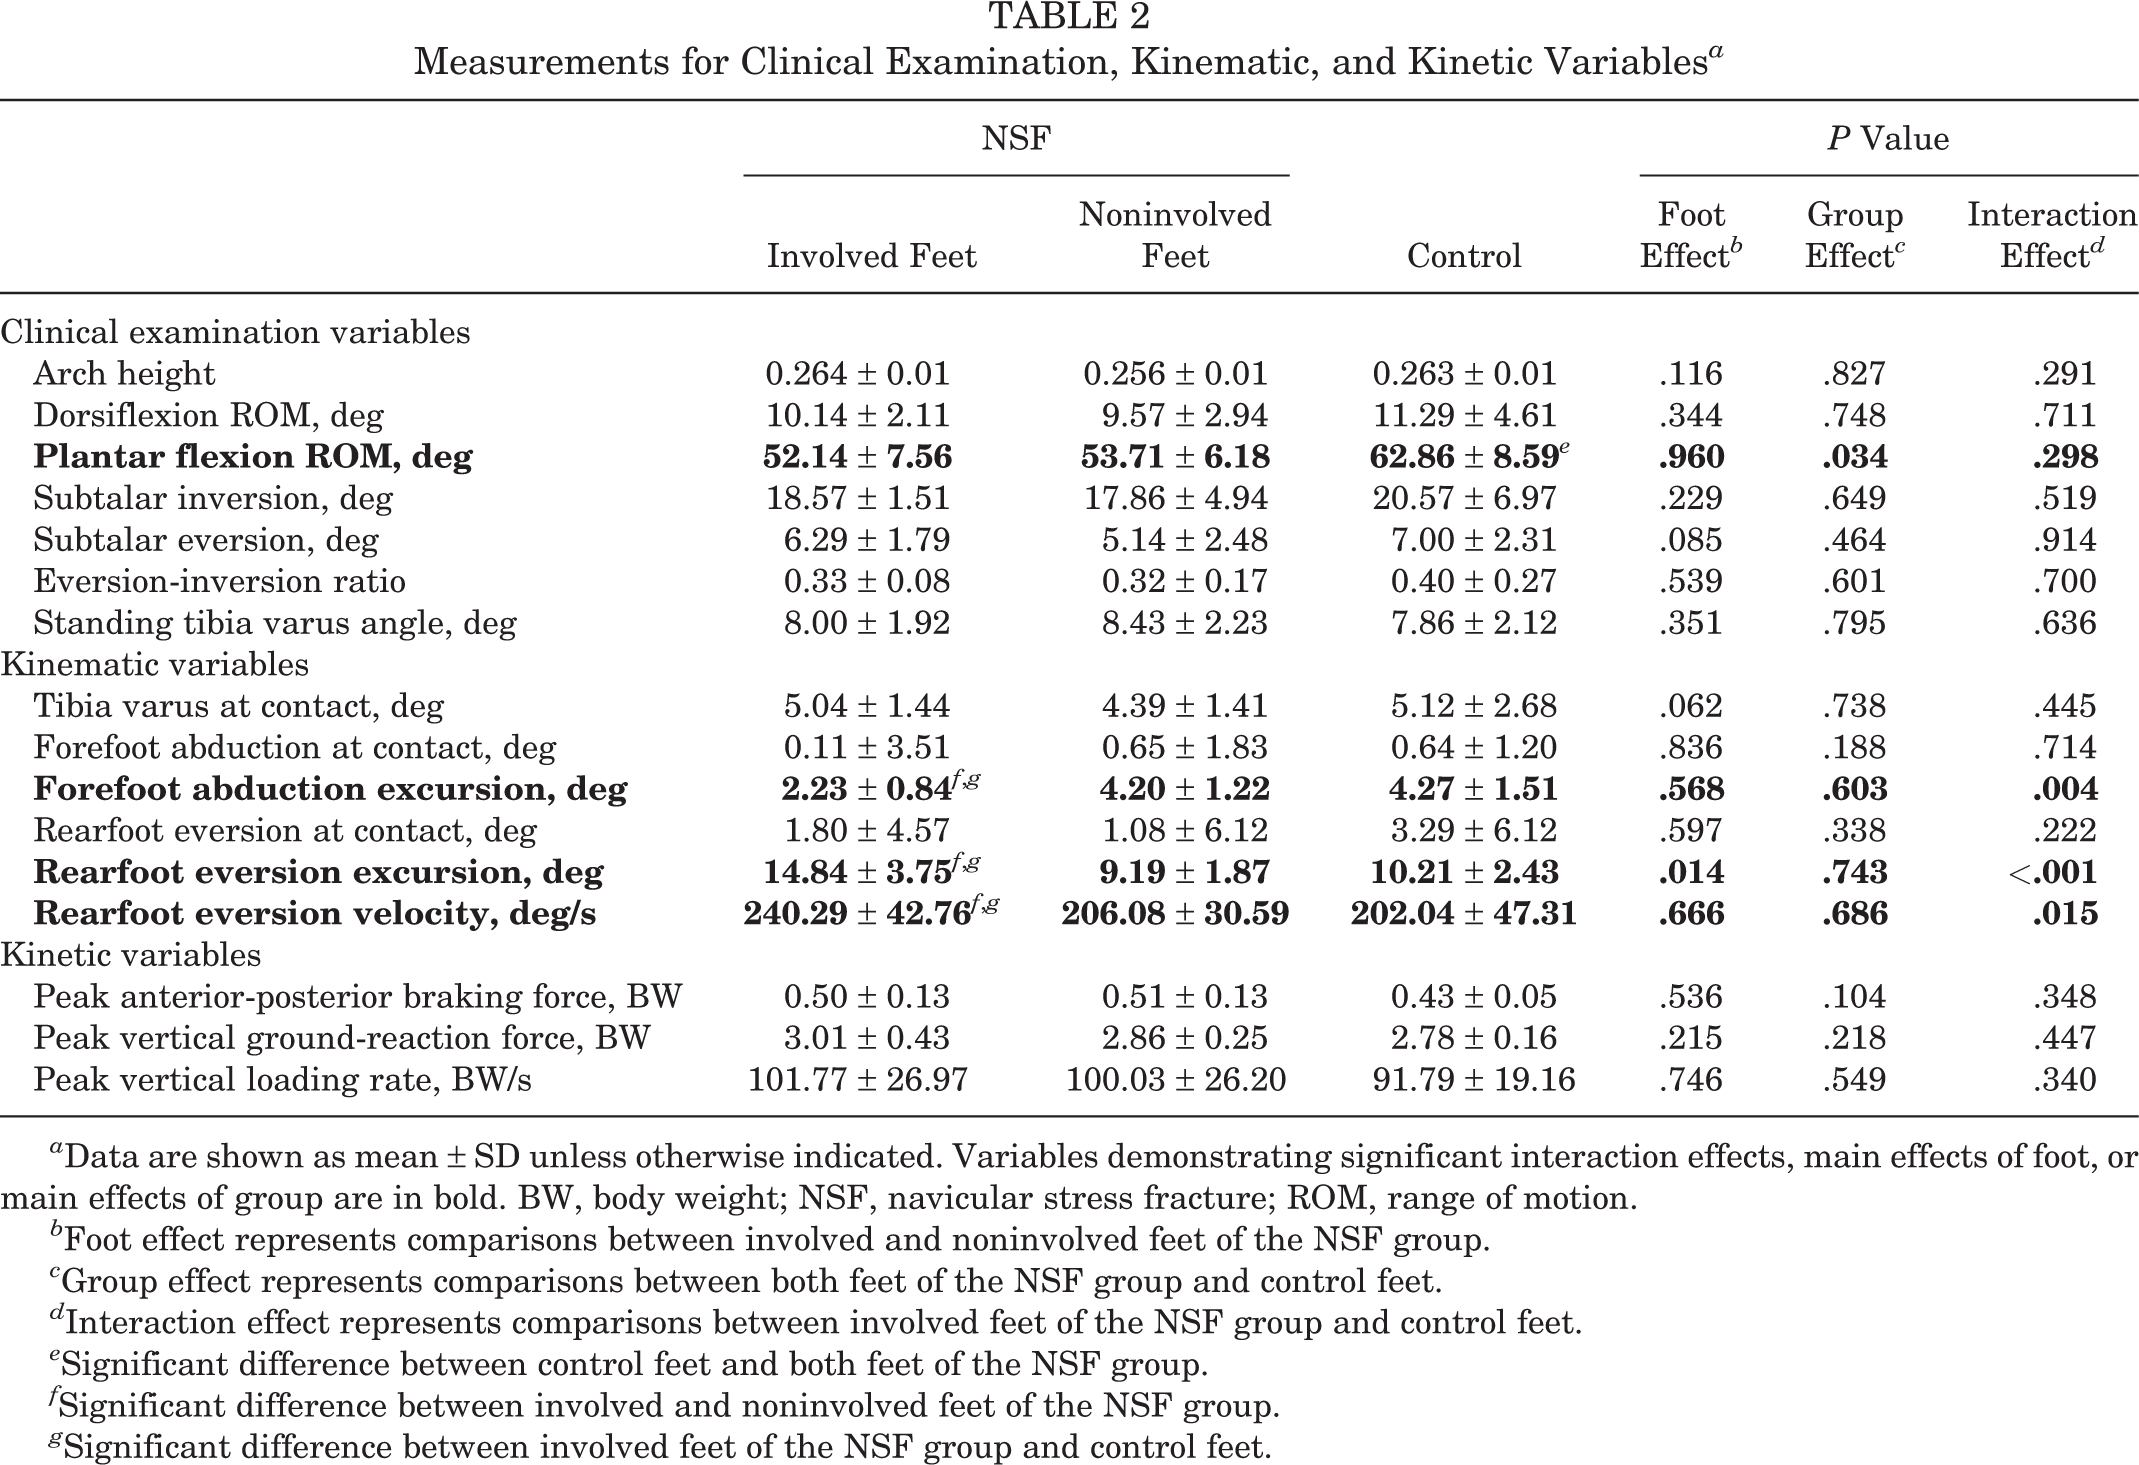
a Data are shown as mean ± SD unless otherwise indicated. Variables demonstrating significant interaction effects, main effects of foot, or main effects of group are in bold. BW, body weight; NSF, navicular stress fracture; ROM, range of motion.
b Foot effect represents comparisons between involved and noninvolved feet of the NSF group.
c Group effect represents comparisons between both feet of the NSF group and control feet.
d Interaction effect represents comparisons between involved feet of the NSF group and control feet.
e Significant difference between control feet and both feet of the NSF group.
f Significant difference between involved and noninvolved feet of the NSF group.
g Significant difference between involved feet of the NSF group and control feet.
Effect Sizes (Cohen d) for Clinical Examination, Kinematic, and Kinetic Variables a

a Small effect, ≤0.2; medium effect, 0.21-0.5; large effect, ≥0.51. Variables demonstrating significant interaction effects, main effects of foot, or main effects of group are in bold. BW, body weight; NSF, navicular stress fracture; ROM, range of motion.
b Statistically significant differences between control feet and both feet of the NSF group.
c Statistically significant differences between involved and noninvolved feet of the NSF group.
d Statistically significant differences between involved feet of the NSF group and control feet.
Kinematic and Kinetic Variables
There were no significant foot × group interaction effects, main effects of foot, or main effects of group for tibia varus at foot contact, forefoot abduction at foot contact, rearfoot eversion at foot contact, or any of the 3 kinetic variables (Table 2). These comparisons all resulted in mostly small effect sizes (Table 3). There was a significant foot × group interaction for forefoot abduction excursion (F 1,12 = 12.25, P = .004). Post hoc comparisons revealed that the involved feet of the NSF group had less forefoot abduction excursion than either the noninvolved (P = .015) or control feet (P = .005), with both differences resulting in large effect sizes. However, forefoot abduction excursion was not significantly different between the noninvolved and control feet (P = .936), and the effect size for this comparison was small (Table 3). Ensemble average curves for forefoot abduction-adduction and ground-reaction force are shown in Figures 2 and 3, respectively.
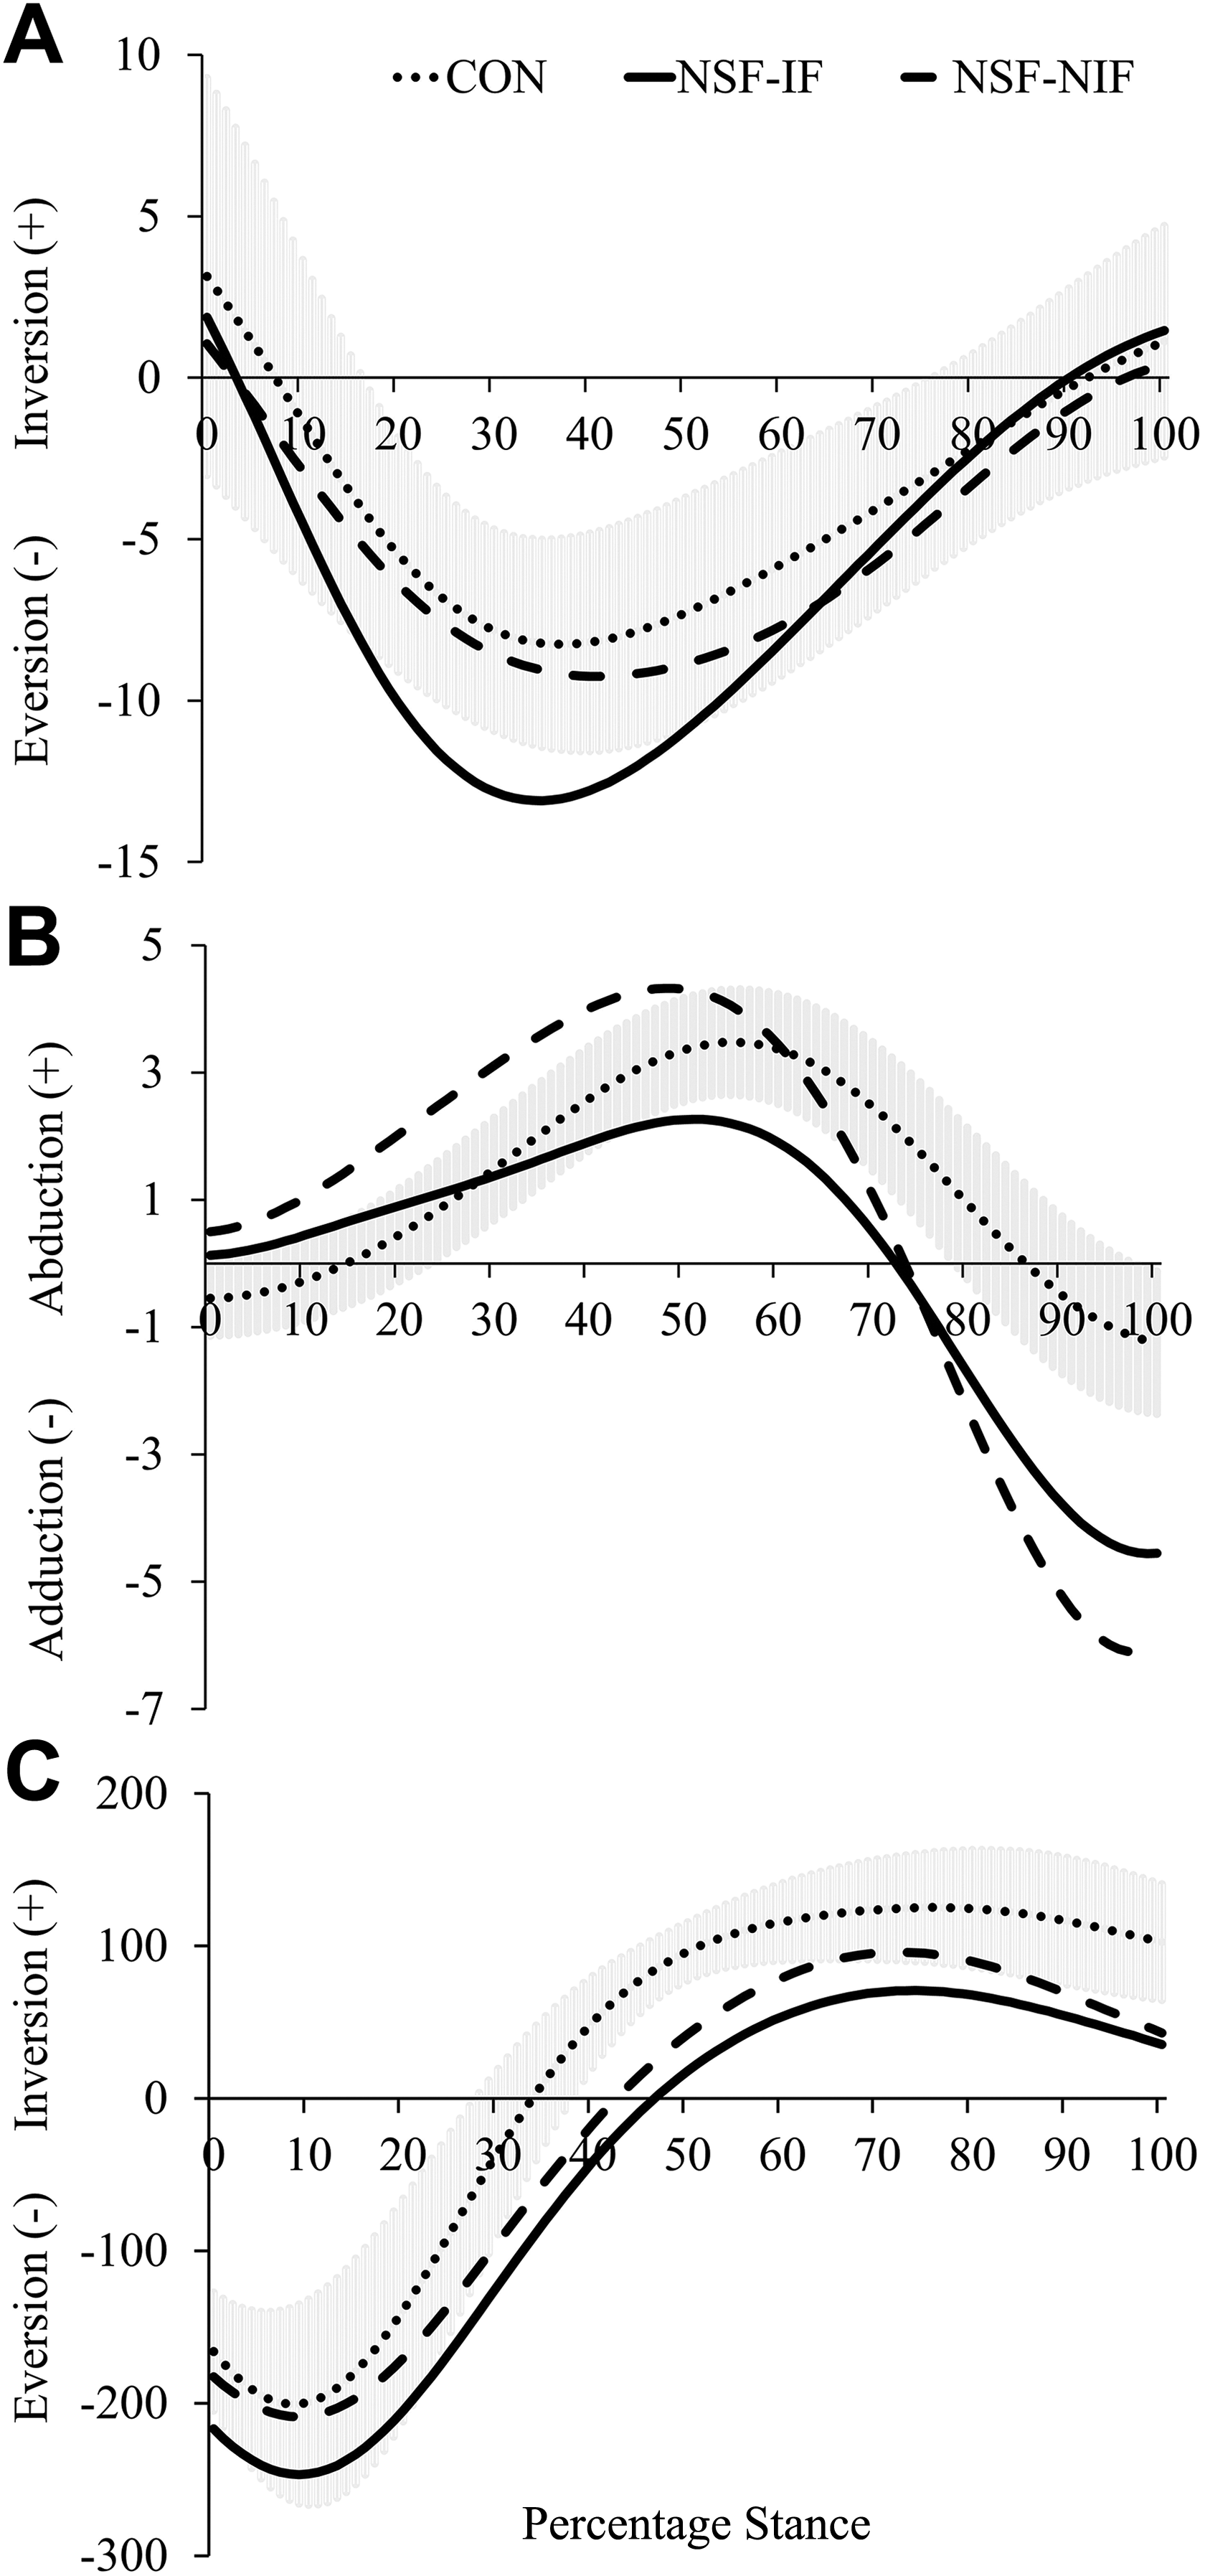
Ensemble average curves for (A) rearfoot eversion/inversion, (B) forefoot adduction/abduction, and (C) rearfoot eversion velocity. Dotted lines are the control feet, solid lines are the involved feet of the navicular stress fracture (NSF) group, and dashed lines are the noninvolved feet of the NSF group. Shaded band represents ±1 SD of the control group.

Ensemble average curves for (A) anterior-posterior ground-reaction force and (B) vertical ground-reaction force. Dotted lines are the control feet, solid lines are the involved feet of the navicular stress fracture (NSF) group, and dashed lines are the noninvolved feet of the NSF group. Shaded band represents ±1 SD of the control group. BW, body weight; CON, control; IF, involved foot; NIF, noninvolved foot.
There was also a significant foot × group interaction for rearfoot eversion excursion (F 1,12 = 14.361, P < .001). Post hoc comparisons revealed that the involved feet of the NSF group demonstrated significantly more rearfoot eversion excursion than the noninvolved (P = .015) or control feet (P = .012), with both comparisons resulting in large effect sizes (Table 3). Eversion excursion was not significantly different between the noninvolved and control feet (P = .314), although the comparison yielded a moderate effect size (Table 3).
Last, there was a significant foot × group interaction for maximum instantaneous rearfoot eversion velocity (F 1,12 = 8.143, P = .015). Post hoc comparisons revealed that eversion velocity was higher in the involved feet of the NSF group than either the noninvolved (P = .015) or control feet (P = .016), with both comparisons yielding large effect sizes (Table 3). However, eversion velocity was not different between the control and noninvolved feet (P = .886) (Table 3). Ensemble average curves for rearfoot eversion-inversion and rearfoot eversion velocity are shown in Figure 2.
Discussion
The purpose of the current study was to compare anatomic alignment, foot structure, and foot biomechanics in runners with and without a history of unilateral NSFs. The results show that even several years after the injury, there are differences in foot kinematics both between the involved and noninvolved feet of a runner who has sustained an NSF and between runners who have sustained an NSF and those who have not. Compared with the noninvolved or control foot, the foot that sustained an NSF demonstrated greater amounts of rearfoot eversion, reduced amounts of forefoot abduction, and higher peak rearfoot eversion velocities. Finally, regardless of whether the involved or noninvolved feet were examined, runners who sustained an NSF demonstrated less passive ankle plantar flexion range of motion than runners who had never sustained this injury.
There is currently no consensus in the literature regarding whether there are intrinsic foot structural differences between patients who have and have not sustained an NSF. Limited ankle dorsiflexion and subtalar eversion range of motion, 19,43 an adducted first metatarsal, 30,35 and plantar displacement of the cuneiforms 35 have all been reported in patients who have sustained an NSF. However, to date, none of these studies have reported statistically significant differences between patients who have and have not sustained an NSF. Similarly, Ting et al 41 did not find any differences in radiographic measures of calcaneal pitch angle, metatarsal pitch angle, or talus-metatarsal angle between patients with an NSF and uninjured controls. NSFs have also been reported in patients with rectus, planus, and cavus feet, 11,18,35,38 suggesting that foot type may not play a large role in this injury. Taken as a whole, these studies suggest that there are minimal differences in foot structure or mobility between patients who do and do not sustain an NSF. This is further supported by the current study, which found no statistically significant differences between any of the feet for ankle dorsiflexion, subtalar joint range of motion, or standing tibia varus angle. The only differences in foot mobility observed in the current study were that participants with NSFs had less passive plantar flexion range of motion than controls. However, this was true for both the involved and noninvolved feet of the NSF group, with no differences between the feet. It is unclear why one foot developed an NSF while the other did not when both feet displayed limited passive plantar flexion range of motion. Whether any relationship exists between passive plantar flexion range of motion on joint loading requires further investigation.
The only previous study examining biomechanics in runners who had sustained an NSF was reported by Ting et al. 41 Similar to the findings in the current study, Ting et al. 41 reported that there were no differences in the vertical loading rate between participants with an NSF and controls. Observing a 2-dimensional frontal-plane view while runners with an NSF ran on a treadmill, Ting et al 41 suggested that 4 of their 5 patients with an NSF demonstrated higher amounts and velocities of rearfoot eversion compared with control participants. However, this was based on a qualitative analysis and not tested statistically. Thus, to our knowledge, the current study is the first to provide quantitative data confirming the qualitative observations of Ting et al. 41 This is also the first study to use a multisegmented foot model to study biomechanical factors related to an NSF and thus is the first to show reduced forefoot abduction excursion in runners with NSFs.
This combination of higher rearfoot eversion and reduced forefoot abduction is especially relevant in relation to the hypothesis on how altered foot biomechanics may lead to an NSF in the first place. It is well documented that during foot pronation and supination, there is substantial movement across the talonavicular, calcaneocuboid, and cuneonavicular joints. 1,20,24 –26 Studies using both fluoroscopy 20,23 and intracortical bone pins 1 have demonstrated that as the calcaneus everts, the talus rotates medially, causing the talar head to apply force to the lateral aspect of the navicular. Simultaneously, both the first metatarsal and the medial cuneiform abduct relative to the navicular. On the medial side, the tibialis posterior tendon, which inserts onto the navicular tuberosity, demonstrates a large burst of activity from the middle through late stance. 31 This combination of forces on the medial and lateral sides of the navicular creates shear stress across the middle of the bone. 20 Because radiographic evidence shows that NSF injuries typically occur in the middle third of the navicular, 14,18,19,35 several authors have hypothesized that abnormalities in foot kinematics or anatomic variation, such as a short first metatarsal or long second metatarsal, concentrate or even increase stress in the central third of the bone. 11,34
To date, there have not been any prospective studies examining foot kinematics in patients who subsequently develop an NSF. However, the increased rearfoot eversion and reduced forefoot abduction observed in the current study could intensify shear stress across the middle third of the navicular. If the forefoot does not abduct relative to the rearfoot, then there would be increased pressure from the talar head on the lateral side of the navicular. The effect might be compounded when combined with increased rearfoot eversion and eversion velocity, as increased movement of the talus, which accompanies increased eversion, would likely place higher levels of force on the lateral aspect of the navicular. Additionally, greater amounts and velocities of eversion would likely result in higher forces from the tibialis posterior muscle, as one of its major functions is controlling the amount and velocity of eversion. 37 Even though activity of the tibialis posterior may not increase with increased eversion, 31,32 the muscle also produces force through passive mechanisms that are sensitive to both the amount and rate of stretch that the muscle experiences. 21 Therefore, the higher amounts and velocities of eversion would likely result in higher forces from the tibialis posterior muscle. The combination of higher forces on both the lateral and medial aspects of the bone would increase shear stress through the middle third of the bone.
There are some limitations that must be considered when interpreting the results of this study. This study was performed using a small convenience sample of participants, all of whom were high-level runners. Thus, we cannot be certain whether similar results would be observed in a larger sample or in recreationally active persons. Given the retrospective nature of this study, we cannot determine whether the altered foot kinematics were related to the development of NSFs or occurred after the injury had been sustained. We also cannot conclusively identify a mechanistic explanation for the increased rearfoot eversion and eversion velocity. One possibility is that the involved feet of the NSF group had weaker ankle invertors than the noninvolved or control feet. It has been suggested that stronger ankle muscles result in lower joint forces, 29 and therefore, weakness of the ankle invertor muscles could be related to higher joint loading. However, this relationship is hypothetical based on modeling studies, and to date, there is a dearth of studies documenting relationships between invertor strength and rearfoot kinematics during running. Additionally, differences in ankle invertor strength would not explain the difference in forefoot abduction.
Another possible explanation for the increased rearfoot eversion and eversion velocity in the NSF group is differences in neural control of foot kinematics. In a preliminary study on these same participants, we observed differences in the forefoot-rearfoot coordination patterns. 2 It has previously been shown that runners with injuries demonstrate less coordination variability than noninjured runners. 15 A functional interpretation of these findings suggests that with low coordination variability, biological tissues are loaded in exactly the same manner on each stride. The increased rearfoot eversion and reduced forefoot abduction in the involved feet of the NSF group would increase loading across the navicular, and if this higher load is applied in the same manner on each step, then this could, over time, result in the injury. However, future studies are required to confirm whether reduced forefoot-rearfoot coordination is observed in patients who subsequently develop an NSF.
Another limitation that must be considered when interpreting the results of this study is that all the participants with NSFs had their injury surgically repaired. Currently, there is an ongoing discussion in the orthopaedic literature regarding standard of care and best practices for the treatment of NSFs, with a particular emphasis on operative versus nonoperative treatment. 12,18,36,39,42 All participants in the current study had their NSF surgically repaired, a procedure that typically involves open reduction and internal fixation and, in more severe cases, may also include bone grafting. 10,17,33,39 While there are numerous studies documenting clinical outcomes after NSF surgical repair, 18,36,39 there are currently no reports in the literature documenting how, or if, the surgical procedure affects normal foot function. The participants with NSFs in the current study demonstrated differences between their involved and noninvolved feet several years after their surgery. Yet, the noninvolved feet of the NSF group were not different from the control feet. Thus, it is possible that surgery had an effect on foot function. Several studies have reported that patients who have undergone surgical repair for NSFs demonstrate small but measureable amounts of pain, tenderness over the navicular, and loss of function even years after surgery. 6,36 When considered in combination with the findings from the current study, this highlights the need for future studies examining whether treatment protocols for NSFs influence foot function after treatment. The use of multisegmented foot models in combination with synchronized plantar pressure measurements is rapidly becoming more common in clinically applied foot biomechanical studies. 7,13 Such techniques, especially when coupled with musculoskeletal models, allow for detailed measurements of foot kinematics and the estimation of internal forces within the foot. Applying such techniques to prospective studies on NSFs, in combination with measures of arch deformation during stance and measures of inversion strength, would provide insights into the validity of current hypotheses regarding injury development as well as provide clinicians with detailed metrics for quantifying treatment outcomes.
A last limitation that must be considered, especially when applying the results of the current study in any clinical setting, is that at this point, the clinical significance of the differences in foot kinematics observed in the current study is unclear. All of the differences noted in the current study demonstrated moderate to large effect sizes, suggesting that they should be clinically meaningful. However, as this is the first study to analyze detailed 3-dimensional foot kinematics in patients with NSFs, and no studies to date have used foot biomechanics as an outcome measure for NSF treatment, there is minimal existing literature to compare with our results. While they were not biomechanically evaluated again, we did remain in contact with the participants after the clinical and biomechanical assessments described in the current study. Of the 7 participants with NSFs, 4 subsequently developed additional injuries (1 a second NSF, 3 metatarsal stress fractures). Whether the altered foot kinematics observed in the current study contributed to the development of these subsequent injuries is unknown. Future long-term follow-up studies examining the incidence of subsequent injuries after NSFs are required to fully clarify the clinical implications of the altered foot kinematics observed in the present study.
In summary, the current study was the first to quantitatively report foot kinematics in patients who have a history of NSFs. We found that runners with a retrospective history of NSFs had higher amounts of rearfoot eversion excursion, higher eversion velocity, and reduced forefoot abduction in their injured feet compared with their noninjured feet or in matching controls. Clinicians treating patients with NSFs should be aware that abnormal foot kinematics may exist after treatment and consider measures such as orthotics or physical therapy to correct these kinematics. Additionally, we suggest that foot biomechanics be considered as an outcome measure after NSF treatment. However, future prospective studies are required to see if these altered kinematics are predictive of patients who might sustain an NSF or are a result of the NSF injury or surgical repair used to treat the injury.
Footnotes
The authors declared that they have no conflicts of interest in the authorship and publication of this contribution.
Ethical approval for this study was approved by the University of Oregon Committee for the Protection of Human Subjects (protocol No. C1-556-10).