
Abstract
Background:
Pitching while fatigued and body composition may increase the injury risk in youth and adult pitchers. However, the relationships between game pitch count, biomechanics, and body composition have not been reported for a study group restricted to 9- to 10-year-old athletes.
Hypothesis:
During a simulated game with 9- to 10-year-old athletes, (1) participants will experience biomechanical signs of fatigue, and (2) shoulder and elbow kinetics will correlate with body mass index (BMI).
Study Design:
Descriptive laboratory study.
Methods:
Thirteen 9- to 10-year-old youth baseball players pitched a simulated game (75 pitches). Range of motion and muscular output tests were conducted before and after the simulated game to quantify fatigue. Kinematic parameters at foot contact, maximum external rotation, and maximum internal rotation velocity (MIRV), as well as maximum shoulder and elbow kinetics between foot contact and MIRV were compared at pitches 1-5, 34-38, and 71-75. Multivariate analyses of variance were used to test the first hypothesis, and linear regressions were used to test the second hypothesis.
Results:
MIRV increased from pitches 1-5 to 71-75 (P = .007), and head flexion at MIRV decreased from pitches 1-5 to 34-38 (P = .022). Maximum shoulder horizontal adduction, external rotation, and internal rotation torques increased from pitches 34-38 to 71-75 (P = .031, .023, and .021, respectively). Shoulder compression force increased from pitches 1-5 to 71-75 (P = .011). Correlations of joint torque/force with BMI were found at every pitch period: for example, shoulder internal rotation (R 2 = 0.93, P < .001) and elbow varus (R 2 = 0.57, P = .003) torques at pitches 1-5.
Conclusion:
Several results differed from those of previous studies with adult pitchers: (1) pitch speed remained steady, (2) shoulder MIRV increased, and (3) shoulder kinetics increased during a simulated game. The strong correlations between joint kinetics and BMI reinforce previous findings that select body composition measures may be correlated with pitching arm joint kinetics for youth baseball pitchers.
Clinical Relevance:
The results improve our understanding of pitching biomechanics for 9- to 10-year-old baseball pitchers and may be used in future studies to improve evidence-based injury prevention guidelines.
Pitching arm injuries in young baseball players have steadily increased in recent years. 13 For example, one study reported that the ulnar collateral ligament (UCL) reconstructive (Tommy John) surgery rate in 15- to 19-year-old patients increased 9% per year from 2007 to 2011. 8 High and/or repetitive elbow and shoulder torques and forces are thought to be mechanisms of pitching arm injuries in baseball, including UCL damage. 3,16,18,37 Such overuse injuries likely begin during youth play 13,27 ; consequently, the identification of injury risk factors and prevention methods for youth baseball players have been advocated. 13
One risk factor for pitching arm injuries is routinely pitching while fatigued. 33 A study that surveyed 140 adolescent pitchers (14-20 years old) reported that pitchers who had undergone surgery were 36 times more likely to have routinely pitched with arm fatigue. 32 Another risk factor is the amount of pitching (months per year, pitches per season or game); youths playing on multiple teams and/or year round may easily exceed recommended guidelines. 13 Additionally, while body composition measures (eg, body weight, arm fat mass percentage) have not been formally identified as risk factors, pitching arm joint torques have been positively correlated with total body and body fat masses; arm length; and segmental total, fat, and lean masses for 12- to 16-year-old pitchers 21 and with total body weight for 12-year-old pitchers. 37 However, previous studies have not investigated pitching arm kinetics with body mass index (BMI). Because children can have the same total body and arm masses but different BMIs (caused by different heights), it is not clear that pitching arm kinetics will be correlated with BMI. An advantage to considering BMI as a body composition measure for pitching arm kinetic correlations is that BMI is a relatively quick and easy parameter to calculate and thus is highly accessible to coaches and parents.
To reduce the injury risk among baseball players, Major League Baseball (MLB)/USA Baseball Pitch Smart guidelines established age-dependent game pitch limits. 33 For example, 9- to 10-year-old players are limited to 75 game pitches with a 4-day rest period. Such limits are the result of long-term epidemiological studies of pitching injuries 14,27,32 ; however, few studies 22,31 have aimed to observe biomechanical changes as youth pitchers approach current pitch limits. Several studies have shown that select biomechanical parameters (eg, joint kinematics and kinetics, muscular output, pitch speed) change in adult 10,29,30,38 and youth 31 pitchers as they approach or reach muscular fatigue in a single outing; thus, such changes may be signs of fatigue and an increased injury risk. Although biomechanical analyses have been performed with youth pitchers including 10-year-old players, 1,7,17,21,22,31,37 the relationships between game pitch count, kinematics, kinetics, and body composition have not been reported for a study group restricted to the 9- to 10-year-old range. Thus, there is no biomechanical evidence that a limit of 75 game pitches is appropriate for preventing fatigue and injuries in 9- to 10-year-old pitchers.
The goals of this study were to observe if, during a simulated game with 9- to 10-year-old pitchers and a limit of 75 game pitches, biomechanical signs of fatigue existed and if biomechanical parameters were correlated with BMI. The 2 hypotheses were that, during a simulated game with 9- to 10-year-old pitchers, (1) participants would experience biomechanical (kinematic, kinetic, pitch speed, muscular output) signs of fatigue, and (2) shoulder and elbow kinetics would both correlate with BMI.
Methods
Protocols were approved by our institutional review board and were designed to minimize the risk to human participants.
Participant Recruitment
To be eligible, a participant must have qualified as a 9- to 10-year-old player and had pitching experience during the 2016 Little League season and had no history of pitching-related injuries. This relatively narrow age range was chosen (1) to focus on the recommended game pitch count limits for this group (ie, the recommended limits for 7- to 8-, 9- to 10-, and 11- to 12-year-old players are 50, 75, and 85 pitches, respectively) and (2) because youth pitching biomechanics vary substantially with age (please see the Discussion section). Thirteen male baseball players (mean age, 10.2 ± 0.4 years; mean height, 143.4 ± 7.2 cm; mean weight, 38.6 ± 8.0 kg; mean BMI, 18.3 ± 2.8 kg/m 2 ) volunteered; this sample size was chosen as an earlier study found this number to be sufficient for detecting biomechanical signs of fatigue in adult pitchers. 29 Of the 13 participants, 10 had recently played on their all-star teams, while the other 3 were selected to play on a club team. Also, 9 were normal weight, 3 were overweight, and 1 was obese, as defined by recommended guidelines 4 with an age-specific BMI growth chart for boys. 25 No effort was made to recruit pitchers of any specific BMI value because an investigation of significant correlations of biomechanical variables with BMI requires participants to be chosen at random from, and so that the BMI values are representative of, the target population (ie, 9- to 10-year-old youths with pitching experience in the preceding season).
Visit 1: Consent and Pregame Tests
Youth participants and a parent came to the laboratory, and informed consent and participant assent were obtained. Then, participants completed pregame tests to measure body weight, height, range of motion, and muscular output.
Range of motion and muscular output tests used previously for adult pitchers, 29 with the addition of lower arm flexion and wrist pronation muscular output, were conducted. These tests were performed for both arms (ie, dominant and nondominant) and hips (ie, pivot and nonpivot) to examine selective fatigue, as proposed in a previous study. 29 Averaged values from 3 repeated measurements were used for analysis.
Shoulder range of motion (internal rotation and external rotation) tests, using a goniometer (Model 62; Prestige Medical), were performed on both shoulders starting with the dominant arm. These tests were performed in the supine position at 90° of shoulder abduction and 90° of elbow flexion 29 ; the participant passively rotated his shoulder until end range of motion was reached.
A dynamometer (Vernier Software & Technology) was used for muscular output tests to measure isometric maximum voluntary contractions. Upper extremity tests began with the dominant arm, and lower extremity tests began with the pivot foot and were performed in the following order: shoulder flexion, abduction, scaption (ie, empty can), internal rotation, external rotation, adduction; middle trapezius; lower trapezius; rhomboids; hip flexion, abduction, adduction, extension; wrist pronation, flexion; and grip strength.
Shoulder flexion tests were performed in the supine position at 90° of flexion and the dynamometer at the radial styloid process. Shoulder abduction and adduction tests were performed in the supine position at 90° of abduction and the dynamometer at the dorsal and volar sides of the wrist, respectively. Scaption tests were performed in the sitting position with 90° of abduction, 30° of horizontal adduction, and the shoulder internally rotated until the thumb faced downward and the dynamometer was at the ulnar styloid process. Shoulder internal and external rotation tests were performed in the supine position at 90° of shoulder abduction and 90° of elbow flexion and the dynamometer at the volar and dorsal sides of the wrist, respectively.
Scapular muscular output tests were performed in the prone position. Middle trapezius tests were performed with 180° of flexion, 145° of abduction, and the thumb pointed upward and the dynamometer at the radial styloid process. Lower trapezius tests were performed with 90° of abduction and 90° of elbow flexion and the dynamometer at the distal humerus above the olecranon process. Rhomboid tests were performed with the hand placed right above the sacrum, 1 inch off of the back, with the palm toward the ceiling and the dynamometer at the ulnar and radial styloid processes.
Hip muscular output tests were performed in the sitting position with the participant grabbing the table for stabilization. Hip flexion, abduction, adduction, and extension tests were performed with the dynamometer at the distal end of the femur on the anterior, lateral, medial, and posterior sides of the thigh, respectively.
Lower arm tests were performed in the seated position. Pronation tests were performed with 90° of elbow flexion and the arm placed next to the body, with the participant holding a polyvinyl chloride (PVC) pipe with the palm facing the midsagittal plane and the dynamometer at 4 inches superior to the hand on the PVC pipe. Wrist flexion tests were performed with 90° of elbow flexion, the wrist supinated with the palm facing the ceiling, the arm cradled on the dorsal side for stabilization, and the dynamometer at the distal heads of the metacarpals. Grip tests were performed with 90° of elbow flexion, with the arm kept by the side and the participant squeezing the dynamometer for 3 seconds.
Visit 2: Simulated Game and Postgame Tests
On a second visit (mean, 4.3 days [range, 1-12 days]), it was confirmed that participants had not pitched in the previous 4 days. Then, participants completed warm-up exercises (stretching, jogging, and 20-25 nonpitching throws). Participants changed into compression clothing, and 34 retroreflective markers (19- or 12.7-mm diameters) were placed on anatomic landmarks based on the UETrak software (Motion Analysis) pitching marker set. 1 A static pose was captured to calculate lower extremity joint centers. After capturing the static pose, the medial lower extremity markers were removed.
Participants pitched off of a portable mound (height, 6 inches) (Figure 1) in the room’s center and into a net 23 ft away with a scaled strike zone. After every 5 pitches, the participant was asked to take a 30-second break to simulate a change in batters. After every 10 pitches, the participant was asked if any soreness or pain was felt. Participants threw 8 warm-up pitches, immediately followed by a 38-pitch inning, took a 15-minute break, and then threw 8 warm-up pitches, immediately followed by a 37-pitch inning (please see the Discussion section for the rationale for this protocol).

Participant pitching off the portable pitching mound during the simulated game. Shown is 1 of 8 motion analysis cameras (behind the participant at the top of the photo) as well as the retroreflective markers for recording kinematics.
A motion analysis system with 6 Owl and 2 Osprey Digital Cameras (Motion Analysis) was used to track markers. Marker trajectory was recorded in Cortex software (version 5.5; Motion Analysis) at 200 Hz, interpolated (third-order spline), and filtered (fourth-order Butterworth filter; cutoff frequency, 13.4 Hz). 17,28,41 A radar gun (Bushnell) was used to record pitch speed, which was not disclosed to the participants. Marker and pitch speed data were collected for 3 pitch periods defined by pitches 1-5, 34-38, and 71-75; these pitch periods were chosen to represent the beginning, middle, and end of the simulated game. The first 3 pitches with usable data in each pitch period were utilized to obtain averaged biomechanical parameters. All 5 pitches in each pitch period were used to obtain an averaged pitch speed value. The range of motion and muscular output tests described above were repeated approximately 15 minutes after the last pitch.
Analysis of Kinematics and Kinetics
Biomechanical parameters were processed using UETrak software. 1 Analyzed kinematic parameters included shoulder maximum internal rotation velocity (MIRV); stride length; pitch speed; shoulder horizontal adduction, elevation, and internal rotation; elbow flexion; head forward flexion, lateral flexion, and rotation; trunk lateral tilt, forward flexion, and rotation; pelvis rotation; and wrist pronation, flexion, and deviation (Figure 2). These parameters were extracted at 3 points in the pitching cycle that are commonly used for analysis 17,31 : nonpivot foot contact, shoulder maximum external rotation, and MIRV. MIRV, which occurs just after ball release, 17 was chosen as a time point for data analysis rather than ball release because of the ease of syncronizing real-time camera data and Cortex software data.
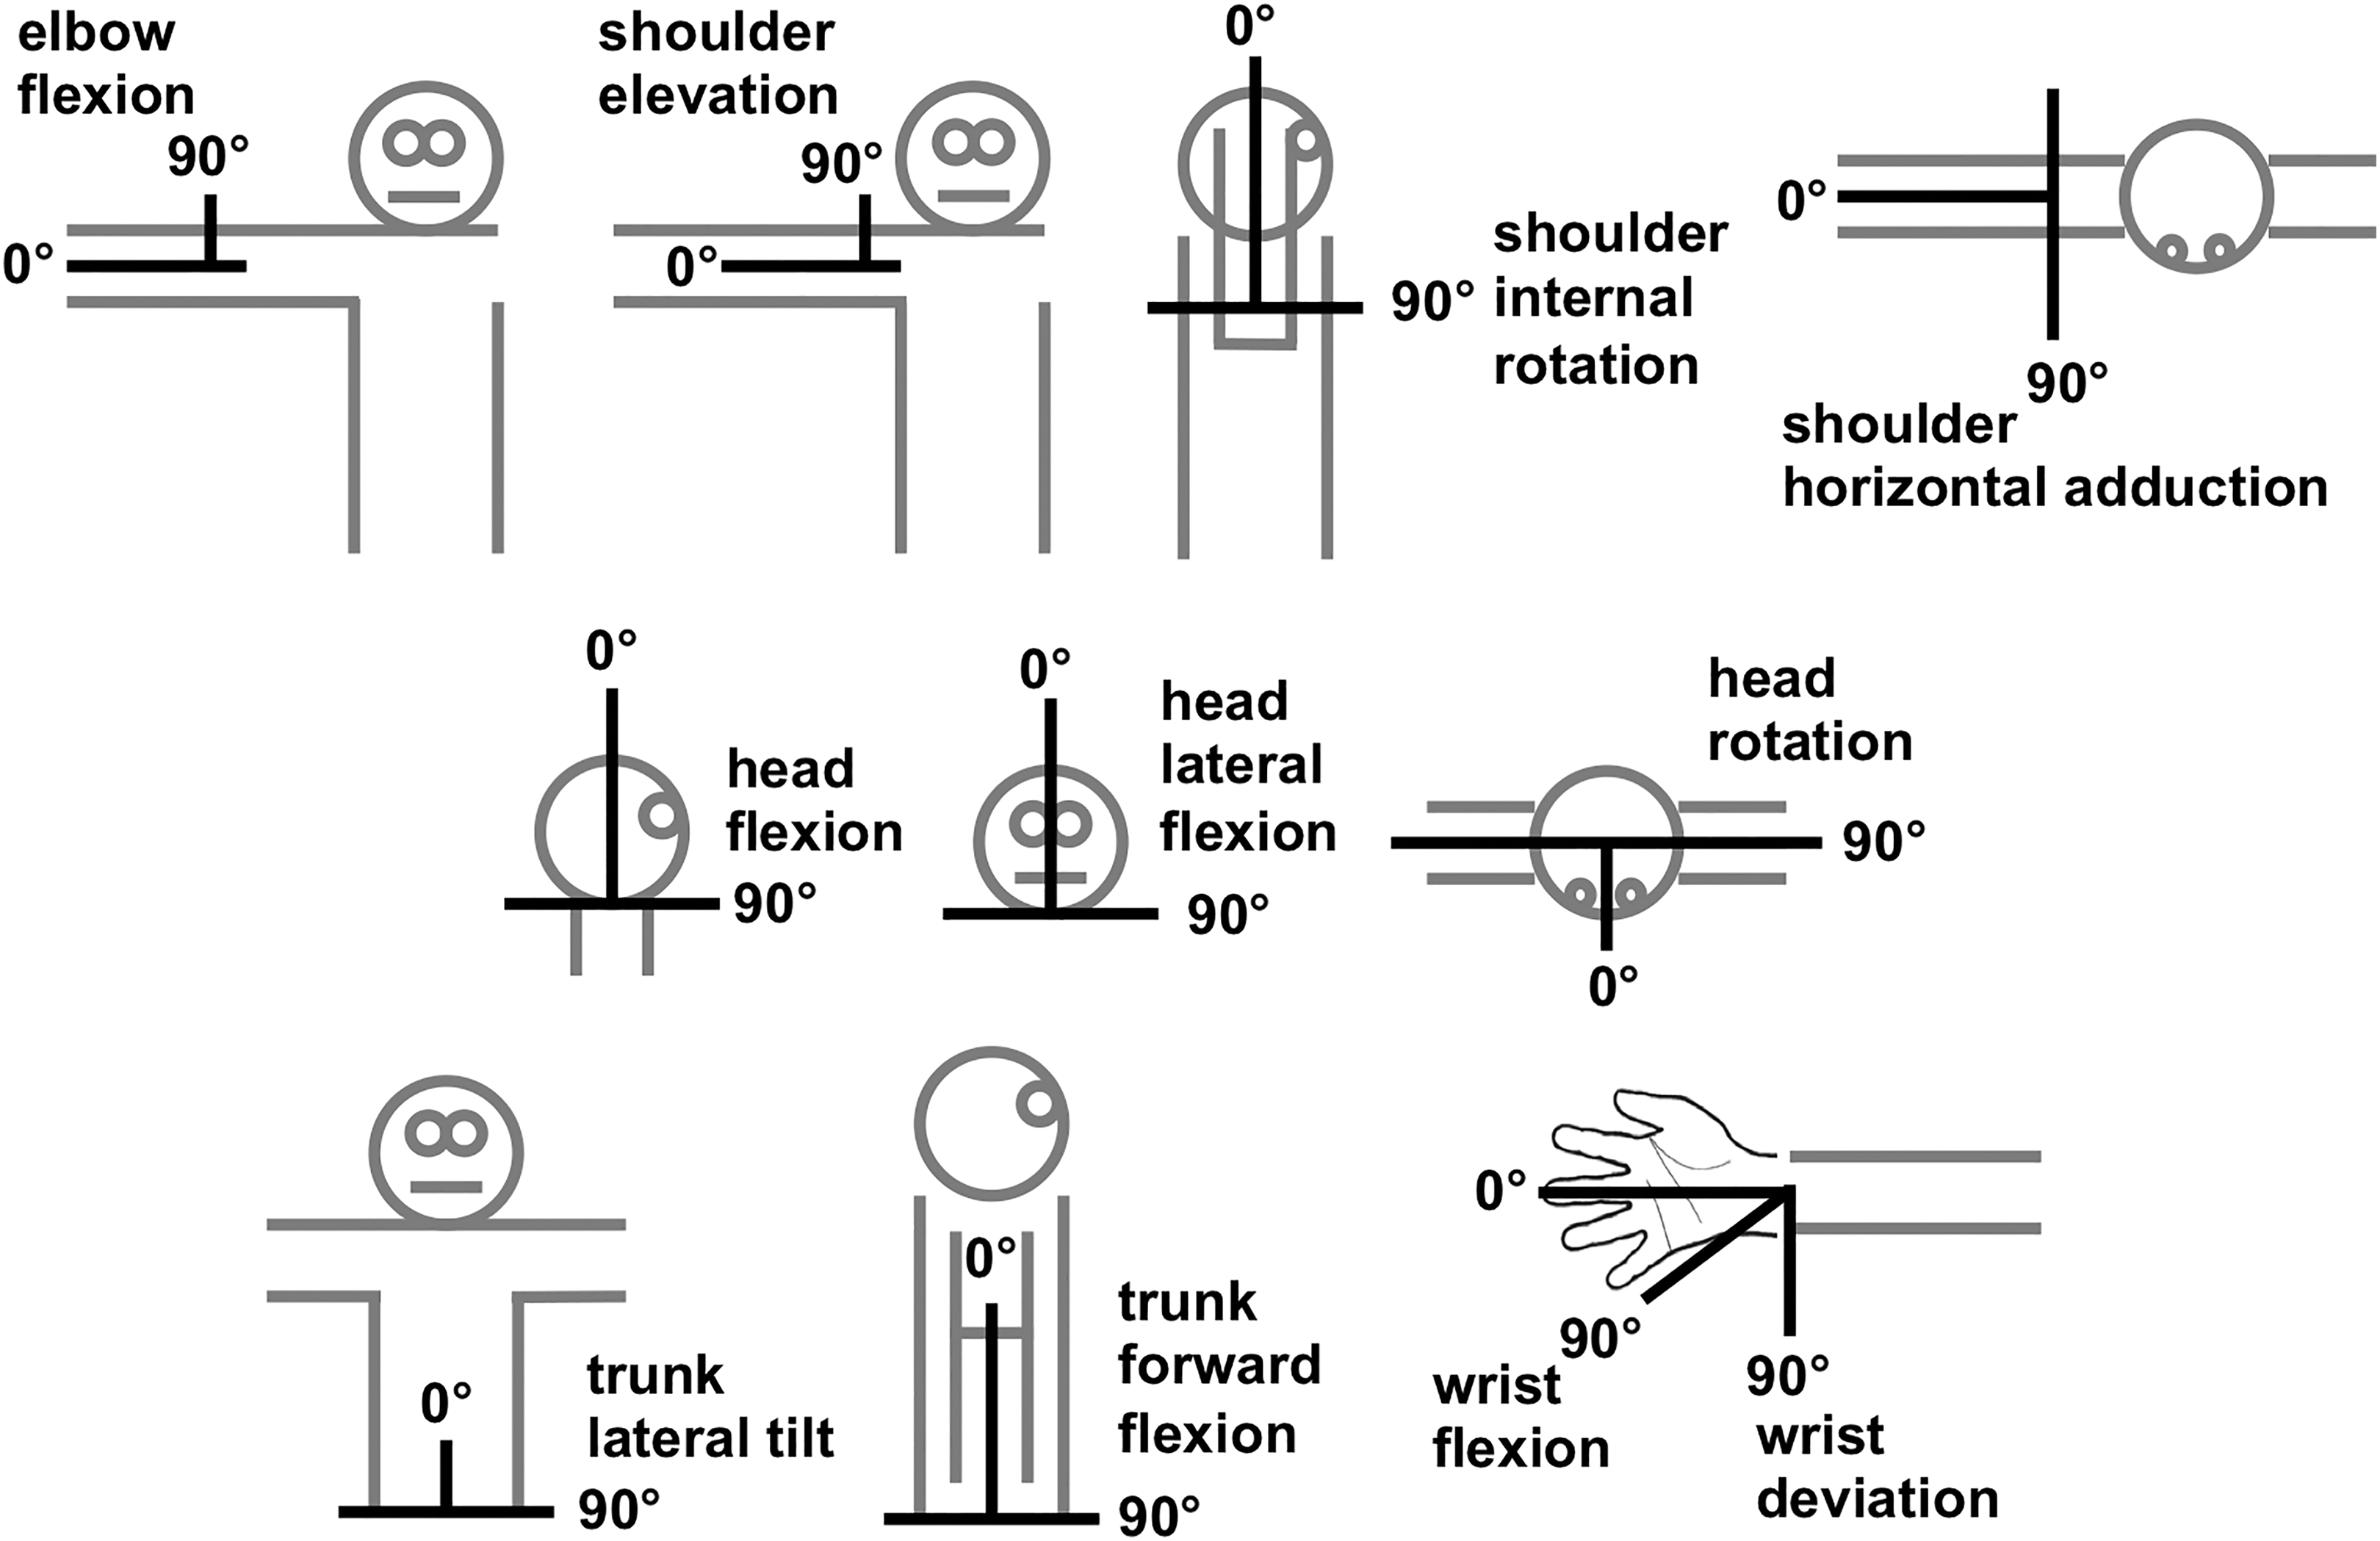
Schematic of UETrak software (Motion Analysis) angle definitions for a right-handed pitcher. For head lateral flexion, head rotation, and trunk lateral tilt, 90° is toward home plate. Not shown are (1) trunk rotation (similar axis to head rotation and measured relative to the pelvis), (2) pelvis rotation (similar axis to head rotation and measured relative to the global coordinate system), and (3) wrist pronation.
Analyzed kinetic parameters included maximum values between foot contact and ball release for shoulder abduction torque, horizontal abduction/adduction torque, internal rotation torque, and compression force; and elbow extension torque, varus/valgus torque, and compression force. Kinetic parameters were expressed as internal joint loads (eg, an external elbow valgus torque produces an internal varus torque generated by tissues including the UCL 5 ).
Repeated-measures multivariate analyses of variance (MANOVAs) were performed to determine significant differences in parameters between pitch periods at a significance level of .05. If the MANOVAs displayed significance, individual analyses of variance were performed on all grouped measurements (eg, all shoulder kinematic measurements) to determine which parameters were significantly different between pitch periods. Post hoc Tukey tests were performed to determine which parameters were significantly different between pitch periods.
Simple linear regression analyses were performed to determine significant correlations between joint torque/force (dependent variables) and BMI or pitch speed (independent variables). Bonferroni corrections were applied to the kinetic parameters in the regression analyses. Because there were 6 shoulder measurements (abduction torque, horizontal abduction/adduction torque, internal/external rotation torque, and compression force), a Bonferroni correction of 6 was applied when analyzing these parameters (P < .0083). There were 4 elbow measurements (extension torque, varus/valgus torque, and compression force), so a Bonferroni correction of 4 was applied when analyzing these parameters (P < .0125). We performed regression analyses at each of the 3 pitch periods independent of one another.
Analysis of Range of Motion and Muscular Output
Repeated-measures MANOVAs were performed to determine if pregame and postgame range of motion and muscular output parameters were significantly different. In all cases, the level of significance was .05.
Results
One participant (with the highest BMI) was not able to complete the simulated game because of reported soreness after pitch 43; that participant’s data were used only for torque/force versus BMI and pitch speed correlations for the first 2 pitch periods. Also, wrist kinematics for 1 participant were not calculated because of marker loss, and internal rotation range of motion for another participant was not measured.
Only 2 kinematic parameters (Table 1) changed during the simulated game. Shoulder MIRV increased between pitches 1-5 and 71-75 (P = .007). Head flexion at MIRV decreased between pitches 1-5 and 34-38 (P = .022) but was statistically similar at pitches 71-75 compared with earlier pitch periods.
Kinematic Parameters at FC, MER, and MIRV for Each Pitch Period a

a Data are shown as mean ± SD. n = 12 except for wrist (n = 11). FC, foot contact; MER, maximum external rotation; MIRV, maximum internal rotation velocity.
b Significant difference between pitch periods: P < .05.
Several shoulder kinetic parameters (Table 2) changed during the simulated game: horizontal adduction (P = .031), external rotation (P = .023), and internal rotation (P = .021) torques increased from pitches 34-38 to 71-75, and compression force (P = .0114) increased throughout the game. Elbow kinetic parameters (Table 2) did not change. No significant differences were observed between pregame and postgame measurements of range of motion and muscular output (Table 3).
Kinetic Parameters Between Foot Contact and Ball Release for Each Pitch Period a

a Data are shown as mean ± SD. n = 12.
b Significant difference between pitch periods: P < .0083 for shoulder measurements and P < .0125 for elbow measurements.
Pregame and Postgame Range of Motion and Muscular Output Parameters a
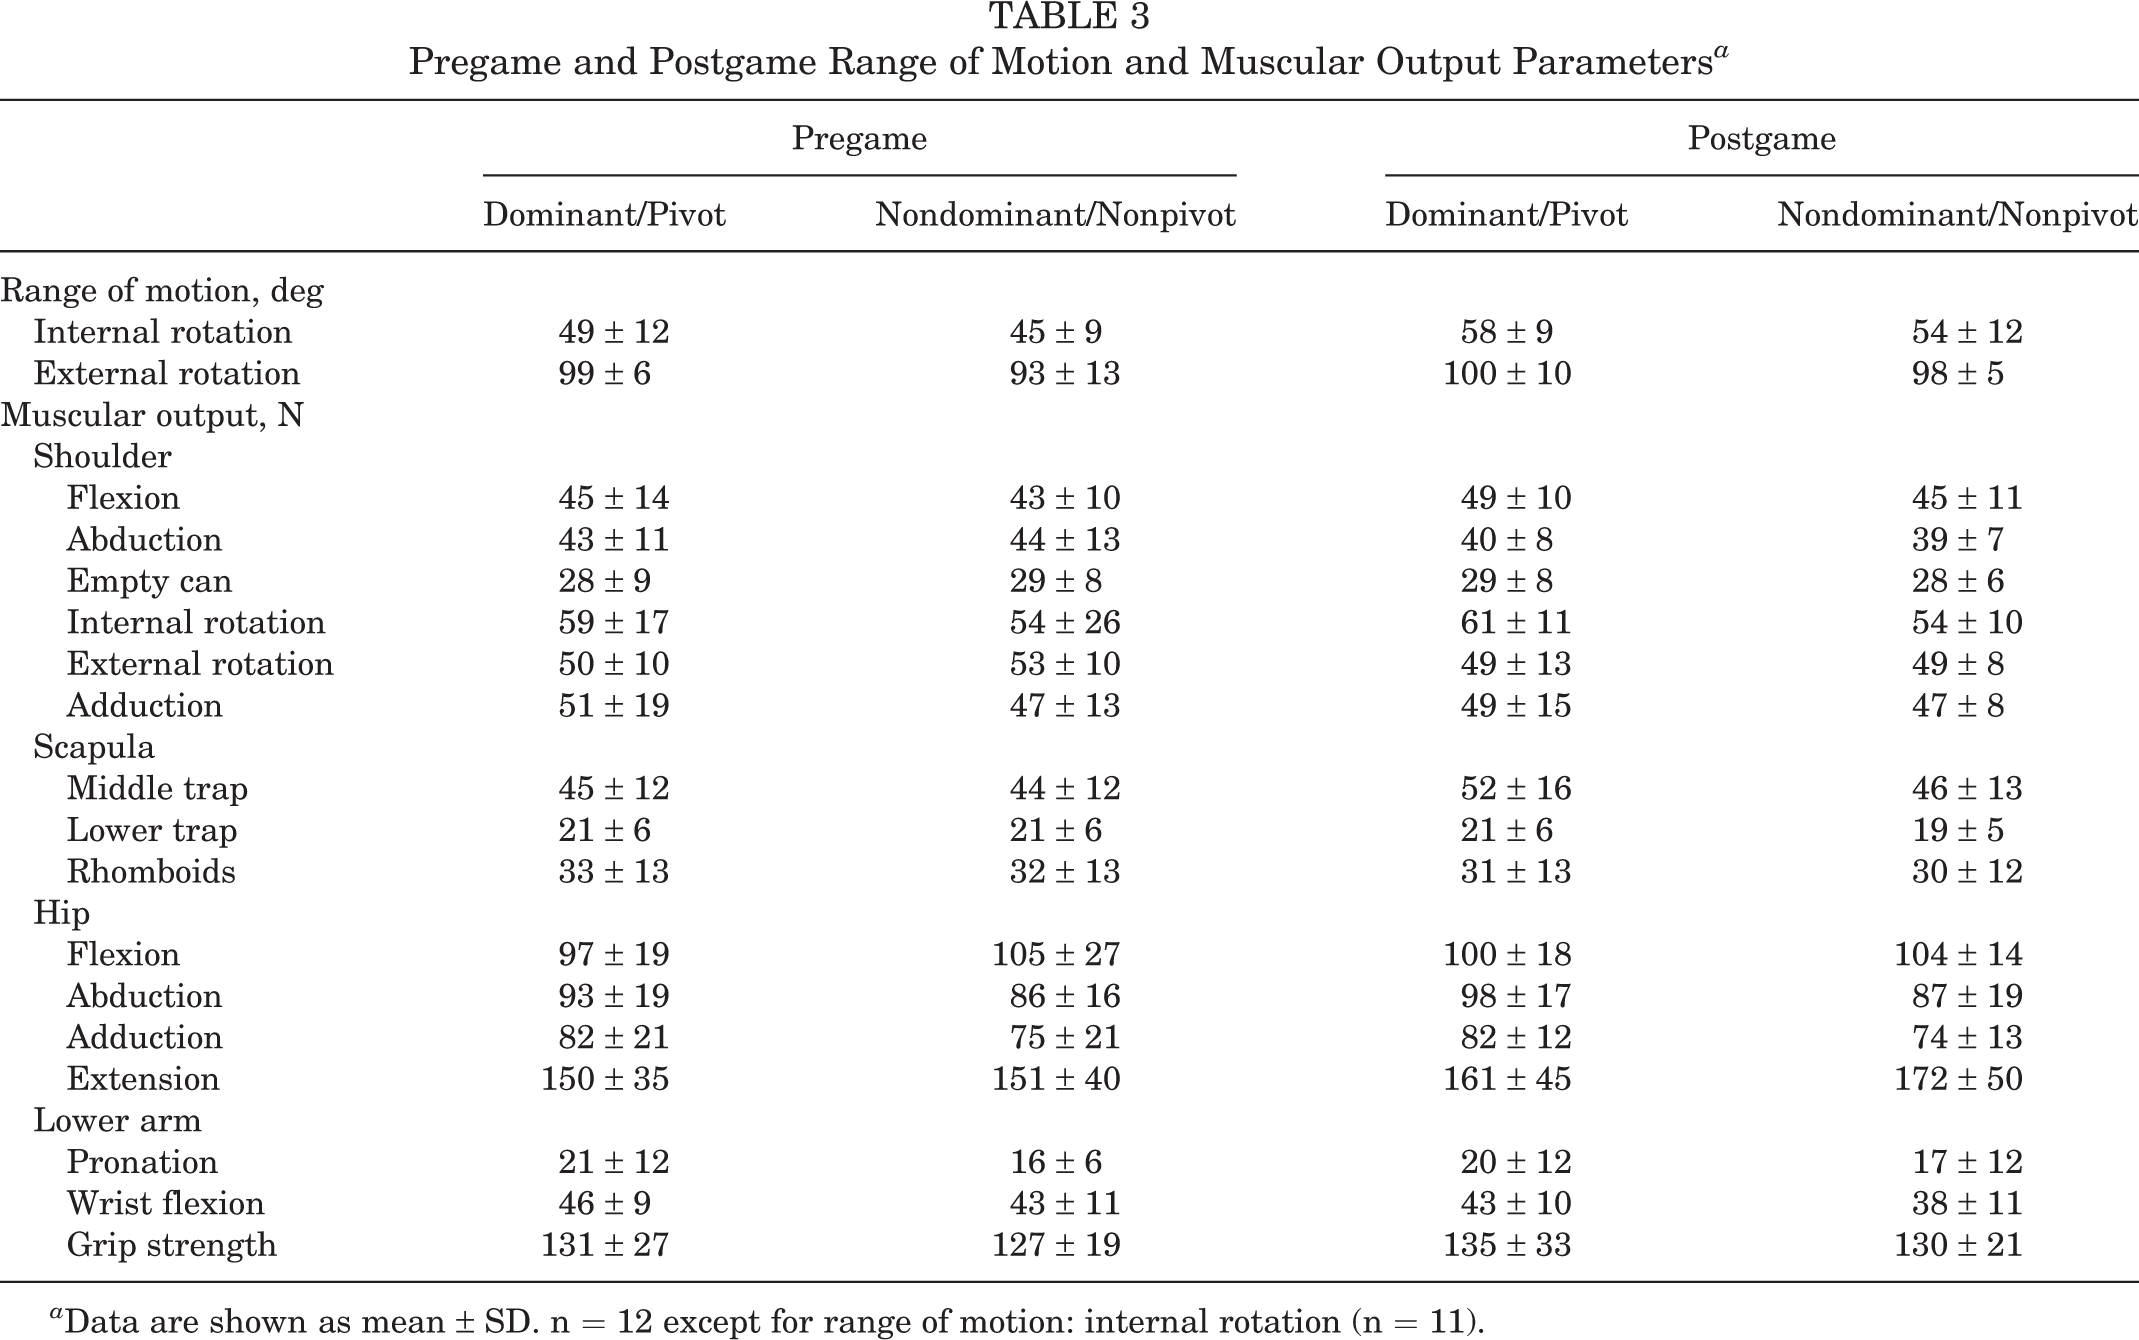
a Data are shown as mean ± SD. n = 12 except for range of motion: internal rotation (n = 11).
Simple linear regression analyses showed that joint torques and forces were correlated with BMI at each pitch period (Table 4). At pitches 1-5, shoulder abduction torque (P = .002), shoulder external rotation torque (P < .001), shoulder internal rotation torque (P < .001) (Figure 3), shoulder compression force (P = .001) (Figure 4), elbow extension torque (P < .001), elbow varus torque (P = .003) (Figure 3), elbow valgus torque (P = .008), and elbow compression force (P < .001) (Figure 4) all showed positive correlations with BMI. At pitches 34-38, shoulder abduction torque (P < .001), shoulder horizontal abduction torque (P = .001), shoulder external rotation torque (P < .001), shoulder internal rotation torque (P < .001), elbow extension torque (P < .001), and elbow compression force (P < .001) all showed positive correlations with BMI. At pitches 71-75, shoulder external rotation torque (P = .006), shoulder internal rotation torque (P = .008), and elbow extension torque (P = .018) all showed positive correlations with BMI. Only shoulder compression force for pitches 1-5 was correlated with pitch speed (P = .004) (Table 4).
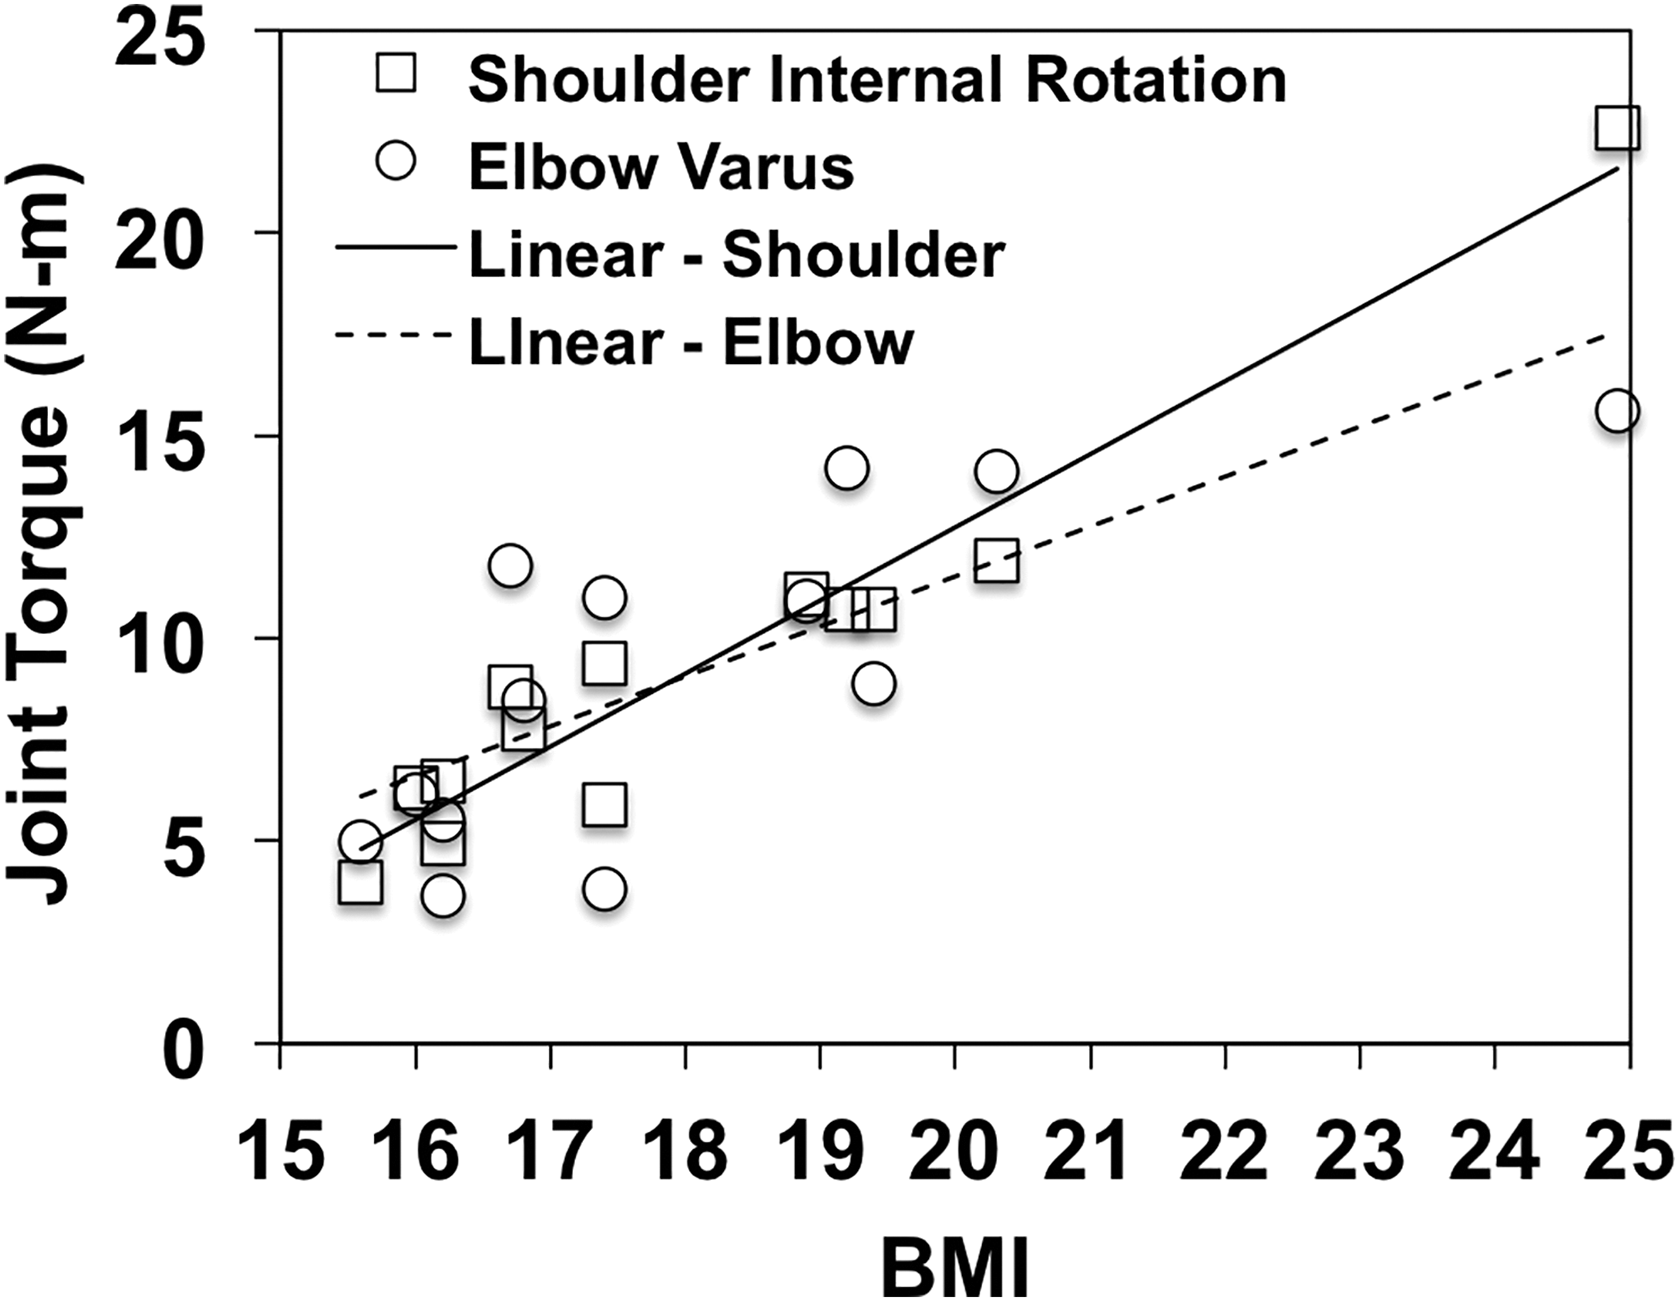
Simple regression correlations with body mass index for pitches 1-5: shoulder internal rotation (R 2 = 0.93, P < .001) and elbow varus (R 2 = 0.57, P = .003) torques.

Simple regression correlations with body mass index for pitches 1-5: shoulder (R 2 = 0.64, P = .001) and elbow (R 2 = 0.79, P < .001) compression forces.
Simple Linear Regression Results of Torque/Force by BMI and Pitch Speed for Each Pitch Period a

a Pitches 1-5 (n = 13), 34-38 (n = 13), and 71-75 (n = 12). BMI, body mass index.
b Significant correlation: P < .0083 for shoulder measurements and P < .0125 for elbow measurements.
Discussion
The results support the first hypothesis, as several biomechanical parameters (MIRV; shoulder horizontal adduction torque, external rotation torque, and internal rotation torque; shoulder compression force) changed throughout the simulated game. Although most kinematic parameters remained stable throughout the game, in general agreement with previous results for adult 10,30 and older youth 31 pitchers, several did change. In particular, MIRV increased by 10% from pitches 1-5 to 71-75, and head flexion decreased by 9% from pitches 1-5 to 34-38. The increasing MIRV reported here contrasts with previous results of adult pitchers 10,30 that MIRV did not change during a game. Although it is not clear why MIRV increased, it is noted that one of those previous studies 10 found a (nonsignificant) trend of increasing MIRV during a game.
The result that several shoulder kinetic parameters increased throughout the game contrasts with previous results of adult pitchers that shoulder kinetics decreased 30 or remained steady 10 during a game. In particular, in this study, horizontal adduction torque, external rotation torque, and internal rotation torque increased by 20%, 15%, and 17%, respectively, from pitches 34-38 to 71-75, and compression force increased by 18% from pitches 1-5 to 71-75. Although the absolute changes in shoulder kinetics were modest (eg, internal rotation torque increased by 1-2 N·m during the simulated game), they may be clinically relevant, as it has been reported that shear stresses resulting from calculated internal rotation torques in 12-year-old pitchers exceed estimates of epiphyseal cartilage strength. 36
The range of motion and muscular output test results did not reveal that selective fatigue occurred. The result that muscular output parameters did not change for the youth participants differs from a previous study with adult pitchers 29 in which select muscular output parameters decreased during a game. The lack of evidence for selective muscle fatigue in this study appears to be consistent with the results that MIRV increased and ball speed remained steady during the game.
The study results support the second hypothesis, as select joint torques and forces were strongly correlated with BMI at each pitch period. Although the results revealed a correlation between shoulder kinetics and pitch speed, overall correlations between kinetics and BMI were much stronger and occurred more often. Additional regression analyses were conducted to see if changes in joint torques between pitch periods were correlated with BMI; for example, whether the pitchers with a higher BMI experienced larger joint torque changes or vice versa. However, no such correlations existed.
Our results reveal several fundamental biomechanical differences when compared with previous results of older pitchers, suggesting that narrow age ranges should be chosen when defining experimental participant groups (eg, the 2-year range chosen here) to improve our understanding of how joint kinetics and the injury risk evolve as youth pitchers develop. One difference was the timing of maximum elbow varus 2,37,39,40 and shoulder internal rotation 1 torques, which have previously been reported to occur just before maximum external rotation. In contrast, in the current study, most participants (11/13) experienced maximum elbow varus torque and all participants experienced maximum internal rotation torque at or just after MIRV (ie, near ball release). Another difference, expected because of varying stages of skeletal development, was that torques and forces experienced by the 9- to 10-year-old participants in the current study were substantially lower than those experienced by MLB, college, or older adolescent players. The mean maximum elbow varus torque in the 9- to 10-year-old players in this study was 9 ± 4 N·m. In a previous study, 17 maximum elbow varus torques in 10- to 15-year-old, high school, college, and MLB pitchers were 28 ± 7, 48 ± 13, 55 ± 12, and 64 ± 15 N·m, respectively. Other studies reported maximum elbow varus torques for 12-year-old pitchers of 18 ± 4 37 and 13 ± 4 24 N·m. A similar pattern of increased joint kinetics with age was seen for the other forces and torques observed in the current study.
Our results have several implications for the injury risk in 9- to 10-year-old pitchers. High joint torques are believed to be linked to overuse injuries at the elbow and shoulder. 12,15,17 Specifically, higher elbow varus torque likely leads to increased UCL strain and an increased injury risk. 2,23 Also, higher shoulder internal rotation torque, horizontal abduction torque, compression force, and internal rotation velocity may lead to an increased risk for labrum and rotator cuff injuries. 16 –18 In the current study, 3 key results for 9- to 10-year-old pitchers differed from previous studies with adult pitchers: (1) pitch speed remained steady throughout the simulated game, (2) MIRV increased from pitches 1-5 to 71-75, and (3) shoulder kinetics increased throughout the simulated game. The increases in shoulder kinetics and MIRV with a steady pitch speed may be caused by the player using his arms more to compensate for the lack of power generation from the rest of the body, as it has been shown that there is high lower extremity muscle activity during pitching, 6 and lower extremity muscle fatigue may increase shoulder kinetics. 9 However, this explanation is not substantiated because the current study did not completely address lower extremity fatigue, which should be considered in future studies.
Furthermore, other studies with older pitchers 21,37 have identified correlations between pitching arm joint kinetics and body composition. Currently, 1 in 3 children in the United States is overweight or obese. 26 Shoulder and elbow kinetics were strongly correlated with BMI and varied substantially: for example, maximum shoulder internal rotation torques ranged from 4 to 23 N·m among the 9- to 10-year-old participants. A limitation of this study was that BMI was the only body composition measure studied for pitching arm kinetic correlations; because BMI does not distinguish between fat and lean masses, a high lean mass may result in overweight or obese diagnoses. 35 Further, previous studies have concluded that the calculation of BMI is an appropriate screening test for children but not a sufficient diagnostic test for excess body fat mass. 20 However, BMI has been shown to be a good predictor of excess body fat mass in children with a relatively high BMI. 19 Moreover, a previous study suggested that BMI may be an appropriate variable to consider, as 5 of 6 pitching arm joint torques were best correlated with total arm mass as opposed to lean and fat arm masses in 12- to 16-year-old pitchers. 21 Regardless, future studies should explore the concerns that the current study included a limited number of overweight/obese participants and only considered BMI as a measure of body composition.
Surprising findings of the current study were that the range of motion and muscular output test results were highly variable and that most output parameters did not change. Because this was the participants’ first time performing any of these tests, it is possible that they may have been more comfortable with the postgame measurement. Thus, a limitation of the current study is that the range of motion and muscular output tests may not have yielded sufficient accuracy for youth participants and did not include complete measurements of lower extremity muscle fatigue, which, as discussed above, may be related to the increasing pitching arm kinetics measured in this study. However, another explanation for these results, and the fact that they differ from previous results of adult pitchers, 29 is that the 9- to 10-year-old participants focused more on pitch accuracy than speed so that, instead of pitching at maximal effort, they experienced a dynamic warm-up exercise that has been suggested to increase power output in children. 11
These novel findings suggest a critical need for evidence that 75 game pitches is appropriate for all 9- to 10-year-old pitchers. Interestingly, older guidelines advocated by USA Baseball, 34 which included a game pitch limit of 50 for 9- to 10-year-old players, were more conservative than current Pitch Smart guidelines. Also, our findings reinforce the suggestion by previous studies that select body composition measures may be related to injury-correlated torques for baseball pitchers. Because BMI is a relatively quick and easy body composition measure to calculate, it should be further explored as a predictor of injury-correlated torques at all age levels, along with more accurate body composition measures such as arm mass and fat percentage. The findings of this and other follow-up studies may be considered in the development or revision of evidence-based injury prevention guidelines for youth baseball pitchers.
There are other limitations in the current study. First, the overall space of the laboratory was not large enough to have the youth participants pitch at their regulation distance of 46 ft. Second, the number of participants, and especially the number of overweight and obese participants, was limited. Further, the participant with the highest BMI did not complete the study; consequently, his data were only included for BMI regressions of the first 2 pitch periods. Third, different results may be obtained with a slightly different, but appropriate, protocol. In our local regular season preceding the study, one team of 9- to 10-year-old players averaged 30.4 pitches per inning; thus, using 15-pitch innings, as done previously with adult pitchers, 10 is not realistic. To simulate a game with 75 pitches, either the current protocol of two 37- to 38-pitch innings or an alternate protocol of three 25-pitch innings was considered. The current protocol was chosen in an effort to minimize the risk by eliminating an extra wait period and the 8 additional warm-up pitches before a third inning. However, a future study could explore other protocols, including adjusting the rest time between innings, as such times appear to be highly variable in youth play. Fourth, the accuracy of results may be improved with the use of ground force plates and the optimization of whole body kinematics and kinetics. 5 Fifth, the clinical significance of the modest but significant shoulder kinetic changes is not clear because of a lack of known injury thresholds for repetitive use. Sixth, the study excluded less skilled pitchers (ie, those who routinely pitch in the regular season but were not selected for all-star or club teams).
Conclusion
The current study is the first to investigate pitching biomechanics throughout a simulated game and to explore the correlation between pitching arm joint kinetics and BMI for a study group restricted to 9- to 10-year-old participants. Three novel findings for 9- to 10-year-old pitchers were that (1) select biomechanical parameters changed, including increases in several key kinetic parameters (shoulder horizontal adduction torque, external rotation torque, internal rotation torque, and compression force), during a simulated game; (2) selective muscular fatigue was not observed; and (3) there existed strong correlations between joint kinetic parameters and BMI.
Footnotes
One or more of the authors has declared the following potential conflict of interest or source of funding: This work was supported by an undergraduate education grant from the W.M. Keck Foundation and Donald E. Bently Center for Engineering Innovation.
Ethical approval for this study was obtained from the Cal Poly Human Subjects Committee.