
Abstract
Background:
Throwing injuries are common in high school baseball. Known risk factors include excessive pitch counts, year-round pitching, and pitching with arm pain and fatigue. Despite the evidence, the prevalence of pitching injuries among high school players has not decreased. One possibility to explain this pattern is that players accumulate unaccounted pitch volume during warm-up and bullpen activity, but this has not yet been examined.
Hypotheses:
Our primary hypothesis was that approximately 30% to 40% of pitches thrown off a mound by high school pitchers during a game-day outing are unaccounted for in current data but will be revealed when bullpen sessions and warm-up pitches are included. Our secondary hypothesis was that there is wide variability among players in the number of bullpen pitches thrown per outing.
Study Design:
Cross-sectional study; Level of evidence, 3.
Methods:
Researchers counted all pitches thrown off a mound during varsity high school baseball games played by 34 high schools in North Central Florida during the 2017 season.
Results:
We recorded 13,769 total pitches during 115 varsity high school baseball starting pitcher outings. The mean ± SD pitch numbers per game were calculated for bullpen activity (27.2 ± 9.4), warm-up (23.6 ±8.0), live games (68.9 ±19.7), and total pitches per game (119.7 ± 27.8). Thus, 42.4% of the pitches performed were not accounted for in the pitch count monitoring of these players. The number of bullpen pitches thrown varied widely among players, with 25% of participants in our data set throwing fewer than 22 pitches and 25% throwing more than 33 pitches per outing.
Conclusion:
In high school baseball players, pitch count monitoring does not account for the substantial volume of pitching that occurs during warm-up and bullpen activity during the playing season. These extra pitches should be closely monitored to help mitigate the risk of overuse injury.
Baseball pitchers commonly experience injuries to the dominant upper extremity, particularly the shoulder and elbow. Recent data have indicated that shoulder injury rate is 1.39 per 10,000 athlete-exposures (AEs) and the overall elbow injury rate is 0.86 per 10,000 AEs in high school baseball players. 46 The majority of shoulder (39.6%) and elbow (56.9%) injuries were sustained by pitchers (between 40% and 57%), and most injuries were chronic and caused by overuse. 46 Moreover, injuries to the ulnar collateral ligament of the elbow (UCL) associated with overhead throwing continue to increase. The number of UCL surgical reconstructions (Tommy John surgery) has increased throughout all levels of play for the past 20 years, most notably at the youth and high school levels, where a more than 6-fold increase occurred from 1994 through 2011. 2,11,17,44
Risk factors for overuse throwing injuries include lack of adherence to recommended pitch counts, year-round pitching, rotator cuff weakness, kinetic chain deficits, scapular dyskinesis, altered shoulder rotation, and pitching with arm pain and fatigue. 7,26,27,29,40,44 As a result, emphasis on pitching safeguards has increased, particularly at the youth and high school levels. Initially, Little League Baseball and the USA Baseball Medical Advisory Committee developed pitch count restriction recommendations based on age. 1 More recently, Major League Baseball (MLB), with expert recommendations from physical therapists, sports medicine practitioners, and athletic trainers, developed Pitch Smart, a website that provides information to players, coaches, parents, and health care practitioners on prevention of overuse injuries in young pitchers. 32 Among the website’s many features are game pitch count as well as rest day recommendations for 8- to 22-year-olds.
Recently, media coverage reporting cases of baseball pitchers throwing an inordinate number of pitches has increased. 42 During the Koshien Baseball Tournament, one of the most popular sporting events in Japan showcasing high school baseball teams, 42 of 201 (20.9%) pitchers threw more than 120 pitches per game. 52 There was also a report that one pitcher threw 187 pitches in a single outing. 52 This media coverage, coupled with efforts by sports medicine providers, coaches, and parents, prompted a shift of pitch volume recommendations at the high school level. In the United States, as recently as 2012, only 2 states had pitch count restrictions (South Dakota and Vermont), with the remainder of interscholastic state associations using inning restriction recommendations only. 19,45 As of the 2016-2017 academic year, the National Federation of State High School Associations began requiring a pitch restriction policy based on the number of pitches thrown in a game rather than the number of innings. 23 On August 30, 2016, the Florida High School Athletic Association approved a recommendation to follow the MLB Pitch Smart guidelines. 13,14 Furthermore, in 2017, the National Collegiate Athletic Association stated it would explore the issue of pitch counts at the collegiate level because of the concern over overuse throwing injuries. 24
The upper limit of pitch counts recommended for the oldest high school athletes (17- to 18-year-olds) by MLB Pitch Smart is 105 pitches per game. 32 However, the recommended guidelines for pitch count restrictions do not take into consideration the number of pitches thrown in the bullpen or during warm-up. Players may be considered in the “safe” zone of pitches thrown in a game based on the recommended guidelines when, in reality, the unaccounted workload and number of pitches accrued during bullpen and warm-up activities would push the overall pitching workload considerably higher. In addition, there is potential for variability in the volume of pitches thrown in a bullpen session prior to live-game competition, affecting the workload of a pitcher. Therefore, quantification of the pitches accumulated during warm-up, bullpen, and live-game activities would provide a more accurate assessment of the workload volume per pitcher outing and could have potential effects for off-season and in-season monitoring and training.
Our primary aim in this study was to quantify the total number of pitches accumulated during a typical high school varsity game experience, including bullpen, between-innings warm-up, and game pitches. Our secondary aim was to assess bullpen session volume variability. We hypothesized that approximately 30% to 40% of pitches thrown off a mound by high school pitchers during a game-day outing are unaccounted for in current data but will be revealed when bullpen sessions and warm-up pitches are included. We based this percentage on prior literature regarding the average number of game pitches thrown at the high school level (approximately 70) 29 in combination with a likely number of bullpen pitches (20-30) and warm-up pitches thrown. A typical number of pitches thrown per inning is approximately 15 to 20 based on MLB data. 12 We anticipated that the pitchers would pitch an average of 4 to 5 innings per start, which would amount to approximately 20 to 30 warm-up pitches (8 pitches before the first inning and 5 pitches before each subsequent inning). 34 Our secondary hypothesis was that the number of bullpen pitches thrown per outing would demonstrate wide variability among players. This is the first published study to measure total pitch volume (bullpen, between-inning warm-up, and game pitches).
Methods
Design
This was an observational, prospective study of pitch counts performed among high school baseball pitchers in the counties of North Central Florida. Because this study did not require collection of personal health information, the institutional review board (IRB) granted expedited review and did not require informed consent. The IRB approved all procedures involved in this study.
Selection of High School Locations
This study included 34 high schools. These schools were selected to represent a variety of different size classifications, demographics, and rankings. Schools included enrollment sizes ranging from less than 300 to more than 2200 students located in North Central Florida, the Panhandle of Florida, and Central Florida. The intent was to create a study sample representative of the general high school baseball population.
Data Collection
Researchers who collected the pitch counts received standardized directions on counting and documentation from the principal investigator (J.L.Z.). All researchers were unaffiliated with any high school team. Researchers attended varsity high school baseball games at the chosen schools from February to May 2017. Each starting pitcher’s total number of pitches thrown off a mound from the rubber was counted. As this was an observational study only, we did not collect data about injuries. Pitches from a mound were counted in 3 different situations: while in the bullpen (prior to game play), while warming up before each inning on the field, and during the game (live-game pitches). Only pitches while on a mound were counted. The reason for this was to count all pitches performed in a similar manner. Any throws that were made prior to warming up in the bullpen and long tossing in the outfield were not counted. Total innings pitched per outing were also collected to quantify number of pitches per inning.
Definitions
We used the following definitions for purposes of the study.
Bullpen pitches: Throwing off the pitching mound in the bullpen before the game
Warm-up pitches: Throwing off the pitching mound on the playing field before each inning pitched during the game
Live-game pitches: Throwing off the pitching mound during the game
Total game-day pitches: Bullpen, warm-up, and live-game pitches
Recommended Pitch Count Comparison
The upper limit of recommended pitch counts for the oldest high school athletes (17- to 18-year-olds) was used for comparison from the MLB Pitch Smart recommendations. Thus, we used 105 pitches as our upper limit cutoff for “safe volume.” 33
Statistics
Descriptive statistics were generated (ie, means and standard deviations; percentage of totals) for live-game pitches, bullpen pitches, warm-up pitches, and total number of pitches. We compared pitches in all subgroups by time of the season by breaking the season into thirds, given that a typical high school baseball season is approximately 12 weeks. An analysis of variance was run to compare differences in pitches thrown between pitch subgroups and time of the season. Pearson correlation was run to assess the association between total live-game pitches and bullpen pitches as well as between total game-day pitches and bullpen pitches. Data were analyzed by use of the Statistical Package for the Social Sciences (SPSS v 24; IBM Corp).
Results
We recorded 13,769 total pitches during 115 varsity high school baseball starting pitcher outings. Table 1 provides details of the volume of pitches and total innings pitched. All of the live-game pitches met the recommended pitch counts for 17- to 18-year-olds, as no pitcher exceeded 105 live-game pitches. Additional bullpen and warm-up pitches increased the total number of pitches for the average player to 119.7 per game. Figure 1 summarizes the distribution of pitch volume during live-game, bullpen, and warm-up activities. The average number of total pitches thrown during a pitcher outing was 42.4% greater than documented during the game alone. Moreover, 70.4% of the pitcher outings (81/115 outings) resulted in more than 105 game-day pitches thrown.
Volume of Pitches Thrown During an Average Varsity Baseball Game a

a A total of 115 pitcher outings were included in this data set.

Volume of pitches (by percentage).
Tables 2 and 3 provide pitch number comparisons to the recommended 105. The total number of pitches thrown in a game was significantly greater than recommended (P < .0001). When excluding bullpen pitches, we found that the total number of warm-up and live-game pitches thrown was significantly less than the recommended 105 per game (P < .0001) (Table 3). Our data also revealed variability between the number of bullpen pitches per outing (11-pitch range). Out of 115 game-day outings, 58 (50.4%) recorded bullpen pitch totals of either less than 22 pitches (30/115 outings; 26.0%) or more than 33 pitches (28/115 outings; 24.3%). Our data indicated that bullpen volume adds an additional 8.7 pitches, on average, per inning thrown. Although no significant correlation was found between warm-up and live-game pitches versus bullpen pitches (r = 0.002, P = .98), a positive and statistically significant relationship was found between total game-day pitches versus bullpen pitches (r = 0.34, P < .0001).
Number of Total Game-Day Pitches Greater Than the Recommended 105 a

a A total of 115 pitcher outings were included in this data set.
Number of Warm-up and Live-Game Pitches Less Than the Recommended 105 a
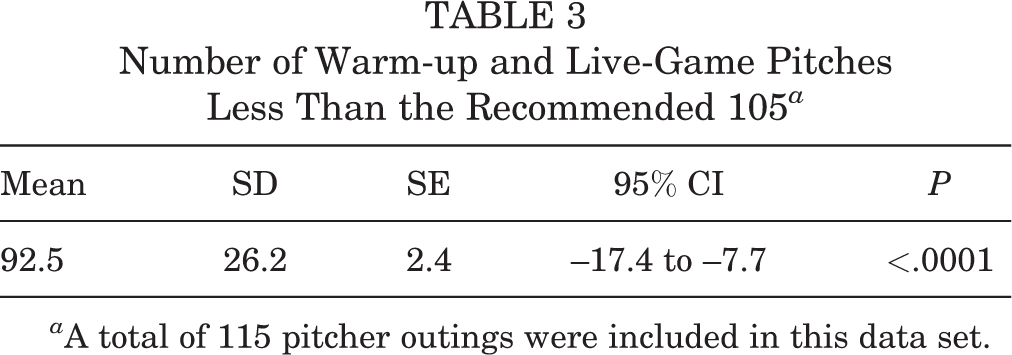
a A total of 115 pitcher outings were included in this data set.
With respect to seasonal patterns of pitch volume (Table 4), we did not find significant differences by time in season for game pitches per inning or total pitches per inning.
Comparison of Pitches by Thirds of the Season a

a There was no significant difference by time in season for game pitches per inning (P = .782) or for total pitches per inning (P = .570).
Discussion
We assessed the total throwing volume and the variability in bullpen throwing volume of starting pitchers during a typical varsity high school baseball game. Our data revealed that the average number of total pitches thrown during a pitcher outing was 42.4% greater than live-game pitches and 28.3% greater than bullpen and live-game pitches combined. Variability in bullpen throwing volume existed as well. These findings support our hypotheses.
Potential predictors of pitching injury, such as pitch counts and innings pitched, have been previously reported. 40,43 Comparative data on total pitch volume at the high school baseball level are very limited. Two documented studies have assessed pitch counts at the collegiate baseball level; however, they did not include the bullpen or warm-up pitches. 25,49 A study by Karakolis et al 21 assessed future injury risk in all pitchers under 25 years of age who pitched at least one-third of an inning at the MLB level over 6 seasons. The authors reported no correlation between innings pitched, inning restrictions, and future injury. Hence, inning limits alone cannot be used to protect young professional pitchers from injury. 21 A prior study by Karakolis et al 20 examined the association of cumulative workload metrics and injury in MLB pitchers. Metrics included games pitched, total innings pitched, total pitches thrown, innings pitched per game, and pitches thrown per game. No cumulative workload metric was a significant predictor for future injury. 20 However, interpretation of this finding could be limited due to lack of detailed documentation of bullpen and warm-up pitches. 3
In addition to wide variability in the number of bullpen pitches thrown, a positive and significant relationship was found between total game-day pitches (n = 13,769) and bullpen pitches (n = 3132) (P < .0001). Hence, more bullpen pitches thrown correlates with total number of game-day pitches thrown. Accounting for bullpen pitches in the game-day pitch count would provide a more accurate quantification of throwing volume.
Our study suggests there is a misunderstanding of the workload volume in the high school–aged baseball pitcher. Research has suggested that the occurrence of workload spikes (sudden increased volume relative to regular training volume) significantly increases risk for throwing-related injury. 18,31 For example, cricket bowlers who increase throwing workloads acutely during competition compared with their chronic workloads are at increased risk of injury. 10,18,31,41,47 One study reported that injured elite cricketers made only 12 more throws per day than noninjured athletes, although intensity and work of throws were not measured. 47 When the number of balls bowled in a session increased acutely, by more than 50% compared with the chronic workload, the likelihood of injury more than doubled. 18 In baseball, the variability in bullpen pitches as well as the unaccounted volume of bullpen and warm-up pitches means that pitchers may be incurring an additional 30% to 40% of an acute workload that could increase the likelihood of injury in a high school baseball pitcher. Our data set can guide future pitching recommendations by providing insight on previously unaccounted for throwing volume.
Significance of Study
Our data set reveals uncounted pitches that may contribute to overuse in high school varsity pitchers. Overuse can result in defects to the kinetic chain, 8,39 changes in hip strength and glenohumeral range of motion, 38 alteration in throwing mechanics, 16,39,43 rotator cuff weakness and fatigue, 15,29 forearm fatigue, 51 and alterations of scapula, arm position, and proprioception with resultant changes in arm and elbow position. 50 McHugh and colleagues 29 examined the effect of pitch volume on in-season and year-to-year range of motion and strength adaptations in high school baseball pitchers. Interestingly, supraspinatus strength decreased 13% in high-volume pitchers, where high volume was defined as more than 400 pitches per season. McHugh et al 29 reported an average of 71 pitches per game, very similar to our finding of 68.9 pitches per game. At the collegiate level, a study assessed throwing-related fatigue in the shoulder external and internal rotator muscle groups in baseball pitchers after a throwing protocol of 60 maximal-effort pitches arranged into 4 innings of 15 pitches per inning with 5 warm-up pitches per inning. Isokinetic testing revealed that throwing-related fatigue affected the shoulder external and internal rotators, which can have implications for rehabilitation and conditioning programs. 9 However, the volume of bullpen pitches was not taken into account, a difference of approximately 28% based on our data set.
These studies suggest that fatigue is a factor in the breakdown of the kinetic chain, which is a known risk factor for injury. 7 The concept of kinetic chain breakdown and fatigue in an overhead thrower is applicable to all overhead throwing athletes, not just baseball players. Nuño et al 36 assessed throwing accuracy and throwing velocity in elite handball players as fatigue increased. Their findings suggest that knowing when fatigue thresholds are reached can provide coaches and the health care team with the means to design appropriate off-season and in-season training regimens. 36
Limitations
This is an observational study, and we made no attempt to correlate total pitches with onset of injury. With respect to the bullpen and warm-up pitches, it is difficult to account for throwing effort, velocity, and intensity, which could affect rate of muscular fatigue and stress on the shoulder and elbow. These factors, in addition to workload, should be included in overuse injury assessment. 30 One might assume that warm-ups are likely pitched at a submaximal level, with less stress on the pitching arm; although prior studies have shown that velocity is a major component of increased pitching injury, 6 other data have suggested that overuse and fatigue were the factors that had the greatest associations with chronic pitching injury. 40 Coaches and athletes must be mindful that chronic throwing injuries are not necessarily the result of submaximal throws in one game. Rather, it is the cumulative, voluminous build-up over time (eg, in a week, season, year, and career) that can lead to an overuse injury. Grantham and colleagues 16 recommended that “limiting fatigue-related injury risk may assist injury prevention in addition to standardized limitations of innings and pitches thrown.” However, the exact number of pitches thrown on a game-day is required to determine when fatigue levels are reached in order to prevent chronic injury in baseball pitchers. 39
We also did not assess whether different types of pitches contributed to fatigue. However, previous research at the youth level has indicated that pitching mechanics and muscle activation did not change with various types of pitches thrown. 37
Our data did not account for non-game-day throwing or warming up by playing catch before pitching off a mound, which may add significant exposure load and potentially affect injury risk. Finally, although bullpen volume varies significantly, it would not be appropriate to regulate how a pitcher warms up, as each pitcher has developed his or her own warm-up routine to feel comfortable before entering live-game competition. However, bullpen volume may be modifiable through education of players and coaches regarding safer types of warm-up sessions to prepare for game competition.
Conclusion
Our data revealed an unaccounted workload factor of bullpen and warm-up pitches not included in the total pitch count. We also found wide variation in the number of bullpen pitches thrown, making precise determination of pitch volume challenging among high school players. Recommendations to limit live-game baseball pitch counts at the high school level have recently been enacted to reduce overuse throwing injuries, as described in Table 5. 23 This study reinforces the importance of developing consistent systems to monitor workloads. 48
Clinical Recommendations a

a SORT, Strength of Recommendation Taxonomy. A, consistent, good-quality patient-oriented evidence; B, inconsistent or limited-quality patient-oriented evidence; C, consensus, disease-oriented evidence, usual practice, expert opinion, case series.
Footnotes
The authors declared that they have no conflicts of interest in the authorship and publication of this contribution.
Ethical approval for this study was obtained from the University of Florida Health Science Center Institutional Review Board (IRB No. 201601964).
Acknowledgment
The authors acknowledge the assistance and outstanding data collection support by Keegan Hones, Mariana Franz, Lauren Mills, Kimberly Novack, Erin Sperling, and Jonah Stein for this study.