
Abstract
Background:
Prior research has described the anthropometric and physical performance characteristics of professional, collegiate, and high school American football players. Yet, little research has described these factors in American youth football and their potential relationship with injury.
Purpose:
To characterize anthropometric and physical performance measures, describe the epidemiology of injury, and examine the association of physical performance measures with injury among children participating within age-based divisions of a large metropolitan American youth football league.
Study Design:
Case-control study; Level of evidence, 3.
Methods:
Demographic, anthropometric, and physical performance characteristics and injuries of 819 male children were collected over a 2-year period (2011-2012). Injury data were collected by the league athletic trainer (AT) and coaches. Descriptive analysis of demographic, anthropometric, and physical performance measures (40-yard sprint, pro-agility, push-ups, and vertical jump) were conducted. Incidence rates were computed for all reported injuries; rates were calculated as the number of injuries per 1000 athlete-exposures (AEs). Multinomial logistic regression was used to identify whether the categories of no injury, no-time-loss (NTL) injury, and time-loss (TL) injury were associated with physical performance measures.
Results:
Of the 819 original participants, 760 (92.8%) completed preseason anthropometric measures (mean ± SD: age, 11.8 ± 1.2 years; height, 157.4 ± 10.7 cm; weight, 48.7 ± 13.3 kg; experience, 2.0 ± 1.8 years); 640 (78.1%) players completed physical performance measures. The mean (±SD) 40-yard sprint and pro-agility measures of the players were 6.5 ± 0.6 and 5.7 ± 0.5 seconds, respectively; the number of push-ups and maximal vertical jump height were 16.5 ± 9.3 repetitions and 42.3 ± 8.4 cm, respectively. Players assigned to different teams within age divisions demonstrated no differences in anthropometric measures; 40-yard dash and pro-agility times differed significantly (P < .05) between players assigned to different teams. A total of 261 NTL and TL injuries were reported during 35,957 AEs (games: 22%, n = 7982 AEs; practices: 78%, n = 27,975 AEs). The overall incidence rate was 7.26 per 1000 AEs (95% CI, 6.37-8.14). Physical performance measures did not predict NTL or TL injuries (P > .05).
Conclusion:
No practically meaningful differences existed in anthropometric or physical performance measures between teams within age-based levels of play. Findings suggest that age-only criterion for player groupings can evenly match in terms of physical performance.
American youth football is a highly popular sport, with approximately 3 million children participating in the United States annually. 26 Nearly 190,000 football-related injuries report annually to emergency departments (EDs) throughout the United States. 5,9 Participation in youth football has decreased nationwide accompanied by reports of parents and children avoiding youth football due to fear of injury. 31,37 To help ensure player safety, organizations such as USA football—the national governing body for youth football—have devised programs such as the Player Progression Development Model, which strive to provide guidelines that ensure age-appropriate training for players. 36
Considerable changes in body size, composition, and physical performance capacities among pubescent males are well documented. 20 The onset, tempo, and duration of these changes are highly variable, with biological age varying as much as 3 years among individuals of the same chronological age. 16 In collision sports such as American youth football, more mature players may have a competitive advantage in terms of increased body size (height and muscle mass) and physical performance (speed, agility, power, endurance) over later-maturing peers of the same age. 22 These factors create a complex challenge for youth sports national governing bodies striving to devise playing standards that appropriately group children within leagues to ensure fair competition and optimize safety. For example, many youth football leagues group children based on an age-weight classification matrix. Others have adopted an age-only playing standard, recommended by USA Football, grouping children based on age or grade in school. 36
Research suggests that youth football players are taller, heavier, and mature faster compared with normative values for American boys. 21,22,24 Furthermore, these characteristics have been suggested as potential risk factors for injury. For example, injury patterns have been shown to differ by body mass index (BMI) in high school football players. 39 An investigation of children participating in youth football reported that age, height, BMI, and maturity status were not related to the risk of injury, suggesting that other factors, such as physical performance characteristics, may influence player safety. 23
Recent studies have investigated the incidence of injury of youth athletes participating in American football. 9,18,23,32 Collectively, these studies report that most injuries are relatively minor, involving no time lost from participation, and that games account for the majority of injuries compared with practices. A recent study by Dompier et al 8 extended these findings, demonstrating youth football to have a significantly lower incidence of game-related orthopaedic injuries compared with those reported in high school or college. However, these studies did not describe youth football players’ physical performance characteristics or examine whether these factors are associated with injury.
Anthropometric and physical performance characteristics of professional, 30 collegiate, 17 and high school American football players have been studied. 10,14 These characteristics have also been described among various age groups of youth soccer, 12,38 basketball, 34 and rugby athletes. 19,33 Yet little research has described the physical performance and anthropometric characteristics of youth American football players. Considering the rapid changes in body size and composition among pubescent males, research is needed to describe the physical performance characteristics of players within various age levels of youth football. Furthermore, limited research has examined the relationship between physical performance measures and injury among youth athletes participating in an American youth football league. Such information might aid in determining whether age-based grouping strategies in American youth football aptly groups players with similar body size and physical performance attributes. Identifying mismatches in player body size and physical performance attributes may aid youth leagues in configuring league groupings to facilitate equitable competition and better manage injury risk. 1,9 Therefore, the aims of this study were to (1) characterize the anthropometric and physical performance measures, (2) describe the epidemiology of injury, and (3) examine the association of physical performance measures with injury among children participating within age-based divisions of a large metropolitan American youth football league.
Methods
We prospectively gathered anthropometrics, physical performance measures, and injury data from a cohort of American youth football athletes participating in a large metropolitan youth football league over a 2-year period (2011-2012). In total, 819 male children participated in the league during the 2011 (n = 421) and 2012 (n = 398) football seasons. Institutional review board approval was granted.
League Play
The league consisted of 3 divisions (Select [S], A, and B). Divisions were determined based on age (academic grade level) and each had a maximum limit on ball-carrier weight. Divisions S (n = 109) and A (n = 294) consisted of participants in the 7th and 8th grade, and division B (n = 416) consisted of participants in the 5th and 6th grade. Although the S and A divisions were identical in terms of age and participant grade level, division S comprised athletes deemed by a selection committee of league administrators and coaches to be the most skilled football players. Division S comprised 3 teams in 2011 and 2 teams in 2012. Division A comprised 8 teams, and division B had 12 teams for both seasons. Each team consisted of 16 to 20 players. The regulation season was 9 weeks and consisted of 18 practices (2/week) and 8 games (1/week), with 1 bye week (no game) assigned at random.
Preseason Testing
Preseason testing was voluntary and not required for participation during the regular season. Anthropometric measurements were collected prior to physical performance testing. Physical performance testing was conducted during a single session using a station-based simultaneous start design. Participants were randomly assigned to an initial physical performance testing station. All physical performance tests were performed on a grass playing field at 1 location. Testing protocols follow.
Anthropometric Measurements
Height (cm) and weight (kg) were collected with the participants fully clothed and shoes off using a stadiometer (Seca 216 Stadiometer; Scale Co Inc) 7 and a digital scale (Precision Digital Bathroom Scale; HealthTools LLC), respectively. Of the 819 league participants, 92.8% (n = 760) completed preseason anthropometric testing during the 2011 and 2012 seasons. However, height (n = 371) was only recorded for the 2012 season. Therefore, BMI (kg/m2) is only reported for 2012. 22
Physical Performance Testing
In total, 78.1% (n = 640) of league participants completed preseason testing during the 2011 and 2012 seasons. All physical performance testing was conducted as previously described. 10,13,25,27 Players participated in 4 physical performance assessments designed to measure speed, agility, upper body muscular endurance, and lower body muscular power. Speed and agility were assessed by players’ times (seconds) to complete a 40-yard sprint and pro-agility test, respectively. The pro-agility test required the players begin at a center cone and sprint 5 yards left to a cone. The player then changed directions and sprinted 10 yards right to a cone. Finally, the player changed directions again and sprinted 5 yards left and through the center cone. 10 Upper body muscular endurance and lower body muscular power were assessed by the number of push-ups completed (count) and maximal vertical jump height (cm), respectively. Eight (1.25%) of 640 participants were unable to complete the push-up test because of time constraints on the testing day.
Epidemiology of Injuries
Injury data were prospectively gathered over a consecutive 2-year period (2011-2012) by the league athletic trainer (AT). The AT used an electronic medical record-keeping system, Sports Injury Management Systems software (SIMS), to maintain a daily record of injuries. An athlete-exposure (AE) was defined as 1 athlete participating in 1 league-organized practice or game in which they were exposed to the possibility of injury. The number of practice exposures was the sum of the number of athletes participating in practices during the season as documented by each team’s coaching staff. The number of game exposures was the sum of the number of athletes at each game during the season as documented by the league AT. A reportable injury was required to meet the following conditions: (1) occurred as a result of participation in an organized youth football league game or practice, (2) required medical attention of the coach or AT, and (3) resulted in restriction of a player’s participation. Injuries were categorized by the number of days of participation restriction. No-time-loss (NTL) injuries resulted in a participation restriction on the same day of injury complaint but no subsequent restriction. Time-loss (TL) injuries resulted in participation restriction of at least 1 day subsequent to the date of injury complaint. TL injuries were then further subcategorized as follows: minor (<8 days lost), moderate (8-21 days lost), and severe (>21 days lost). 9 The league AT provided onsite care for all games but was not present for all practices. League policy mandated that coaches reported practice attendance and all suspected injuries, regardless of perceived severity, sustained during practice to the league AT within 24 hours after practice. All coach-reported incidents initiated an immediate electronic notification to the league AT for further follow-up. The AT confirmed the nature of the injury and outcome. All incidents not meeting the criteria for a reportable injury were removed from the analysis.
Statistical Analysis
For aim 1, descriptive analyses were conducted on demographic and anthropometric variables including age, height, weight, and BMI and the physical performance measures (40-yard sprint, pro-agility, push-ups, and vertical jump). In addition, nonparametric Kruskal-Wallis tests were used to examine whether these variables were equally distributed among teams within age divisions.
Descriptive injury data (aim 2) were collected, and incidence rates were computed for all reported injuries by anatomic region, league division, and session type (practice or game). Rates were calculated as the number of injuries per 1000 AEs. Confidence limits (95% CIs) were constructed for all incidence rates. 2
Finally, for aim 3, multinomial logistic regression was used to examine the association of physical performance measures (40-yard sprint, pro-agility, push-ups, and vertical jump) with 3 injury categories (no injury, NTL, TL). 14 All data analyses were conducted using R software (version 3.0.1). 29
Results
Anthropometric and Physical Performance Characteristics
A total of 819 athletes participated in the 2011 and 2012 football seasons. Approximately 51% (n = 416) of the league was in the B division, 36% (n = 294) in the A division, and 13% (n = 109) in the S division. The mean (±SD) age and playing experience of players in the league for both seasons was 11.8 ± 1.2 and 2.0 ± 1.8 years, respectively, and the mean BMI of players in the 2012 season was 24.5 ± 6.7 kg/m2. Anthropometric testing was completed on 92.8% (n = 760) of athletes prior to the 2011 and 2012 seasons. Players’ anthropometric measures were equally distributed among teams within each division. A summary of demographic and anthropometric measurements is presented in Table 1.
Preseason Demographic and Anthropometric Characteristics a

aP values were computed using the Kruskal-Wallis test for comparing teams within a division. BMI, body mass index; n, number of students with nonmissing data.
b Divisions A and S consisted of 7th and 8th graders; division B consisted of 5th and 6th graders.
c Age and height were unavailable for 2011, and consequently BMI was not calculated for that season.
Table 2 summarizes the results of physical performance testing for the 640 (78.1%) youth football players that participated in preseason testing during the 2011 and 2012 seasons. Speed and agility results revealed players’ mean 40-yard sprint and pro-agility times to be 6.5 ± 0.6 and 5.7 ± 0.5 seconds, respectively. Upper body muscular endurance and lower body muscular power results demonstrated players’ mean number of push-ups completed to be 16.5 ± 9.3 and maximal vertical jump height to be 42.3 ± 8.4 cm, respectively. Findings also revealed a significant difference between division B teams’ physical performance measures, specifically 40-yard dash and pro-agility (P < .05). Table 3 depicts the post hoc multiple pairwise comparisons of teams’ physical performance measures within division B. When combining divisions A and S (7th and 8th graders) and comparing with division B (5th and 6th graders), as expected, the players in higher grade levels were taller, heavier, and performed significantly better (P < .05) on all physical performance measures with the exception of upper body muscular endurance.
Descriptive Statistics of Preseason Physical Performance Measures a

aP values were computed using the Kruskal-Wallis test for comparing teams within a division. n, number of students with nonmissing data.
b Divisions A and S consisted of 7th and 8th graders; division B consisted of 5th and 6th graders.
c The select division did not participate in physical performance testing in 2011.
d Statistically significant difference (P < .05).
Preseason Physical Performance Measures for Division B by Team a
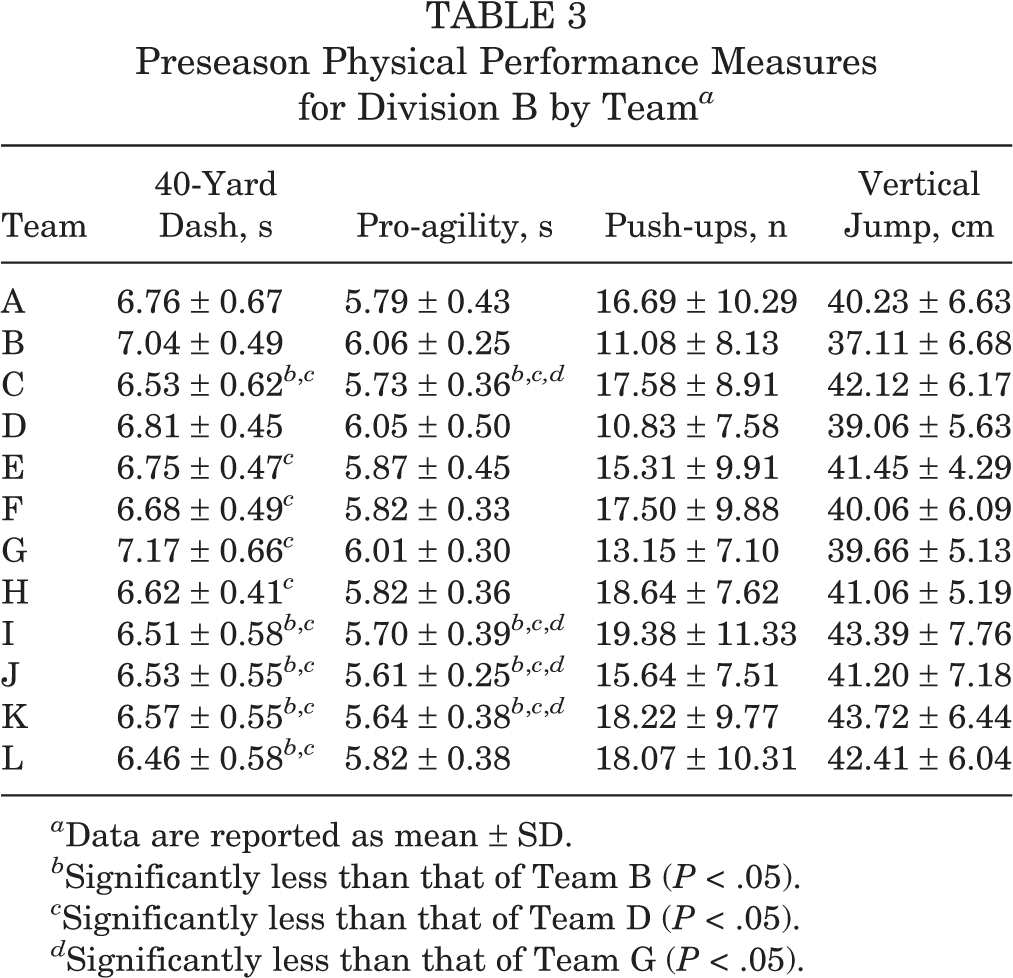
a Data are reported as mean ± SD.
b Significantly less than that of Team B (P < .05).
c Significantly less than that of Team D (P < .05).
d Significantly less than that of Team G (P < .05).
Epidemiology of Injuries
Throughout the 2011-2012 seasons, the league AT reported 261 NTL and TL youth football injuries during 35,957 AEs (games: 22%, n = 7982 AEs; practices: 78%, n = 27,975). A summary of NTL and TL injury incidence rates by body location for games, practices, and division level are reported in Table 4. Most injuries reported (70.1%, n = 183) were minor and classified as NTL as compared with 29.9% (n = 78) classified as TL. The overall incidence rate was 7.26 injuries per 1000 AEs (95% CI, 6.37-8.14). However, when only examining TL injuries, the incidence rate was 2.17 per 1000 AEs (95% CI, 1.69-2.65). Among these, 13 (4.9% of all injuries) were severe (Figure 1). Severe injuries included fractures (15.4%, n = 2), sprains (15.4%, n = 2), strains (7.7%, n = 1), hyphema of the eye (7.7%, n = 1), and concussions (53.8%, n = 7). Overall, injury rates were considerably higher in games than practices (29.94 vs 0.31/1000 AEs; rate ratio [RR] = 38.07; 95% CI, 24.60-58.92). When restricting to TL injuries, rates were noticeably reduced but remained higher for games compared with practices (8.94 vs 0.70/1000 AEs; RR = 27.45; 95% CI, 14.51-51.94). Only 2 (15.4%) severe TL injuries were reported during practices (hyphema and fracture). Table 5 summarizes game-related TL injury rates. Among league levels, division B accounted for most TL injuries (games: 50.6%, n = 34; practices: 63.6%, n = 7). Injuries were nearly evenly divided between the upper (games: 36.8%, n = 88; practices: 27.3%, n = 6) and lower (games: 31.4%, n = 75; practices: 31.8%, n = 7) body. The head, face, and neck represented a large proportion of game (28.5%, n = 68) and practice (40.9%, n = 9) injuries. Of these, the majority were diagnosed as concussions (64.9%, n = 50), with most (90%, n = 45 vs 10%, n = 5) occurring during games. Across league divisions, the self-reported concussion mechanism was nearly equally divided between helmet-to-helmet (55%, n = 27) and helmet-to-ground (46%, n = 23). All diagnosed concussions resulted in time loss. Concussed players missed a mean 15.0 ± 10.8 days of participation. Among musculoskeletal injuries, the knee (games: 14.2%, n = 34 vs practices: 22.7%, n = 5) and the wrist/hand (game: 13.4%, n = 32 vs practice: 13.6%, n = 3) accounted for similar proportions of game and practice injuries. Across league divisions, tackling was the most frequent mechanism of knee (66.7%, n = 26) and wrist/hand (80%, n = 28) injuries. Few knee (10.3%, n = 4) or wrist/hand (11.4%, n = 4) injuries resulted in time loss. However, players diagnosed with a knee or wrist/hand TL injury missed a mean 17.5 ± 17.4 and 5.3 ± 4.0 days of participation, respectively.
Incidence Rates for all NTL and TL Injuries Within an American Youth Football League, 2011-2012 a

a Incidence rate reported as number of injuries per 1000 athlete-exposures (95% CI). Divisions A and S consisted of 7th and 8th graders; division B consisted of 5th and 6th graders. AE, athlete-exposure; NTL, no time loss; TL, time loss.

Cumulative percentage of injury by severity. Time-loss injury severity categories were defined as follows: minor (<8 days lost), moderate (8-21 days lost), and severe (>21 days lost).
Incidence Rates for All Game-Related TL Injuries Within an American Youth Football League, 2011-2012 a

a Incidence rate reported as number of injuries per 1000 athlete-exposures (95% CI). Body regions with no game-related TL injuries across all 3 divisions are absent from the table. Divisions A and S consisted of 7th and 8th graders; division B consisted of 5th and 6th graders. AE, athlete-exposure; TL, time loss.
Physical Performance Measures and Injury
Multinomial logistic regression was used to examine differences in predictors between noninjured participants, participants with NTL injuries, and participants with TL injuries. Physical performance measures (40-yard sprint, vertical jump, push-ups, and pro-agility) displayed no evidence of predicting (P > .05) a heightened risk for TL injuries relative to noninjured participants or participants suffering NTL injuries relative to noninjured participants.
Discussion
To our knowledge, this is the first study to characterize anthropometric and physical performance measures, describe the incidence of injury, and examine the association of physical performance measures with injury among youth football players. The primary findings of this paper demonstrate that youth football players display a process of physical maturation and performance as they progress through age levels of a youth league. Additionally, no clinically meaningful differences existed in the anthropometric or physical performance measures of athletes assigned to teams within the 3 age only–based divisions studied. Finally, we also found no associations between the measures of physical performance we examined and injury.
Presently, the USA Football player progression model recommends configuring youth leagues on the basis of age. Several studies have examined the anthropometric and physical performance and characteristics of professional, 30 collegiate, 17 and high school American football players. 10,14 For example, Dupler et al 10 reported that 11th and 12th grade players tend to be taller, heavier, faster, able to jump higher, and generate greater power than players in the 9th and 10th grades. Physical characteristics (body size and strength) have been suggested as risk factors for injury in American football. 6,15,35 To date, comparative data describing the anthropometric and physical performance characteristics of youth American football players are not extensive. Results of this study indicated that similar to Dupler et al, 10 youth football players in higher grades (7th and 8th) tend to be taller, heavier, faster, and able to jump higher than players in lower grades (5th and 6th). Theoretically, age-only leagues, such as those promoted by the USA Football player progression development model, should evenly distribute players’ anthropometric and physical performance characteristics throughout teams within age divisions to optimize fair play and promote safety. We hypothesized that teams within age divisions should possess equally distributed anthropometric and physical performance measures among players. Overall, our findings describe anthropometric measures of youth football players similar to those reported in prior studies. 9,22,23 Additionally, our findings are among the first to describe multiple physical performance measures in a large sample of youth football athletes. Our data demonstrated no significant differences in the anthropometric measures of players participating on different teams within age divisions. It is plausible to argue that among youth football players, the relative differences are smaller than in high school populations, and the risk of injury may be smaller. Furthermore, although we detected significant differences in measures of speed and agility among players participating on different teams within the B division, the magnitude of these differences was small and not practically meaningful. Collectively, we contend these findings suggest that organizing youth football leagues based on an age-only criterion may evenly match players’ anthropometric and physical performance measures within age divisions. 36 We are aware of no published data describing the anthropometric and physical performance characteristics of youth football players. Most published studies have focused on professional, collegiate, or high school players. As such, our findings may provide new understanding of the anthropometric and physical performance characteristics of youth football players.
During this 2-year prospective study, no fatal or catastrophic injuries occurred. Overall, the incidence rate for all injuries (7.26/1000 AEs) was lower than that reported in previous studies of similarly aged football players. 4,9,23,31,35 Our proportion of NTL injuries (70.1%) was considerably higher than that previously described in youth (58.6%) 9 and in high school (61%) 3 but closer to collegiate American football players (76%). 28 The high percentage of NTL injuries observed in this study contrast with those of Dompier et al, 9 who attributed their relatively low percentage of NTL injuries to highly conservative care due to the young age of the athletes. While we cannot be certain as to the reasons for our high percentage of NTL injuries, similar to Dompier et al, 9 we contend that our findings may be attributed to vigilant recognition, thorough evaluation, and documentation of all injuries regardless of their severity by the league athletic trainer. Consistent with previous research, 9,15,18,32 game injuries in our study accounted for the vast majority (91.6%) of injuries despite accounting for only 22% of total athletic exposures. We found orthopaedic injuries to be nearly evenly divided between the upper and lower body. The knee accounted for most injuries to the lower body, 32 whereas wrist and hand injuries accounted for the majority of upper body injuries. 9,15,35
It is noteworthy that concussions accounted for 19.2% of all injuries, which is nearly double the percentage (9.6%) recently reported during a similar 2-year period. 8 At the time of this study, concussion legislation in Virginia had recently been enacted but pertained only to scholastic and not youth sport. Nonetheless, the large proportion of concussions reported in this study may be attributable to a heighted awareness of concussion among youth league players, coaches, and parents. However, our overall (practices and games) concussion rate (1.39/1000 AEs) is comparable with those previously reported (0.99/1000 AEs and 1.79/1000 AEs). 8,18 Similar to previous studies, the concussion rate was significantly higher in games compared with practices, 9,18,32 which may be attributed to less on-site medical care available at practices as compared with games. Most of the concussions (62%) were reported in the B division (5th and 6th graders)—the youngest and least experienced players (1.5 ± 1.4 years)—as compared with the players in the A (2.5 ± 1.8 years) and S (3.0 ± 1.9 years) divisions, respectively. This finding is seemingly at odds with those that reported playing experience to be a significant predictor of injury. 35 However, their findings pertain to middle school (6th to 8th grades), not youth football, and their population was biased toward older players as only 15% of athletes studied were in the 6th grade. Therefore, the oldest and most experienced players likely had increased opportunity for injury. Collectively, our findings may suggest that increased emphasis on techniques for giving and receiving contact are needed within this age group. USA Football suggests that the 5-step Heads Up Tackling techniques be taught at youth and high school football levels. However, the effectiveness of Heads Up Tackling techniques in reducing head injuries remains poorly understood.
Anthropometric and physical performance characteristics have been suggested as risk factors for injury in American football. 6,15,35 Malina et al 23 reported no associations between anthropometric characteristics of height, BMI, and maturity status with injury among youth football players. Turbeville et al 35 described the grip strength of 646 middle school football players and reported grip strength to not be an injury risk factor. However, the relationship between physical performance measures and injury has not been adequately studied in American youth football. Overall, we found that physical performance measures (speed, agility, upper body muscular endurance, and lower body muscular power) did not predict NTL or TL injuries. These findings lend support to prior research in youth football, which suggests that anthropometric 23 and physical performance 35 measures are not risk factors for injury. However, further research is needed to better understand the complex relationship between players’ anthropometric and physical performance characteristics and injury risk. Future investigations should select performance measures that are age appropriate, sport specific, and target position-specific performance requirements rather than general measures.
Comparable studies have reported similar 11,15,26,31 and opposing findings, 9,18 and therefore, our results should be generalized with caution. Our findings are limited as we were not able to provide the same level of medical coverage for practices as compared with games. As such, our high number of game relative to practice injuries could be attributed to the following: (1) our definition of injury, (2) increased on-site medical care for games as compared with practices, and (3) low injury recognition and reporting compliance from coaches.
Conclusion
Our study demonstrated no differences in anthropometrics or physical performance measures between players participating on teams within a large youth football league divided into age only–based levels of play. Second, our findings demonstrated most injuries to be minor (NTL). Third, the majority of TL injuries were concussions. Finally, physical performance measures were not predictive of injury.
Footnotes
The views expressed in this paper do not represent the views of the funding organizations.
One or more of the authors has declared the following potential conflict of interest or source of funding: This study was funded in part by a nonrestrictive grant from the Central Loudoun Youth Football League and the Potomac Health Foundation.