
Abstract
Purpose
To address gaps in progress in coverage of HIV diagnosis and treatment services for children and adolescents living with HIV compared to adults, the Faith-Based Action for Scaling Up Testing and Treatment for Epidemic Response (FASTER) initiative facilitated partnerships between government, civil society organizations, private sector, and faith-based organizations. FASTER addressed structural barriers to pediatric and adolescent HIV testing and treatment services, expanded access to innovative drugs and diagnostics, and scaled up evidence-based interventions across four countries (Nigeria, Tanzania, Uganda, and Zambia). The purpose of this analysis is to describe progress towards the six FASTER priority actions and to identify persistent programmatic gaps for targeted interventions and ongoing quality improvement efforts.
Methods
Aggregate data on seventeen FASTER performance indicators and routine monitoring, evaluation, and reporting indicators from the U.S. President's Emergency Plan for AIDS Relief (PEPFAR) were compared between baseline and endline of the initiative across 245 FASTER priority facilities.
Major findings
Measurable progress was observed across all indicators. Key successes included expansion of registration of priority pediatric diagnostics across all countries, and an increase in the proportion of children receiving multi-month dispensing, from 64% to 73%. Areas with ongoing service gaps were identified. For instance, fewer than half of facilities reported achieving rates of ≥90% completion of family trees for index testing in children or post-breastfeeding HIV testing for infants.
Conclusion
This assessment at health facilities implementing the FASTER initiative demonstrated progress towards improving HIV services for children and adolescents. It also identified opportunities for continued improvement to address ongoing gaps. Lessons learned from the FASTER initiative can inform national strategies to rapidly advance progress to improve services for children, adolescents.
Plain Language Summary
Why was this done?
Children and adolescents living with HIV have lower rates of diagnosis and treatment than adults. The FASTER initiative was created to close this gap by improving HIV testing and treatment services for children and adolescents.
What did we do?
FASTER brought together governments, civil society groups, the private sector, and faith-based organizations in Nigeria, Tanzania, Uganda, and Zambia. These partnerships worked to overcome barriers to care, make new medicines and diagnostic tools more available, and scale up proven approaches to strengthen HIV programs for children and adolescents. We reviewed data from health facilities participating in this initiative on HIV testing and treatment in children and adolescents before and after the initiative.
What did we find?
Data showed progress in HIV testing and treatment for children at participating health facilities. However, challenges remain in areas such as testing children of people living with HIV, ensuring children stay on treatment, and tracking infants of mothers living with HIV.
Why it matters:
The lessons from FASTER show that partnerships with faith-based organizations may help strengthen HIV services for children and adolescents. These experiences may help guide other programs working to improve HIV care for these populations.
Introduction
Progress towards global testing and treatment goals among children living with HIV (CLHIV) has continued to lag behind compared to adults. In 2023, global estimates of achievement towards UNAIDS 95–95–95 goals (95% of people living with HIV are diagnosed, 95% of people diagnosed are on treatment, and 95% of those on treatment are virally suppressed) were 86–77–72 in adults and 66–57–48 in children, respectively. 1 The emergence of better drugs and diagnostics for young children offers substantial potential to accelerate the pediatric and adolescent HIV response and reduce these global inequities. Successful introduction of treatment services and diagnostic products into countries requires coordination between multiple stakeholders within and outside of the government to obtain regulatory approvals and complete other processes that permit the adoption of new drugs and diagnostics. However, challenges such as slow or unclear regulatory approval processes and disjointed HIV service delivery between different parts of the health systems, such as public and faith-based sectors, or community- and facility-based health services remain.2,3
In addition to continuing to address parental and caregiver barriers related to pediatric HIV case-finding, new and expanded efforts are needed to improve case-finding for asymptomatic CLHIV who are less likely to interact with the health system, and for adolescents who experience unique developmental, behavioral, and social challenges. 4 Moreover, the full potential of these activities will not be realized unless well-organized, data-driven, and targeted case-finding, linkage to optimal treatment, and retention efforts are scaled-up concurrently.
To address these concerns, the Faith-Based Action for Scaling Up Testing and Treatment for the Epidemic Response (FASTER) initiative facilitated novel partnerships between government, civil society organizations, private sector, and faith-based organizations (FBOs) to address barriers to pediatric and adolescent HIV testing and treatment. FASTER promoted access to innovative drugs and diagnostics and scaled up evidence-based interventions across four countries (Nigeria, Tanzania, Uganda, and Zambia) with low antiretroviral therapy (ART) coverage for children and adolescents. 5 FASTER created enabling environments to advance operational guidance, tool development, training, practical evidence, and proofs of concept that allowed HIV care facilities and providers to quickly expand HIV testing and pediatric-friendly treatment, care, and support services for children and adolescents. FASTER employed three primary strategies: addressing structural barriers to pediatric testing and treatment, improving quality of services, and expanding innovative interventions. FASTER supported 245 health facilities in the four countries through mentorship and quality improvement, human-centered design, data-use dashboards, and strengthened coordination between public and faith-based health sectors. Each country tailored a package of interventions to their context to support quality adherence counselling, monitoring of treatment failure, transition support to second- or third-line treatment, psychosocial support, and adolescent-friendly services. These strategies and activities were used to make progress towards six FASTER priority actions: (1) streamlining regulatory approvals; (2) integrating Ministry of Health (MOH) and FBO service delivery; (3) expanding diagnostic platforms; (4) evaluating novel HIV testing approaches; (5) implementing validated HIV risk screening tools; and (6) optimizing pediatric ART regimens. Seventeen FASTER performance indicators were identified to monitor progress towards these priority actions (Table 1).
FASTER Performance Indicators.

Not reported in this manuscript.
Results reported in another manuscript.
We assessed the impact of the FASTER initiative by examining changes in 13 of the 17 FASTER performance indicators using FASTER data and data from routine monitoring, evaluation, and reporting (MER) data from the U.S. President's Emergency Plan for AIDS Relief (PEPFAR) between baseline and endline of the project. The purpose of this analysis is to describe progress towards the six FASTER priority actions and to identify persistent programmatic gaps for targeted interventions and ongoing quality improvement efforts.
Methods
Setting
FASTER was implemented by providing support and accountability to implementing partners across 245 priority facilities: Nigeria (n = 58), Tanzania (n = 48), Uganda (n = 89) and Zambia (n = 50). FASTER worked with PEPFAR implementing partners, MOH, civil society, and faith-based partners to purposively select facilities through incorporating data on geographic gaps in case identification, burden of disease, low viral load suppression (VLS) for children and adolescents living with HIV (C/ALHIV), and high infant HIV positivity as well as other country-specific considerations. The details of the FASTER initiative and priority actions have been previously described. 5
Assessment Design
This was a pre-post assessment comparing data for each FASTER performance indicator at baseline and endline of the FASTER initiative to identify progress.
Data Collection
Full details of FASTER data collection activities and performance indicators are described elsewhere. 5 Briefly, facility-level data on seventeen FASTER performance indicators were collected from 245 FASTER facilities on a quarterly basis between October 2020 and March 2022. Data were collected from partner databases and national health information systems by project-specific Monitoring and Evaluation Officers, and were reported each quarter in aggregate at the facility-level. Reported data were compiled into a dataset containing data from all 245 facilities. In addition to facility-level data, select national-level data were abstracted from project quarterly reports at baseline and endline for the FASTER performance indicators 1.1, 1.2, and 2.1.
Facilities also routinely reported PEPFAR MER indicators in aggregate by facility on a quarterly basis, separate from the FASTER project. PEPFAR MER data were downloaded as a structured dataset from Panorama (https://data.pepfar.gov/), PEPFAR's platform for sharing programmatic data. MER indicators analyzed related to testing included number of HIV tests administered and number of positive HIV tests from the following testing strategies: index testing, provider-initiated testing and counseling (PITC, mainly representing testing in outpatient departments [OPD]), pediatric, tuberculosis (TB) clinic, malnutrition, and inpatient departments. MER indicators analyzed related to treatment included the number of children on ART and the number that received multi-month dispensing (MMD) of their antiretroviral (ARV) medications.
Data Analysis
Facilities in each country were selected for the analytical sample if data were available at both the baseline and endline time points used for that country, with 235/245 (95.9%) facilities included in the analysis (Nigeria = 57, Tanzania = 45, Uganda = 86, Zambia =47). To allow for comparison across countries while acknowledging differences in timing of project initiation and reporting, 4–5 quarters with the most complete data were identified for each country. The following timepoints were used as the relative baseline and endline reporting periods for each country: Nigeria Baseline (B): October–December 2020, Nigeria Endline (E): July–September 2021; Zambia B: October–December 2020, Zambia E: October–December 2021, Tanzania B: October–December 2020, Tanzania E: October–December 2021, Uganda B: October–December 2020, Uganda E: July–September 2021.
Thirteen of the 17 FASTER performance indicators were included in this analysis; data for two indicators (Indicators 4.1 and 6.1) have been reported in separate abstracts or manuscripts to allow more detailed analysis6,7 or description of operational research methodology for activities not yet part of national policy, such as caregiver-assisted HIV self-testing (HIVST).8,9 Data on two indicators (Indicators 2.4 and 5.2) is not available due to limitations with existing monitoring and evaluation systems.
Data from the 235 facilities included both the FASTER performance indicators and MER indicators and were compared at baseline and endline for the respective countries using descriptive statistics, categorized by each of the six priority actions. Depending on the indicator, these comparisons included some or all of the following data: (1) the number and proportion of facilities reporting that FASTER performance indicator; (2) Among reporting facilities, the number and proportion of facilities implementing services related to that indicator; (3) the number and proportion of reporting facilities achieving ≥90% coverage of services for that indicator; (4) PEPFAR MER data demonstrating the number of children and adolescents receiving services associated with that FASTER performance indicator.
Data analysis was conducted in SAS v9.4. For this analysis, children were defined as <15 years and adolescents as 15–19 years.
Ethical Considerations
This project and assessment activity were reviewed by CDC, deemed not research, and were conducted consistent with applicable federal law and CDC policy (See e.g., 45 C.F.R. part 46, 21 C.F.R. part 56; 42 U.S.C. §241(d); 5 U.S.C. §552a; 44 U.S.C. §3501 et seq). Ministries of Health from the four countries provided letters of support for the protocol and analysis.
Results
Priority Action 1: Streamline Regulatory Approvals
Performance Indicator 1.1: Proportion of target diagnostics approved in program countries
Nigeria, Zambia, and Tanzania revised national regulatory policies to streamline the introduction of pediatric diagnostics and drugs. Nigeria formalized the National HIV Laboratory Task Team with an official document addressing national regulatory authorities’ roles with MOH coordination. Zambia supported the MOH to develop a standard operating procedure and Guidelines for Approval of Laboratory Equipment and Commodities to register and approve laboratory equipment and products. 10 Tanzania revised the Tanzania Medicine and Medical Devices Authority Client Services Charter, reducing approval time for: (1) World Health Organization (WHO) prequalified products (including ARVs, from 240 to 90 days), (2) imported medical devices and diagnostics (from 200 to 90 days), and (3) imported medicinal products (from 240 to 200 days). 11
The following seven products were prioritized for registration in the four countries: GeneXpert point-of-care (POC) tests for early infant diagnosis (EID), GeneXpert POC tests for viral load (VL), m-PIMA POC tests for EID, m-PIMA POC tests for VL, OraQuick oral mucosal HIV self-test (HIVST) kits, plasma separation cards (PSC), and Wondfo syphilis test. At baseline, the Oraquick HIVST kit was registered in all four countries, and all GeneXpert and m-PIMA POC EID and VL products were registered in Tanzania, Uganda, and Zambia (with the exception of m-PIMA POC VL in Uganda) (Table 2). At endline, four of the seven products (GeneXpert POC EID and VL, m-PIMA EID, and Oraquick kits) were registered in all four countries by endline. The most progress was made in Nigeria, which registered or approved five of the seven products between baseline and endline (all except OraQuick, which was already registered at baseline, and Wondfo syphilis test). While OraQuick HIVST kits were already registered in the four countries at baseline, FASTER helped secure government buy-in for demonstration of their use in children (2–11 years), including the programmatic use of caregiver-assisted HIVST in Nigeria and Zambia, the implementation of a study on caregiver-assisted HIVST in Zambia and Uganda, 8 and filing of the label change for healthcare worker-assisted HIVST for children with the National Drug Authority in Uganda. FASTER also supported a demonstration project for plasma separation cards for VL in Nigeria and approval for the Wondfo one-step rapid syphilis test in Zambia.
Registration of Diagnostic Products at the National-Level at Baseline and Endlinea (Nigeria, Uganda, Tanzania, and Zambia, 2020–2022).
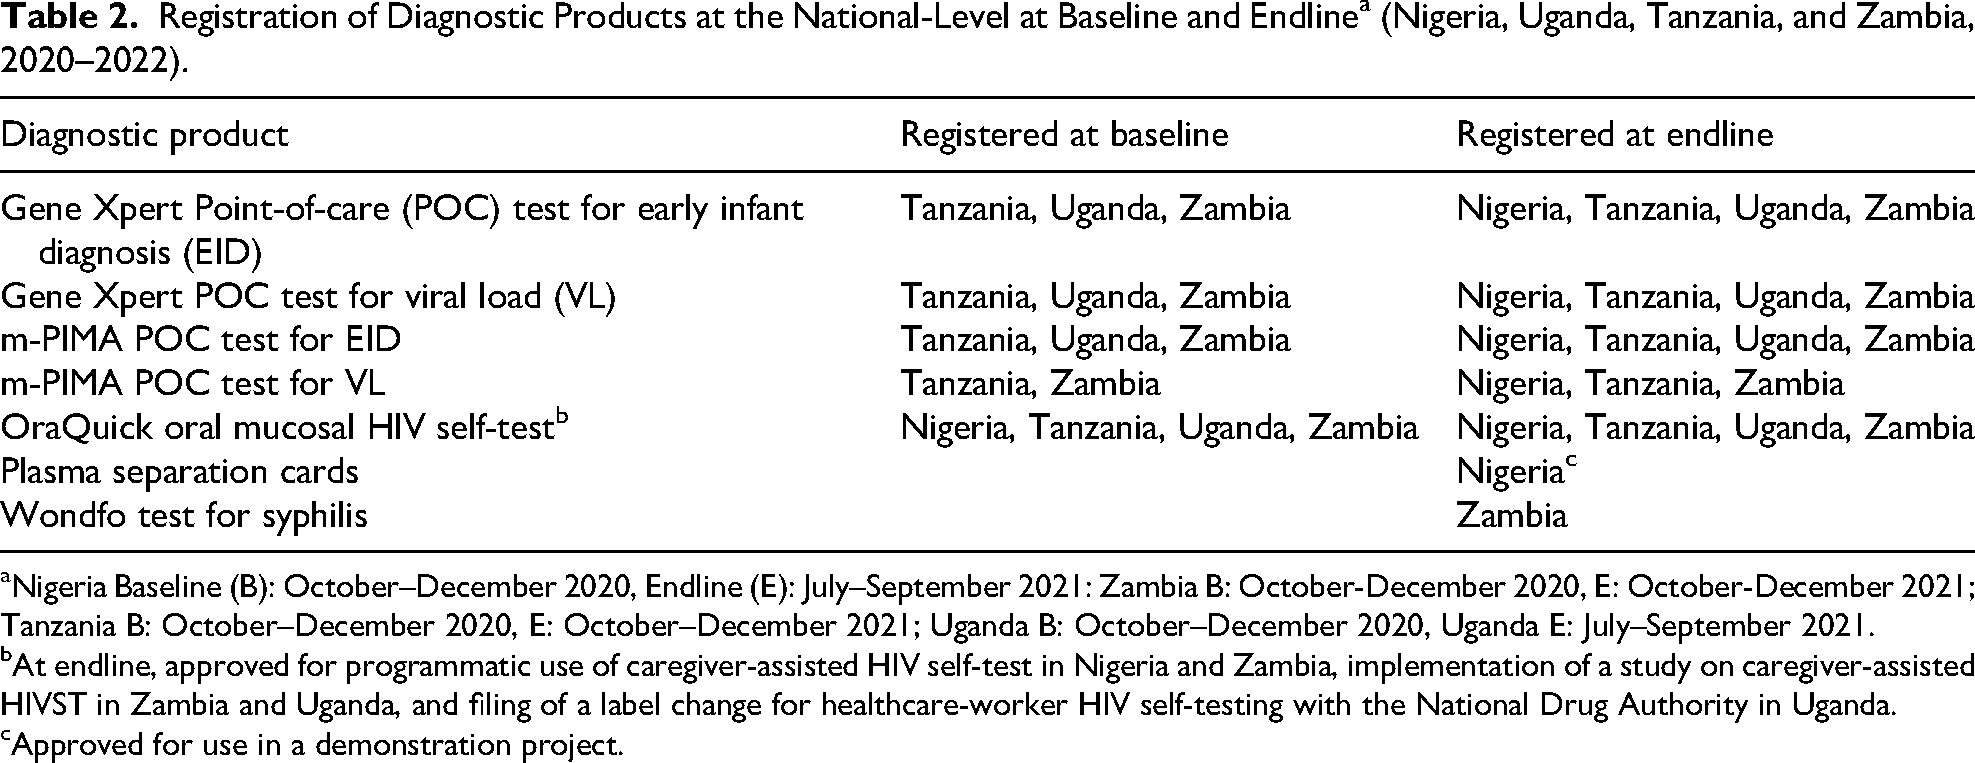
Nigeria Baseline (B): October–December 2020, Endline (E): July–September 2021: Zambia B: October-December 2020, E: October-December 2021; Tanzania B: October–December 2020, E: October–December 2021; Uganda B: October–December 2020, Uganda E: July–September 2021.
At endline, approved for programmatic use of caregiver-assisted HIV self-test in Nigeria and Zambia, implementation of a study on caregiver-assisted HIVST in Zambia and Uganda, and filing of a label change for healthcare-worker HIV self-testing with the National Drug Authority in Uganda.
Approved for use in a demonstration project.
Performance Indicator 1.2: Increased information transparency through establishment of global database of technical performance data on WHO- pre-qualified or Stringent Regulatory Authority approved diagnostics products
FASTER established a global database on technical performance of WHO-prequalified or stringent regulatory authorities (SRA) approved diagnostics products. The Diagnostics Evidence Hub, 12 launched in September 2022, is an online platform that summarizes publicly available performance data of new diagnostic products, increasing information transparency.
Priority Action 2: Integrate MOH-FBO Service Delivery
Performance Indicator 2.1 Number of priority facilities with adopted standardized referral/linkage procedures
Nearly all facilities reporting this indicator (n = 232 at baseline, n = 230 at endline) indicated utilization of standardized referral/linkage procedures at both baseline (n = 228, 98.3%) and endline (n = 229, 99.6%). Among facilities following referral/linkage procedures, individual referral/linkage procedures increased slightly from baseline to endline, including use of referral registers (80.7% to 81.2%), referral forms (91.2% to 95.6%), feedback forms (44.7% to 50.7%), a referral directory (32.0% to 36.2%) or referral maps (28.1% to 35.8%). Change in referral/linkage procedures varied by country (Table 3).
Referral/linkage Procedures Implemented at 235 FASTER Priority Facilities at Baseline and Endlinea (Nigeria, Uganda, Tanzania, and Zambia, 2020–2022).

Nigeria baseline (B): October–December 2020, endline (E): July–September 2021
Zambia B: October–December 2020, E: October–December 2021
Tanzania B: October–December 2020, E: October–December 2021
Uganda B: October–December 2020, Uganda E: July–September 2021.
Performance Indicator 2.2 Number of active national and sub-national community-facility committees developed/strengthened to enhance pediatric and adolescent HIV services
Nigeria maintained high numbers of sub-national committees, including those with a focus on pediatric/adolescent HIV, from baseline (n = 24) to endline (n = 22). Uganda reported one national committee focused on pediatric/adolescent HIV at both baseline and endline. Zambia and Tanzania did not have national information systems that allowed them to monitor community-facility committee numbers.
Performance Indicator 2.3 Proportion of priority facilities implementing Differentiated Service Delivery models
Nearly all facilities reporting this indicator (n = 232 at baseline, n = 229 at endline) indicated implementation of differentiated service delivery (DSD) models at both baseline (100.0%) and endline (99.6%). However, this varied by country due to country-specific enrollment eligibility policies and practices for children and adolescents. Among the 15 DSD models monitored, 13 remained stable or were scaled up between baseline and endline, with variability by country (Table 4). At endline, the most prevalent DSD models were fast-track ART (86% of facilities, range 70-95% across countries) and MMD (range 92%–98% across Zambia, Nigeria, and Tanzania; Uganda did not report). At endline, home refills had high uptake in Nigeria (98%), with lower uptake in Tanzania (50%) and Zambia (57%). The majority of Operation Triple Zero (OTZ) clubs, a peer-led model for adolescents living with HIV, were in Nigeria (82% of facilities at endline). Other adolescent support groups varied by country (range 43–80% across Zambia, Nigeria, and Tanzania).
Differentiated Service delivery (DSD) Models Implemented at 235 FASTER Priority Facilities at Baseline and Endlinea (Nigeria, Uganda, Tanzania, and Zambia, 2020–2022).

Nigeria baseline (B): October–December 2020, endline (E): July–September 2021. Zambia B: October–December 2020, E: October–December 2021
Tanzania B: October–December 2020, E: October–December 2021
Uganda B: October–December 2020, Uganda E: July–September 2021.
Only reported from Uganda.
PEPFAR MER data from the 235 FASTER facilities showed a 13% increase in the number of CLHIV <15 years receiving 3+ MMD (≥3 months of medication dispensed), from 15,501 at baseline to 17,478 at endline. Among CLHIV on ART (24,157 at baseline; 23,899 at endline), the proportion receiving 3+ MMD also increased from 64% at baseline to 73% at endline.
Priority Action 3: Expand Diagnostic Platforms
Performance Indicator 3.2 Proportion of priority facilities conducting infant exposure screening in non-PMTCT entry points
Infant exposure screening varied by non-prevention of mother-to-child transmission (PMTCT) entry point but generally increased or was similar from baseline to endline (Figure 1). Among the 235 facilities, screening increased at immunization entry points [110 (47%) to 126 (54%) facilities] and outpatient entry points [158 (67%) to 179 (76%) facilities]. Screening at inpatient entry points remained stable [97 (41%) to 96 (41%) facilities]. Among non-PMTCT entry points offering infant exposure screening at endline, completeness of screening was low: only 41 (33%), 77 (43%), and 50 (52%) facilities achieved ≥90% coverage of screening at endline at immunization, outpatient, and inpatient entry points, respectively. Nigeria and Zambia improved screening at all three entry points, while Uganda and Tanzania had decreased rates of screening at most entry points.

Screening for infant exposure status at non-PMTCT entry points for 235 FASTER priority facilities at baseline and endline* (Nigeria, Uganda, Tanzania, and Zambia, 2020–2022). *Nigeria Baseline (B): October–December 2020, endline (E): July–September 2021 Uganda B: October–December 2020, Uganda E: July–September 2021 Tanzania B: October–December 2020, E: October–December 2021 Zambia B: October–December 2020, E: October–December 2021.
Performance Indicator 3.3 Proportion of priority facilities tracking retention/testing along the EID/PMTCT cascade, including the end of breastfeeding outcomes of mother-infant pairs in PMTCT
Of 235 facilities that reported this indicator, 219 (93%) reported tracking mother-infant pair (MIP) retention through the end of breastfeeding at baseline and 226 (96%) at endline. Among reporting facilities, use of electronic tracking systems increased from 39 (18%) to 88 (39%), including 100% of facilities in Tanzania and lower proportions (26%–31%) in the other three countries. The proportion of facilities using systems (either electronic- or paper-based) to track MIPs until end of breastfeeding varied by country (Figure 2). At endline, 100% of facilities had a MIP tracking system in Uganda, Nigeria and Zambia, compared to 80% of facilities in Tanzania (baseline range across countries 75.6%–100%). Among 134 facilities in Nigeria, Zambia, and Tanzania reporting, 50 (37%) facilities reported ≥90% of infants received HIV testing at the end of breastfeeding, which increased to 68/140 facilities (49%) at endline (Figure 2e). Country-specific changes are included in Figure 2a–d.

Mother-infant pair tracking systems reporting HIV testing of infants at the end of breastfeeding (BF) at 235 FASTER priority facilities at baseline and endline* (Nigeria, Uganda, Tanzania, and Zambia, 2020-2022). *Nigeria baseline (B): October–December 2020, endline (E): July–September 2021 Uganda B: October–December 2020, Uganda E: July–September 2021 Tanzania B: October–December 2020, E: October–December 2021 Zambia B: October–December 2020, E: October–December 2021. †Uganda did not report number of facilities with infants receiving HIV testing at the end of breastfeeding. ‡Countries included: Nigeria, Tanzania, and Zambia. Uganda excluded due to not reporting number of facilities receiving HIV testing at the end of breastfeeding MIP: mother-infant pair; BF: breastfeeding.
Priority Action 4: Evaluate Novel HIV Testing Approaches
Performance Indicator 4.1 Proportion of priority facilities that scaled up pediatric and adolescent HIV testing models
HIV testing models reviewed included index testing, PITC, and HIVST. Among reporting facilities (n = 232 baseline, n = 230 endline), the proportion that implemented testing models for children/adolescents was high at both baseline and endline (100.0% and 99.1%). Among facilities reporting on testing modalities/strategies (n = 232 baseline, n = 228 endline), several testing modalities were high at baseline and endline, including index testing (98.7% and 97.8%) and PITC (99.1% and 99.1%). However, the proportion of facilities implementing HIVST in children and/or adolescents increased from 60.8% (baseline) to 76.3% (endline).
PEPFAR MER data at the 235 FASTER facilities showed HIV testing in children <15 years across all PEPFAR testing modalities increased by 4%, from 23,636 (baseline) to 24,536 (endline). Despite increased HIV testing, the number of CLHIV testing HIV-positive decreased by 46% (n = 579 baseline, n = 411 endline). For adolescents 15–19 years, HIV testing decreased by 16% (n = 25,482 baseline, n = 21,328 endline), and the number of adolescents testing HIV-positive decreased by 19% (n = 455 baseline, n = 368 endline).
Performance Indicator 4.2 Proportion of priority facilities routinely conducting provider-initiated testing and counseling (PITC) for eligible children and adolescents in priority entry points
PITC entry points included TB, inpatient, and pediatric services. Among reporting facilities (n = 232 baseline, n = 230 endline), PITC at TB clinic was high at both baseline and endline (98.3% and 97.8% of facilities, respectively). PITC increased at pediatric services (86.6% to 90.0% of facilities), yet decreased at inpatient (84.9% to 80.9% of facilities).
PEPFAR MER data from the 235 FASTER facilities showed variability in reporting: Uganda and Zambia reported on testing in TB clinics, inpatient, and malnutrition; Tanzania only reported on testing in TB clinics; and Nigeria reported on testing in TB clinics and inpatient. HIV testing among children <15 years increased 52% in TB clinics (n = 459 baseline, n = 697 endline), increased 8% in inpatient (n = 1038 baseline; n = 1121 endline) but decreased 72% in malnutrition (n = 88 baseline, n = 25 endline). The number of children testing HIV-positive increased 11% in TB clinics (n = 35 baseline, n = 39 endline), decreased 43% in inpatient (n = 7 baseline, n = 4 endline) and decreased in malnutrition (n = 1 baseline, n = 0 endline). For adolescents 15–19 years, testing increased 56% in TB clinics (n = 138 baseline, n = 215 endline) and increased 34% in inpatient (n = 394 baseline, n = 527 endline). The number of adolescents testing HIV-positive increased 233% at TB clinics (n = 3 baseline, n = 10 endline) and by 25% in inpatient wards (n = 4 baseline, n = 5 endline).
Performance Indicator 4.3 Proportion of Priority Facilities Completing Family Trees for Index Clients (i.e., People Living with HIV)
Among reporting facilities (n = 232 baseline, n = 230 endline), the proportion implementing family tree tools to support index testing of children remained high (97.4% to 98.3%). Among facilities implementing family tree tools (n = 226 baseline, n = 226 endline), the proportion that achieved ≥90% completion of family trees increased from 31.9% to 42.5%.
PEPFAR MER data from the 235 FASTER facilities showed a 7% increase in the number of children elicited through index testing (n = 9378 baseline; n = 9999 endline) and a 14% increase in the number of children tested through index testing (n = 6767 baseline; n = 7687 endline); the proportion of elicited children that were tested improved slightly (72.2% baseline, 76.9% endline). The number of children testing HIV-positive decreased by 31% (n = 456 baseline, n = 314 endline). Index testing trends varied across the four countries (Figure 3). For adolescents 15–19 years, the number tested through index testing increased 17% (n = 843 baseline, n = 989 endline), while the number of adolescents testing HIV-positive remained similar (n = 111 baseline, n = 110 endline).

Index testing cascade among children at 235 FASTER priority facilities at baseline and endline* (Nigeria, Uganda, Tanzania, Zambia, 2020–2022). *Nigeria baseline (B): October–December 2020, Endline (E): July–September 2021 Zambia B: October–December 2020, E: October–December 2021 Tanzania B: October–December 2020, E: October–December 2021 Uganda B: October–December 2020, Uganda E: July–September 2021.
Priority Action 5: Implement Validated HIV Risk Screening Tools
Performance Indicator 5.1 Proportion of priority facility facilities routinely using age-specific screening tools in high-volume entry points
Among reporting facilities (n = 232 baseline, n = 230 endline), the proportion implementing age-specific screening tools was high at both baseline and endline (90.5% and 94.8%).
PEPFAR MER data from the 235 FASTER facilities showed small increases in testing among children <15 years, by 3% at OPD (n = 12,195 baseline; n = 12,227 endline) and 6% at pediatric services (n = 2188 baseline; n = 2061 endline). The number of children testing HIV-positive decreased 34% at OPD (n = 172 baseline, n = 114 endline) and 33% for pediatric services (n = 21 baseline, n = 14 endline). Among adolescents 15–19 years, the number tested at OPD decreased 19% (n = 8952 baseline; n = 7247 endline), and the number testing HIV-positive decreased 51% (n = 223 baseline, n = 114 endline).
Priority Action 6: Optimize Pediatric ART Regimens
Performance Indicator 6.2 Proportion of Priority Facilities Implementing Comprehensive Quality of Care Standard Package for Children and Adolescents
Among reporting facilities (n = 186 baseline, n = 159 endline), the proportion implementing guidelines for care of children and adolescents increased (41.4% to 98.7%). There were increases in implementation of standard operating procedures (SOPs) for C/ALHIV (41.4% to 100.0%), use of guidelines for transition of care from adolescence to adulthood (64.0% to 78.0%), and presence of pediatric ART clinical team (83.9% to 91.2%) and continuous quality improvement teams (90.3% to 95.0%). The proportion providing psychosocial support increased for both caregivers (63.4% to 82.2%) and adolescents (65.6% to 79.9%). The proportion of facilities with a stock out of ≥1 pediatric ARV regimens decreased (64.5% to 54.1%).
Performance Indicator 6.3 Proportion of Priority Facilities Providing Standard-of-Care Viral Load Monitoring for Children and Adolescents
Among reporting facilities (n = 186 baseline, n = 190 endline), the proportion with a viral load (VL) monitoring algorithm was high at both baseline (97.8%) and endline (100.0%). The proportion with a tracking system for children with elevated VL remained high (98.9% at baseline and endline).
Discussion
This analysis demonstrated improvement across HIV testing and treatment indicators for children and adolescents at facilities participating in the FASTER initiative, which aimed to advance progress towards six priority actions to improve HIV services for infants, children, and adolescents. The analysis also identified ongoing gaps and opportunities for continued improvement and scale of services. These results indicate that the FASTER model 5 of national-level integrated service delivery across partners can be successful in improving both service and health-related HIV indicators in children and adolescents. This approach could be used as a model for other countries to rapidly advance progress for children and adolescents, including adopting changes to regulatory and monitoring systems, strengthening engagement of FBO partners, introducing innovative diagnostics, and assisting further scale up of quality services and DSD models.
Areas with large observed improvement included increases in diagnostic product registration, improved systems and reduced time for regulatory approvals of new diagnostic products, increased numbers of children receiving HIV testing and multi-month dispensing of ART, and increased number of facilities implementing guidelines and quality-of-care packages for children and adolescents living with HIV. The analysis identified several areas that had high performance at baseline that was maintained through endline; these included having standardized referral/linkage processes, implementing DSD models, systems for tracking MIP, certain pediatric and adolescent testing models (PITC and use of HIV screening tools), and using VL algorithms. Finally, there were several areas that saw improvements but still remained sub-optimal, including infant screening at non-PMTCT entry points (which had both low proportion of facilities implementing and low coverage of testing at implementing facilities), testing HIV-exposed infants at the end of breastfeeding, HIV testing in malnutrition, completion of family trees (despite most facilities reporting using these tools), and stockouts of pediatric optimal ARVs.
FASTER's support for national-level activities likely contributed to many of these successful outcomes, including the development of national strategies, training manuals, service charters, screening algorithms, capacity building of health providers, and job aids to promote sustainable changes in pediatric and adolescent HIV services. Collecting and regularly analyzing data on these indicators may have helped identify areas for enhanced efforts to close gaps in the quality HIV clinical care for children at both the national-level and facility-level. Additionally, standardizing a comprehensive quality of care package and monitoring the different elements over time may be an effective strategy for programs to replicate, as this produced improvements in the implementation of SOPs for C/ALHIV, provision of psychosocial support, transition from adolescent to adult care, and reduction in ARV stockouts.
For areas identified for improvement, further investigations are needed. Despite the increased numbers of children receiving HIV testing in the four countries, the number of children with positive tests decreased. This pattern was seen across most pediatric testing modalities at FASTER facilities. As progress is made towards closing the gap in the first 95 for children, it will be more challenging to find the remaining undiagnosed children and declines in positive tests may be seen. Index testing is a key strategy to identify C/ALHIV, yet at FASTER facilities, fewer than half of facilities achieved ≥90% completion of family trees. These findings align with other evaluations of index testing among children in Kenya, Democratic Republic of Congo, and Zimbabwe, which found that before their interventions, 70% of eligible index patients on ART had not had their children elicited by healthcare staff, 13 or had untested children. 14 After their initiatives, 5%–32% of elicited children remained untested.13–15 This highlights the importance of healthcare staff eliciting pediatric contacts for PLHIV that have been on treatment for years (i.e., not just newly diagnosed PLHIV), as many have children with an unknown HIV status. This also highlights the importance of offering alternate strategies, like caregiver-assisted HIVST to overcome historical barriers, such as fear of HIV status disclosure, children living at school or with other relatives, cost of travel, and lack of parental consent to reach these remaining untested children.13,14 Further investigation is also needed into the reasons behind the declines in PITC in malnutrition and inpatient departments, as these children are often very ill and at higher risk for poor outcomes. There were also a number of gaps identified for testing HIV-exposed infants, including low uptake of exposure screening for HIV-exposed infants at non-PMTCT entry points, as well as low testing coverage of infants at the end of breastfeeding, despite most facilities reporting implementation of tracking systems. Community-based peer or mentor mothers can be instrumental in tracking and tracing mothers and infants throughout the 24-month exposure period until infant final outcome is ascertained. 16 There also remain opportunities to scale-up use of electronic systems for MIP tracking by ensuring PMTCT modules are included in existing electronic monitoring and reporting systems.
This assessment has several strengths. It included a large number of facilities across diverse geographic contexts, allowing for robust assessments of program performance and cross-country comparison. The assessment was conducted within routine programmatic settings using existing health systems, increasing the relevance of findings for real-world implementation and decision-making. There are also several limitations with this analysis. First, not all FASTER facilities reported data at the time points identified for baseline and endline. Therefore, this analysis does not represent results at all FASTER facilities. Certain indicators had lower rates of reporting completeness, impacting the ability to interpret the change in results from baseline to endline for that indicator. Several indicators were not able to be reported across any or all countries due to limitations with existing monitoring and evaluation systems. As noted in the methods, countries introduced and scaled-up FASTER activities at different time points, resulting in differing time points for baseline and endline within the analysis. Improvements in indicators cannot be directly attributed to FASTER for a variety of reasons, including the assessment design, lack of individual-level data, concurrent facility- or national-level interventions by MOH and other partners, and other potential confounders. Further, the results presented here are not fully generalizable to other facilities within the four countries or to other countries, as they may differ in terms of cultural, structural, and epidemiological factors. Even among the four countries, there was a large degree of heterogeneity in results; this analysis was not designed to identify reasons for heterogeneity, but are likely attributable to differing policies, implementation guidance, and other health systems-related factors. This affirms the need for continued cross-country sharing to share lessons learned, which can inform national strategies to sustain gains, while enhancing strategies to close remaining gaps. Additional limitations related to data collection and data management, such as staff turnover, limited availability of mobile data entry devices, and COVID-19 travel restrictions, are described elsewhere. 5
Conclusion
This assessment at health facilities implementing the FASTER initiative demonstrated progress towards six priority actions to improve HIV services for pregnant and breastfeeding women, infants, children, and adolescents, and also identified opportunities for continued improvement to address ongoing gaps. Lessons learned from the FASTER initiative can inform national strategies for these four countries, as well as other countries, to rapidly advance progress to improve services for children and adolescents.
Footnotes
Acknowledgements
The authors would like to thank Elizabeth Rabold, Elizabeth Carter, Jennifer Swanson, and Kimi Sato for their recommendations on data presentation.
Ethical Considerations
This project and assessment activity were reviewed by CDC, deemed not research, and were conducted consistent with applicable federal law and CDC policy (CDC project ID #0900f3eb81e5d5b5).
Consent to Participate
CDC ethical review determined that informed consent was not needed, since no individual-level data was obtained.
Consent for Publication
Not applicable.
Author Contributions
DW, DM, CK, EZ, SN, GM, MM, MI, AR, EM, AI, CO MH, NM, KP, SD, KS, TF, DO, and JG were responsible for conception of the design and analysis. DM, AC, ML, MGA, PA, CC, BK, EA, AK, JN, CM, SD, CA, KS, AW, LS, JK, VN, LM, FM supported data collection and oversight. SH, BL, DW, and JG performed the analysis and prepared the original draft. All authors read and approved the final manuscript.
Funding
The authors disclosed receipt of the following financial support for the research, authorship, and/or publication of this article: This research was supported by the President's Emergency Plan for AIDS Relief (PEPFAR) through the Centers for Disease Control and Prevention (CDC) under the terms of a Cooperative Agreement number GH001463.
Declaration of Conflicting Interests
The authors declared no potential conflicts of interest with respect to the research, authorship, and/or publication of this article.
Data Availability
Data can be made available upon request.
Disclaimer
The findings and conclusions are those of the authors and do not necessarily represent the official position of the funding agencies.