
Abstract
Introduction
In 2020, the Joint United Nations Programme on HIV/AIDS (UNAIDS) estimated that 1.7 million children aged 0–14 years were living with HIV worldwide. 1 In 2020, among 1.6 million people living with HIV in Nigeria aged ≥15 years, 89% were receiving antiretroviral therapy (ART), but only 45% of the 130 000 HIV-positive children aged 0–14 years were receiving ART. In addition, only 23% of HIV-exposed infants underwent early HIV testing before eight weeks of age in Nigeria in 2020. 2 However, Nigeria had made substantial progress in the rollout and uptake of ART for pregnant and breastfeeding women, averting 7600 new infections by preventing HIV mother-to-child transmission (PMTCT) in 2020. 2 The 2018 Nigeria HIV/AIDS Indicator and Impact Survey (NAIIS) reported that the national HIV prevalence was 1.4%. 3 Despite these gains, challenges remained along the care continuum to identify and promptly link children and adolescents living with HIV to optimal treatment.
Despite ART’s importance for optimal health outcomes, many children and adolescents are not retained in care. Factors associated with attrition include younger age, shorter ART duration, and severe immunosuppression. 4 Since 2004, support from the United States (U.S.) government through the President’s Emergency Plan for AIDS Relief (PEPFAR) has substantially expanded HIV care and treatment services to 34 states and the Federal Capital Territory (FCT) of Nigeria, and it continues to support the availability of and access to ART. By the end of June 2017, 47 213 children and adolescents aged 0–19 years were receiving ART across all PEPFAR-supported sites in Nigeria. Through routinely reported programmatic data from PEPFAR-supported health facilities, limited information has been published on the outcomes of children and adolescents receiving ART. Given this information gap and the public health relevance of retention in care among pediatric patients, we examined treatment outcomes of HIV-positive children and adolescents aged 0–19 years who initiated ART at PEPFAR-supported sites in Nigeria.
Methods
Study Design and Setting
We retrospectively analyzed data abstracted from medical charts for randomly selected children and adolescents aged 0–19 years who initiated ART at 129 PEPFAR-supported sites between October 2007 and September 2016 among 30 states and the FCT in Nigeria. Of the 36 states in Nigeria, Abia and Taraba are not supported by PEPFAR. Among the remaining 34 states, Kebbi, Zamfara, Ekiti, and Jigawa were excluded from this analysis due to security reasons that prevented data collection.
Selection of Facilities and Patients
We selected all facilities providing ART to ≥100 HIV-positive children and adolescents as of June 30, 2017. We then determined, proportionate to facility size, the number of patient records needed by site to reach the overall sample size. We created a sample frame for all patients meeting the following inclusion criteria: aged 0–19 years at the time of ART initiation, received care at any of the included sites, and initiated ART between October 2007 and September 2016. Finally, the sample frame was divided by the sample size for the site to provide the interval for systematic random sampling of charts, which was used to select subsequent charts after the first identification until the number required from that site was selected.
Sample Size
Limited data are available for all children and adolescents who initiated ART in the Nigerian program; therefore, we used the PEPFAR “treatment current” (TX_CURR) indicator, defined as “the number of children and adolescents currently receiving ART,” to determine the size of our population. Assuming a 75% retention rate at 12 months after ART initiation, 20% missing medical records, 95% confidence interval, and a design effect of 3.0, we estimated a sample size of 4289.
Measures
Outcomes of interest included lost to follow-up (LTFU) rates, mortality rates, and ART adherence rates at 12 months after ART initiation. We defined LTFU as not having a clinic visit after 90 days of missing a scheduled clinical appointment. We classified the patient as LTFU even if they re-engaged in care within 12 months after the event. The beginning of the follow-up period was the date of ART initiation. Patients who transferred (n = 8) and who discontinued ART (n = 3), as documented in the medical records, were considered in care. Individuals were classified as adherent if the ratio between the number of pills dispensed and days between refills was ≥95%.
Demographic and clinical variables were sex, age at ART initiation, region, status, parental HIV status, body mass index (BMI), CD4 + cell count, year of ART initiation, World Health Organization (WHO) disease stage, sexually transmitted infections, chronic illness (eg, diabetes, kidney disease, and heart disease), tuberculosis (TB) status, cotrimoxazole prophylaxis, first antiretroviral regimen at initiation, protease inhibitor (PI) versus non-nucleoside reverse transcriptase inhibitor (NNRTI)-based regimen, pre-ART counselling, and counselling at ART initiation.
Data Collection
Routine programmatic data of eligible children and adolescents were extracted from electronic and paper-based records at the selected facilities and were uploaded into a data collection application, Encuesta, which was developed by the University of Maryland, Baltimore’s Nigeria-based team. Data collection took place concurrently across the included 30 states and the FCT in September 2018. The following source documents were reviewed: ART care cards, pediatric and adult initial clinical evaluation forms, pharmacy order forms, laboratory order forms, HIV enrolment forms, genealogy charts, patient case notes, treatment preparation and readiness forms, death register, and electronic medical records (where available). During and after abstraction, all charts were reviewed for completeness and accuracy by their respective abstraction team leads. Team leads reviewed a minimum of 10% of charts abstracted by team members for accuracy and completeness and ensured that data triangulation for required data elements was done at the facility. The data manager at the central level reviewed team lead submissions and validated data entries.
Statistical Analysis
Descriptive analysis was performed for all variables to determine the frequency, distribution, and the amount of missing data for each variable. Variables with implausible values were documented and assessed for further data cleaning and validation before exclusion. Proportion calculation and the chi square test performed for baseline demographic characteristics across age group categories.
We used bivariate analyzes to investigate baseline patient characteristics by outcome. Proportions were compared using chi square test or Fisher exact test in the cases when the conditions for chi square test had not been met. Cause-specific hazards for attrition were estimated using Cox proportional hazards models to estimate the rate of LTFU among patients receiving treatment. Patients who died or were transferred were excluded from this analysis because of the low number of mortality events available for a competing risks analysis and because of the likely different mechanisms underlying transfers compared with death. All significant variables (P < .05) in the univariate model were added to the multivariate model in addition to known confounders. We used a linear mixed model to estimate the mean CD4 + cell counts at baseline, both at six months and 12 months. The linear mixed model was stratified by age groups and adjusted for sex, baseline CD4 + cell count <200 cells/mm3, and TB status at baseline. CD4 + cell counts documented between 4 and 8 months were counted or considered as six months for the purpose of this analysis. Likewise, CD4 + cell counts documented between 9 and 15 months were counted, or considered, as 12 months.
For ART refill adherence, patients were included in the analysis if they had at least two documented refill dates. Refills in the first 14 days of ART or after the 12-month follow-up were excluded. Days between refill visits were then calculated for all patients with a refill date and the corresponding number of days’ worth of pills were dispensed. The ART refill adherence rate was calculated as (sum of days’ worth of pills dispensed/sum of days between refills) × 100. Time from documented ART start date was used to calculate the visit interval corresponding with each month of the first 12 months of treatment. Adherence >100 was averaged to 100. For patients with more than one documented refill date in a month, the last refill date and number of pills was retained. Adherence was categorized as non-adherent (<95%) and adherent (≥95%). Generalized estimating equations accounting for the correlation between repeated measurements were used to model the odds of non-adherence at each interval. All variables with significant values (P < .05) in the initial model were added to the multivariate model in addition to known confounders.
Pediatric HIV treatment guidelines changed across the different ART initiation years included in this analysis (2007-2016);5,6 therefore, all analyzes were adjusted for year of ART initiation. Statistical analysis was conducted using SAS 9.4 (SAS Institute, Cary, NC).
Ethical Approval and Informed Consent
This study was revised according to the US Centers for Disease Control and Prevention (CDC) human research protection procedures and was determined to be research; however, investigators did not interact with human subjects or have access to identifiable data or specimens for research purposes. Additionally, this study was approved by the National Health Research Ethics Committee of Nigeria (NHREC Assigned Approval Number: NHREC/01/01/2007), and the University of Maryland, Baltimore Institutional Review Board (Approval of Research Notification: HP-00081170). A waiver of consent was obtained for the purposes of this study.
Results
Demographic and Clinical Characteristics of the Study Population
The final study sample included 4007 children and adolescents whose medical records were abstracted from 129 facilities across 30 states and the FCT. Among these 4,007, 4006 (>99.9%) were alive at the end of the follow-up period and included in this analysis. Of these 4006 patients, 2893 (72.2%) were children aged 0–9 years, and 1113 (27.8%) were adolescents aged 10–19 years. Most patients were female (n = 2191 [54.7%]), and most (n = 1738 [43.4%]) initiated ART in the North Central region. Of the study population, 52.5% had WHO stage I disease (n = 1973), 88.2% had no signs of TB (n = 3193), and 98.5% had no reported chronic illness (n = 3513). Among those with available CD4 + cell count at baseline (n = 2283), more than half (n = 1307 [57.2%]) had a CD4 + cell count of less or equal than 500 cells/mm3 at ART initiation. Most of the population had an HIV-positive parent (96.1% [n = 2561]). There was high uptake of pre-ART counselling (n = 3174 [91.3%]) and counselling at ART initiation (n = 3325 [95.8%]) among patients. Most patients (n = 3353 [95.5%]) were receiving a NNRTI-based regimen at baseline (Table 1).
Baseline Characteristics of HIV-Positive Children and Adolescents Aged 0–19 Years Receiving Antiretroviral Therapy (ART) at Selected US PEPFAR-Supported Sites in Nigeria (2007-2016) by Clinical Outcome at the end of the Follow-up Period.
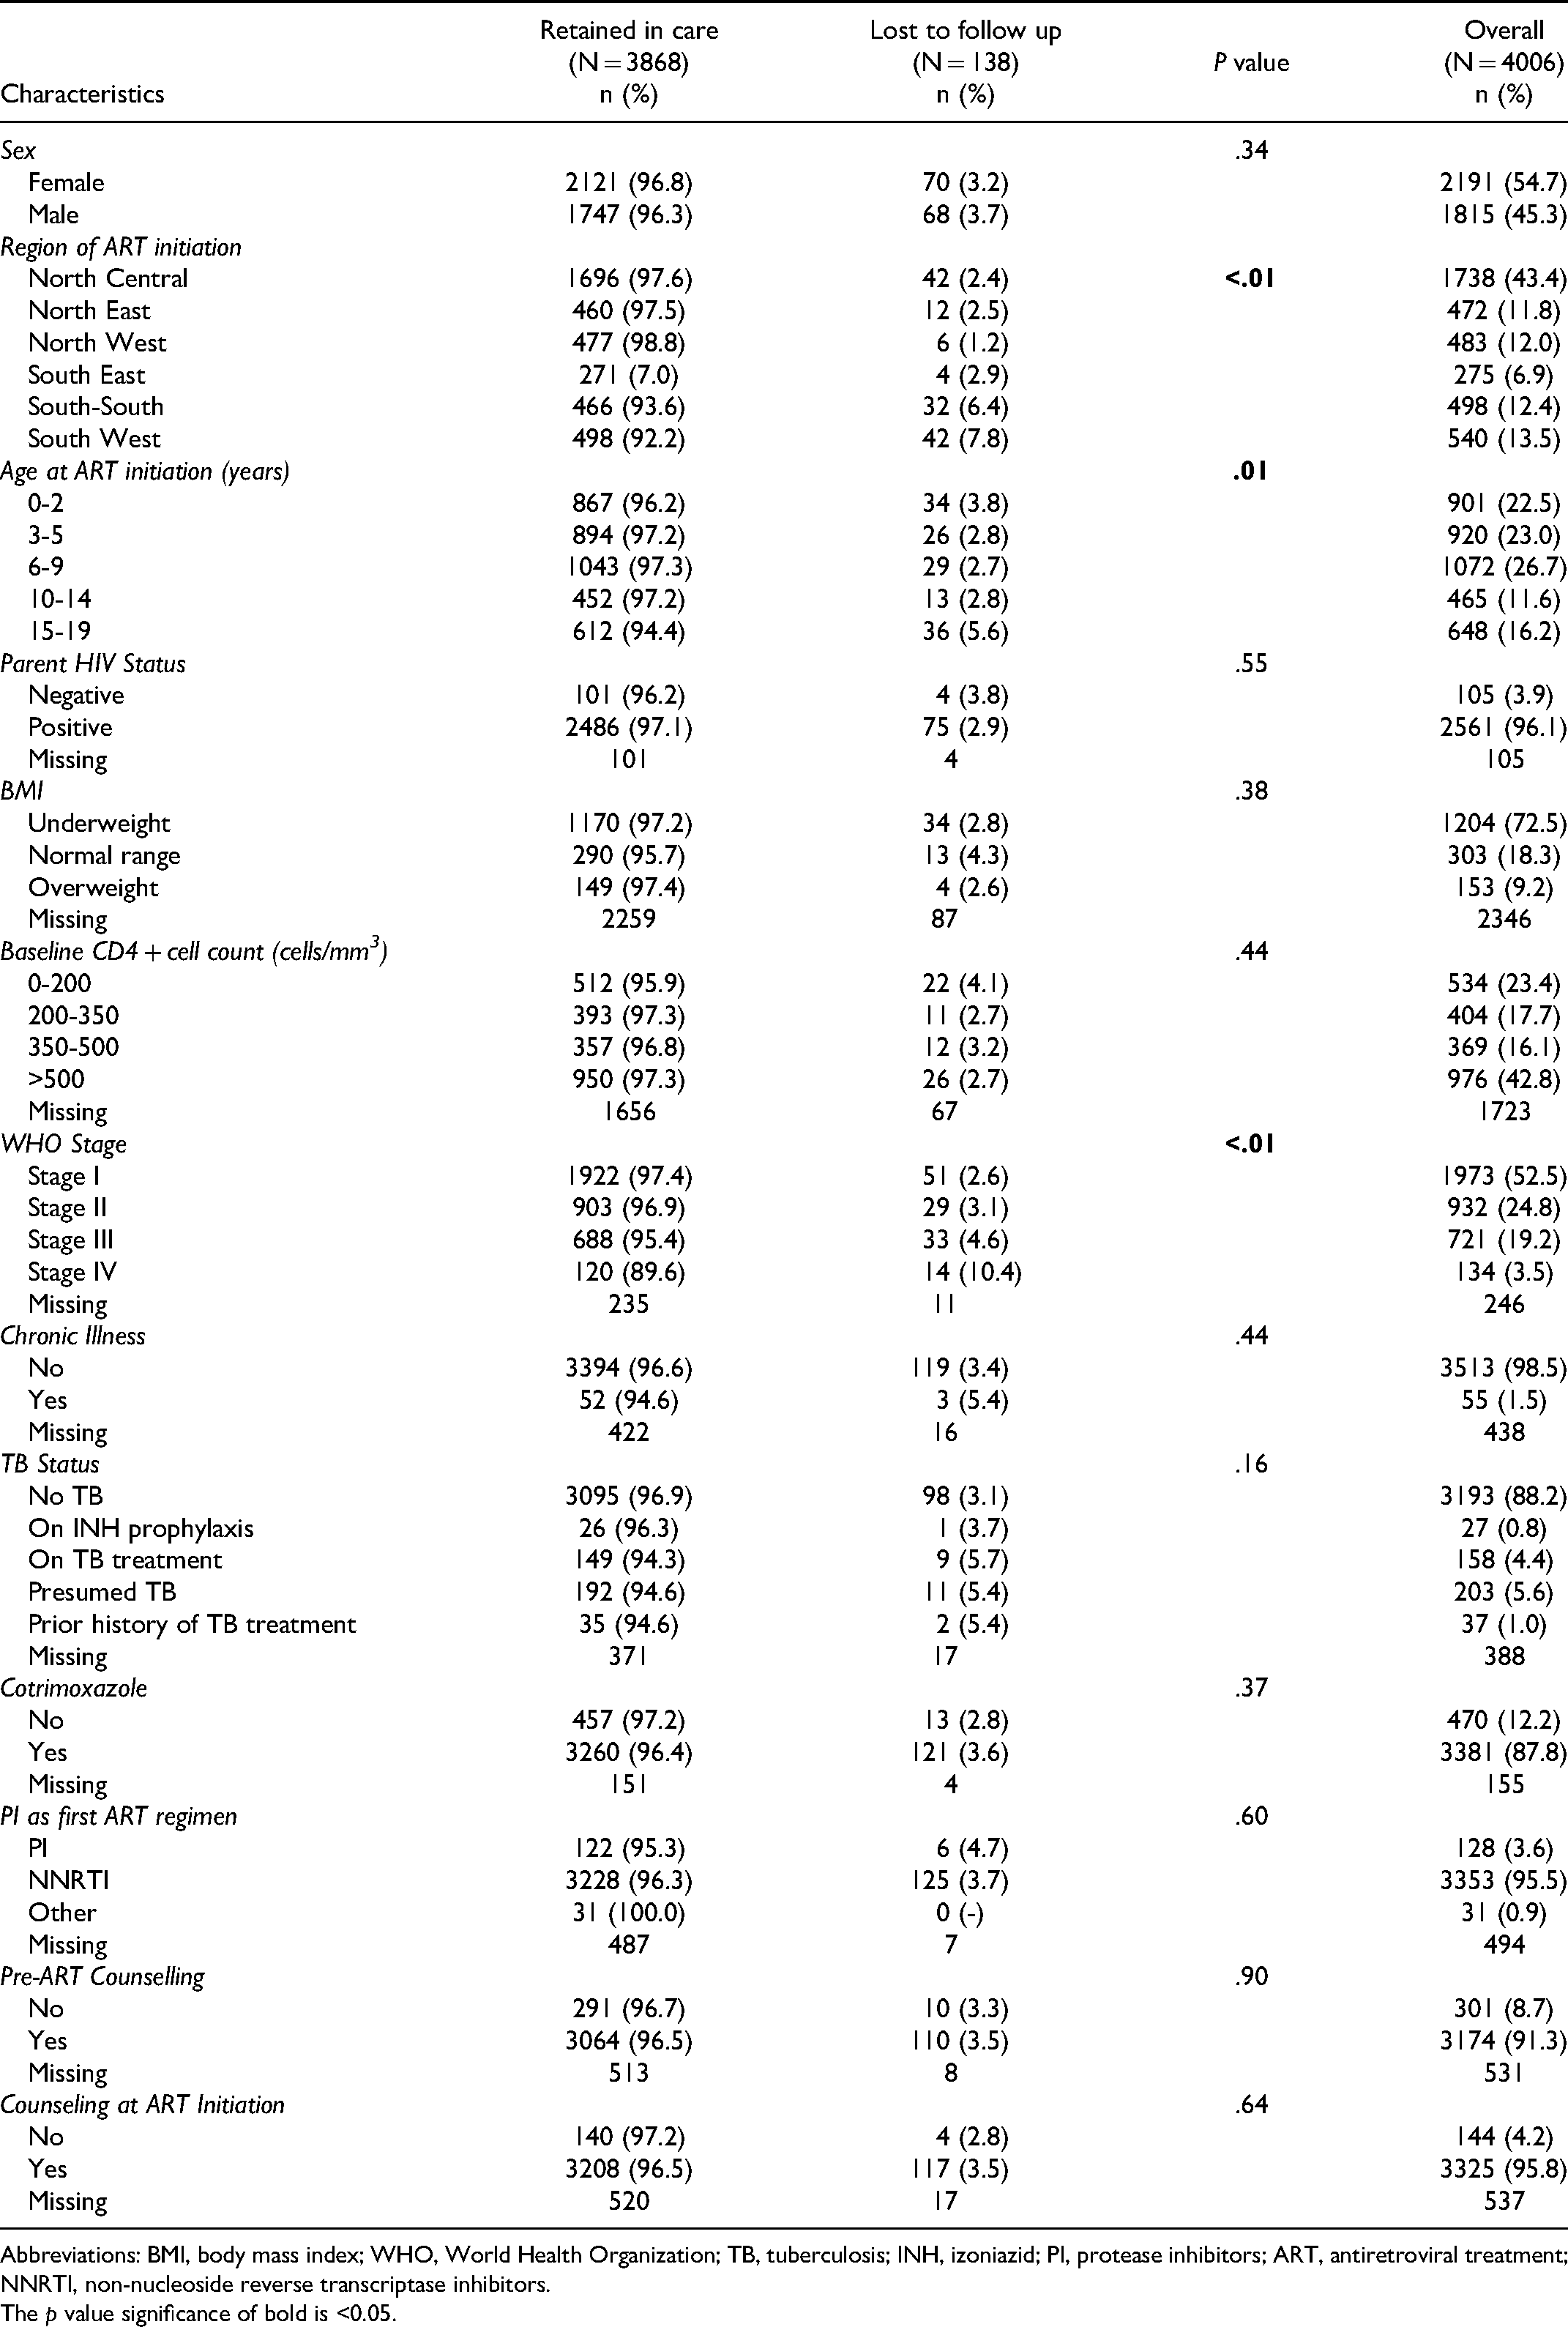
Abbreviations: BMI, body mass index; WHO, World Health Organization; TB, tuberculosis; INH, izoniazid; PI, protease inhibitors; ART, antiretroviral treatment; NNRTI, non-nucleoside reverse transcriptase inhibitors. The p value significance of bold is <0.05.
When we stratified our population by age categories, HIV prevalence was disproportionally impacting females aged 15-19 years old (78.1% vs other age categories ranging between 49.0%-52.0%, P < .01). The proportion of patients with a baseline CD4 + cell above 500 cells/mm3 (not with advanced disease) also significantly differed across age categories. Seventy percent of children 0-2 years old had a baseline CD4 + cell count above 500 cells/mm3, 3-5 years old 62.2%, 6-9 years old 35.5%, 10-14 years old 18.4%, and 15-19 years old 15.2%.
LTFU Rates
Among 4006 patients included, 138 (3.4%) were LTFU. LTFU rates significantly differed by age group (P = .01): children aged 0–2 years, 3.8%; children aged 3–5 year, 2.8%; children aged 6–9 years, 2.7%; adolescents aged 10–14 years, 2.8%; and adolescents aged 15–19 years, 5.6% (Table 1). South South (6.4%) and South West (7.8%) regions had a higher LTFU rates compared to other regions (<3.0%) (P < .01). Individuals classified as WHO stage IV (10.4%) had a higher LTFU rate compared to those classified under the other stages (<5.0%) (P < .01) (Table 1).
In a Cox proportional hazards regression analysis (adjusting for region, sex, age at ART initiation, WHO stage, and year of ART initiation), children initiated in any region except the South-South region had a significantly lower risk of being LTFU than children in the South West region. Adolescents aged 15–19 years at ART initiation had significantly higher risk of being LTFU than children aged 3–5 years (HR 2.47 [1.40-4.34]). Additionally, children with advanced disease (WHO stage III HR, 1.75 [1.12-2.74]; stage IV HR, 3.66 [2.00-6.68]) had significantly higher risk of being LTFU than those with stage I disease (Table 2).
Cox Proportional Hazard Regression Analysis for Lost to Follow-up (LTFU) Rates among HIV-Positive Children and Adolescents Aged 0–19 Years Receiving Antiretroviral Therapy (ART) at Selected PEPFAR-Supported Sites in Nigeria (2007-2016).

Adjusted for region, age, sex, clinical stage, year of initiation.
Abbreviations: HR, hazard ratio; CI, confidence interval; BMI, body mass index; WHO, World Health Organization; TB, tuberculosis; PI, protease inhibitors; ART, antiretroviral treatment; NNRTI, non-nucleoside reverse transcriptase inhibitors. The p value significance of bold is <0.05.
Mean CD4 + Cell Counts Over Time by age Group
Estimated population marginal means were calculated for CD4 + cell counts for each age group (0-2, 3-5, 6-9, 10-14, and 15-19 years) at baseline, at six months, and at 12 months, adjusting for sex, baseline CD4 + cell count <200 cells/mm3, and TB status at baseline. The marginal means by age group are described in Table 3. As observed in Figure 1, for all age groups, CD4 + cell counts increased from baseline to six months, but not from six to 12 months.

Mean estimates of CD4 + cell counts by age group across time among participants.
Adjusted Model Based Mean CD4 + Cell Count (Cells/mm3) Over time by age group (years) among HIV-positive children and adolescents aged 0–19 years receiving antiretroviral therapy (ART) at selected US President’s Emergency Plan for AIDS Relief-supported sites in Nigeria (2007-2016).

Abbreviations: CI, confidence interval.
ART Refill Adherence Rate
ART refill adherence was estimated for 3175 (79.3%) patients. The mean medication refill adherence over 12 months following ART initiation was 91.9% (95% confidence interval [CI]: 91.4%–92.5%). Among patients with available data, 67.3% (n = 2138) had in average 95% ART refill adherence based on pharmacy refill data. On logistic regression analysis adjusting for repeated observations for the same patient and adjusted for confounders, patients who initiated ART in the North East (adjusted Odds Ratio (aOR), 1.47 [95% CI: 117-1.86]) and South-South (aOR, 1.43 [95% CI 1.16-1.57]) regions were more likely to be non-adherent than those in the South West region. In contrast, patients with HIV-positive parents (aOR, 0.78 [95% CI: 0.63-0.98]) were less likely to be non-adherent than those with HIV-negative parents (Table 4).
Characteristics associated with less than 95% ART refill adherence (non-adherence) among HIV-positive children and adolescents aged 0–19 years receiving antiretroviral therapy at selected US PEPFAR supported sites in Nigeria (2007-2016).

Accounting for repeated measures by the same individual.
Adjusted for region, parent’s HIV status, age, sex, TB status, and year of initiation.
Abbreviations: OR, odds ration; CI, confidence interval; BMI, body mass index; WHO, World Health Organization; TB, tuberculosis; PI, protease inhibitors; ART, antiretroviral treatment; NNRTI, non-nucleoside reverse transcriptase inhibitors. The p value significance of bold is <0.05.
Discussion
We found high retention in care and moderate ART refill adherence at 12 months after ART initiation among selected children and adolescents receiving HIV care and treatment in PEPFAR-supported facilities in 30 states and the FCT. Patients initiated in South-South and South West region, those with advanced HIV disease (defined as WHO HIV Stage III and Stage IV, 7 ) and adolescents aged 15-19 had a higher risk of being LTFU. Similarly, patients aged 15-19 and those initiated in South-South region were associated with being non-adherent.
The LTFU rate (3.4%) reported in our population was lower than the rates reported in children in other HIV programs in sub-Saharan Africa, which were around 7.0% to 8.8% after 1 year on treatment.8,9 In Nigeria, Ojeniran et al reported a 16% LTFU rate among children aged 0–14 years after 7 years of ART. 10 In Zimbabwe, Kranzer et al reported a 8.5% LTFU rate among a cohort similar to ours in age (5-19 years).11,12 Differences in context, setting, population, definitions of LTFU, and study design could explain the differences observed across studies.
We also observed a U-shaped trend of LTFU rates across age categories at ART initiation. Infants aged 0–2 years (3.8%) and adolescents aged 15–19 years (5.6%) at ART initiation had higher LTFU rates than children or adolescents starting ART in the other age categories (range, 2.7%–2.8%). Particularly, adolescents aged 15–19 years at ART initiation had more than two times higher risk of being LTFU than children aged 3–5 years. Similarly, aged cohorts in Zimbabwe also showed this trend.11,13 Infant mortality rates and barriers to care encountered by adolescents aged 15–19 years as they age out of pediatric clinics could partly explain the U shape trend we observed.14,15 Patients with advanced HIV disease (WHO stage III or IV) had a higher risk of being LTFU in our study, as previously reported for both children and adults.16,17
As expected, CD4 + cell counts steadily increased from baseline to six months after ART initiation for all groups. The younger the children, the greater the increase in CD4 + cell count over time. Simms et al also reported that once receiving ART, children aged 6–9 years had a larger increase in CD4 + cell count than children aged 10–17 years. 18
Of our study population, 67% had an ART refill adherence ≥95% in average during the 12 months. Previous Nigerian studies report around 76%–85% adherence among children and adolescents;19–21 however, varying ART adherence definitions and measures could explain these differences. In our study, age was not a significant risk factor associated with ART refill non-adherence, except among adolescents 15-19 years old. Meloni et al also described steady adherence across age groups among Nigerian adolescents aged 10–19 years. 21 In contrast, although in a different setting, Williams et al described a 10% increase in the odds of non-adherence per year of age in an ongoing multicenter prospective observational study of children and adolescents in the United States. 22
In addition, younger age groups (aged 0-14 years) in our population, HIV prevalence by sex was stable; however, among adolescents aged 15–19 years, our findings showed a disproportional impact of HIV among young women. Our findings suggest the critical role of sexual transmission among young women; therefore, preventing HIV sexual transmission among adolescent girls and young women is critical to closing this gap. Additionally, our results showed an increase of advance HIV disease (CD4 + cell count ≤500 cells/mm3) as age increases, suggesting the need for earlier HIV diagnosis and ART initiation. Our study also showed 96% of children and adolescents had at least one HIV-positive parent. This finding is important, as it can inform ongoing case identification efforts and highlights the need to scale up index testing of biological children in Nigeria.
Our study is subject to several limitations. Some key variables, such as CD4 + cell count, were missing more than 40% of data. This might have introduced selection bias because participants with available data might differ significantly from those without data on key characteristics. CD4 + percentage, a commonly used marker to measure immune status in children,23,24 was not available for analysis. Additionally, although HIV viral suppression is an informative outcome of HIV care and treatment, routine viral load monitoring was relatively new, and VL coverage was still low during the study period. Therefore, we did not include VL as an outcome of this analysis. Nevertheless, our study is one of the few publications reporting programmatic data on outcomes among children and adolescents receiving ART in sub-Saharan Africa, particularly in Nigeria.
Our findings suggest that focusing on preventing and managing advanced HIV disease, strengthening index testing of biological children of HIV-positive adults, and developing support programs for parents with HIV-positive children could help improve clinical outcomes among children aged 0–19 years. Additionally, interventions supporting adolescents when transferring to adult care and strengthening of education about HIV sexual prevention among female adolescents are warranted. Furthermore, given the high percent of missing data observed in our study, improving programmatic data documentation and quality could help enhance patient follow-up and management and data reporting.
Footnotes
Declaration of Conflicting Interests
The author(s) declared no potential conflicts of interest with respect to the research, authorship, and/or publication of this article.
Funding
The author(s) disclosed receipt of the following financial support for the research, authorship, and/or publication of this article: This work was supported by the Center for Global Health, (grant number NU2GGH001976-01-00).
Ethics Approval
This study was approved by the National Health Research Ethics Committee of Nigeria, University of Maryland, Baltimore Institutional Review Board, and the U.S. Centers for Disease Control and Prevention (Atlanta, GA).