
Abstract
Aim:
To evaluate the prevalence, diameter, localization of the posterior superior alveolar artery (PSAA) and the relationship between PSAA and the floor of the maxillary sinus and the thickness of the maxillary sinus lateral wall using cone-beam computed tomography (CBCT).
Material and Methods:
In this retrospective study, more than 500 CBCT images were retrieved. Out of them 156 CBCT images were related to the sinus floor elevation, among which 120 CBCT images were enrolled in the study based on the inclusion criteria, and 36 CBCT images were excluded. A total of 120 CBCT images of the PSSA from 60 patients comprising 32 (53.3%) men and 28 (46.7%) women were analyzed. Statistical data were analyzed using SPSS for Windows version 22. Descriptive statistics (mean, standard deviation, frequency) were used for the analyses.
Results:
The ages of the participants ranged between 26 and 76 years and the mean age was 54.48 ± 10.92 years. The PSAA was detected on the right side in 95% of the CBCT scans and on the left side in 85% of the maxillary sinuses. At the first detection point (FDP) and last detection point (LDP), the mean values of the distance between the inferior border of the PSAA and the floor of the maxillary sinus were 9.54 ± 4.27 mm and 7.91 ± 4.75 mm, respectively. The mean diameters of the PSAA at the FDP and LDP were 1.36 ± 0.46 mm and 1.12 ± 0.35 mm, respectively.
Conclusion:
Detection of the characteristics of the PSAA by using CBCT is crucial for handling the sinus floor elevation procedures uneventfully.
Keywords
Introduction
Maxillary posterior bone deficiency is a major challenge in dental implant surgery. The reconstruction of the posterior maxilla for implant placement is necessary due to atrophic bones and the limitations of maxillary sinus relating to pneumatization of the sinus following the loss of posterior teeth. For this reason, a number of techniques including intra- or extra-oral block graft techniques, the split crest technique, and sinus floor elevation with a lateral wall or the crestal approach may be applied for increasing the width and height of the bone.
An assessment of the anatomy of the maxillary sinus is crucial before the administration of surgical intervention through the use of procedures such as Lefort 1 osteotomy, Caldwell-Luc surgery, osteosynthesis, or sinus floor elevation via a lateral wall. The descending palatine artery, infraorbital artery (IOA), posterior superior alveolar artery (PSAA), and the sphenopalatine artery are branches of the maxillary artery that supply the maxilla and maxillary sinus. 1 Blood supply to the lateral wall of the maxillary sinus, the periosteum and the Schneiderian membrane is provided by the IOA and PSAA. 2 The IOA and PSAA are located in the sinus wall and may form intra- or extraosseous anastomoses.3–6 Sinus floor elevation via the lateral wall is a sinus augmentation technique that was first described by Boyne and James and then modified by Tatum.7,8 Although sinus floor elevation is a predictable and safe technique, bleeding and perforation of the Schneiderian membrane are the main complications that can be encountered during surgery. 9 The PSAA should be taken into consideration during sinus augmentation via the lateral approach to avoid not only bleeding but also the disruption of the blood supply to the maxilla. 10 The PSAA runs caudally outside of the maxillary tuberosity, and the path of the intraosseous PSAA in the lateral wall of the sinus has been categorized as the straight type (type 1) and the U-shaped type (type 2). 11 Although injury to the PSAA does not result in life-threating bleeding, an injury to the large diameter of the artery can provoke extreme hemorrhaging and can cause obscuring of vision as well as perforation of the sinus membrane in the event of prolonged duration of surgery. 12 The maximum diameter of the PSAA can reach 3 mm.2,12
Sinus floor elevation via the lateral window can interfere with the PSAA; therefore, treatment planning is important before surgical intervention. The osteotomy or ostectomy window should be 2–3 mm away from the maxillary sinus floor and the anterior border of the maxillary sinus should be circular, oval, or rectangular in shape with round corners.13,14 The superior border and length of the ostectomy window depend on the length and number of implants. 15 The aim of this study was to elucidate the location, prevalence, and diameter of PSAA and the thickness of the lateral sinus wall. Our study is different from other studies in terms of the measuring technique and due to the fact that it was performed only on cone-beam computed tomography (CBCT) images of patients with the indications of sinus floor elevation.
Materials and Methods
Study Design
In this retrospective analytical study, more than 500 CBCT images were retrieved from the archives of the Faculty of Dentistry between January 2014 and July 2016. With regard to the maxillary CBCT images, only those for subjects meeting the following criteria were included: (a) Complete or partial (posterior) edentulous patients, (b) Patients with sinus floor elevation indications, (c) Patients with no maxillary sinus pathology, maxillary trauma, fractures, impacted teeth, or who had undergone previous paranasal surgical interventions, (4) Patients with no dental implant placements and/or augmentations relating to the sinus, and (5) Adequate quality of CBCT scans with no artifacts. After more than 500 CBCT images were examined, it was detected that 156 CBCT images were related to the sinus floor elevation, among which 120 CBCT images were enrolled in the study based on the inclusion criteria. We have calculated a sample size with G*power (G*Power Software, Dusseldorf, Germany) 3.1.9.4 software with given effect size (0.60), α (0.05), and power (0.095). In brief, we have performed t test with mean differences between two independent means (right and left).
CBCT Image Acquisition
The CBCT images were obtained using a 3D Accuitomo 170 (3D Accuitomo; J Morita Mfg. Corp., Kyoto, Japan) CBCT imaging system, operating at 60–90 kVp, 1–10 mA, and 18 sec scanning time in standard resolution mode (voxel size, 0.16 mm). Reformatted scans were evaluated using the i-Dixel One Volume Viewer software program on HP Pavilion 22×25 inch led monitors with 1-mm cross-sections in the same period of each day and under sufficient indoor lighting.
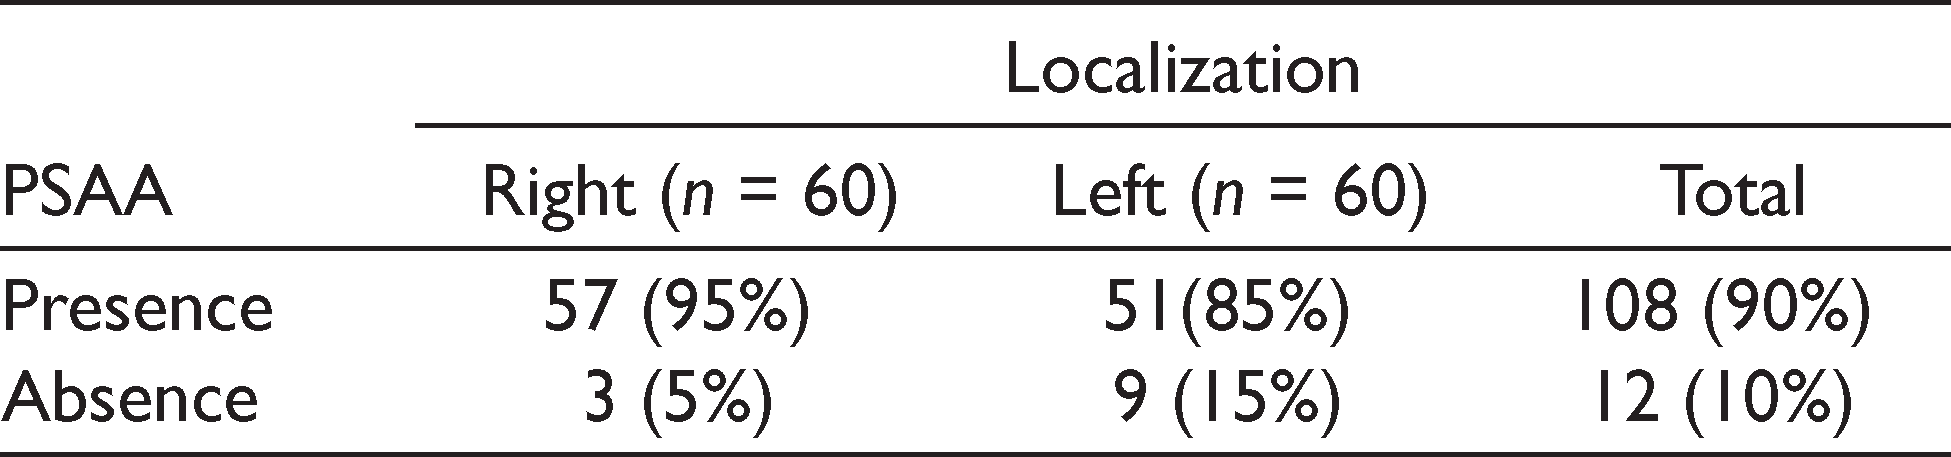
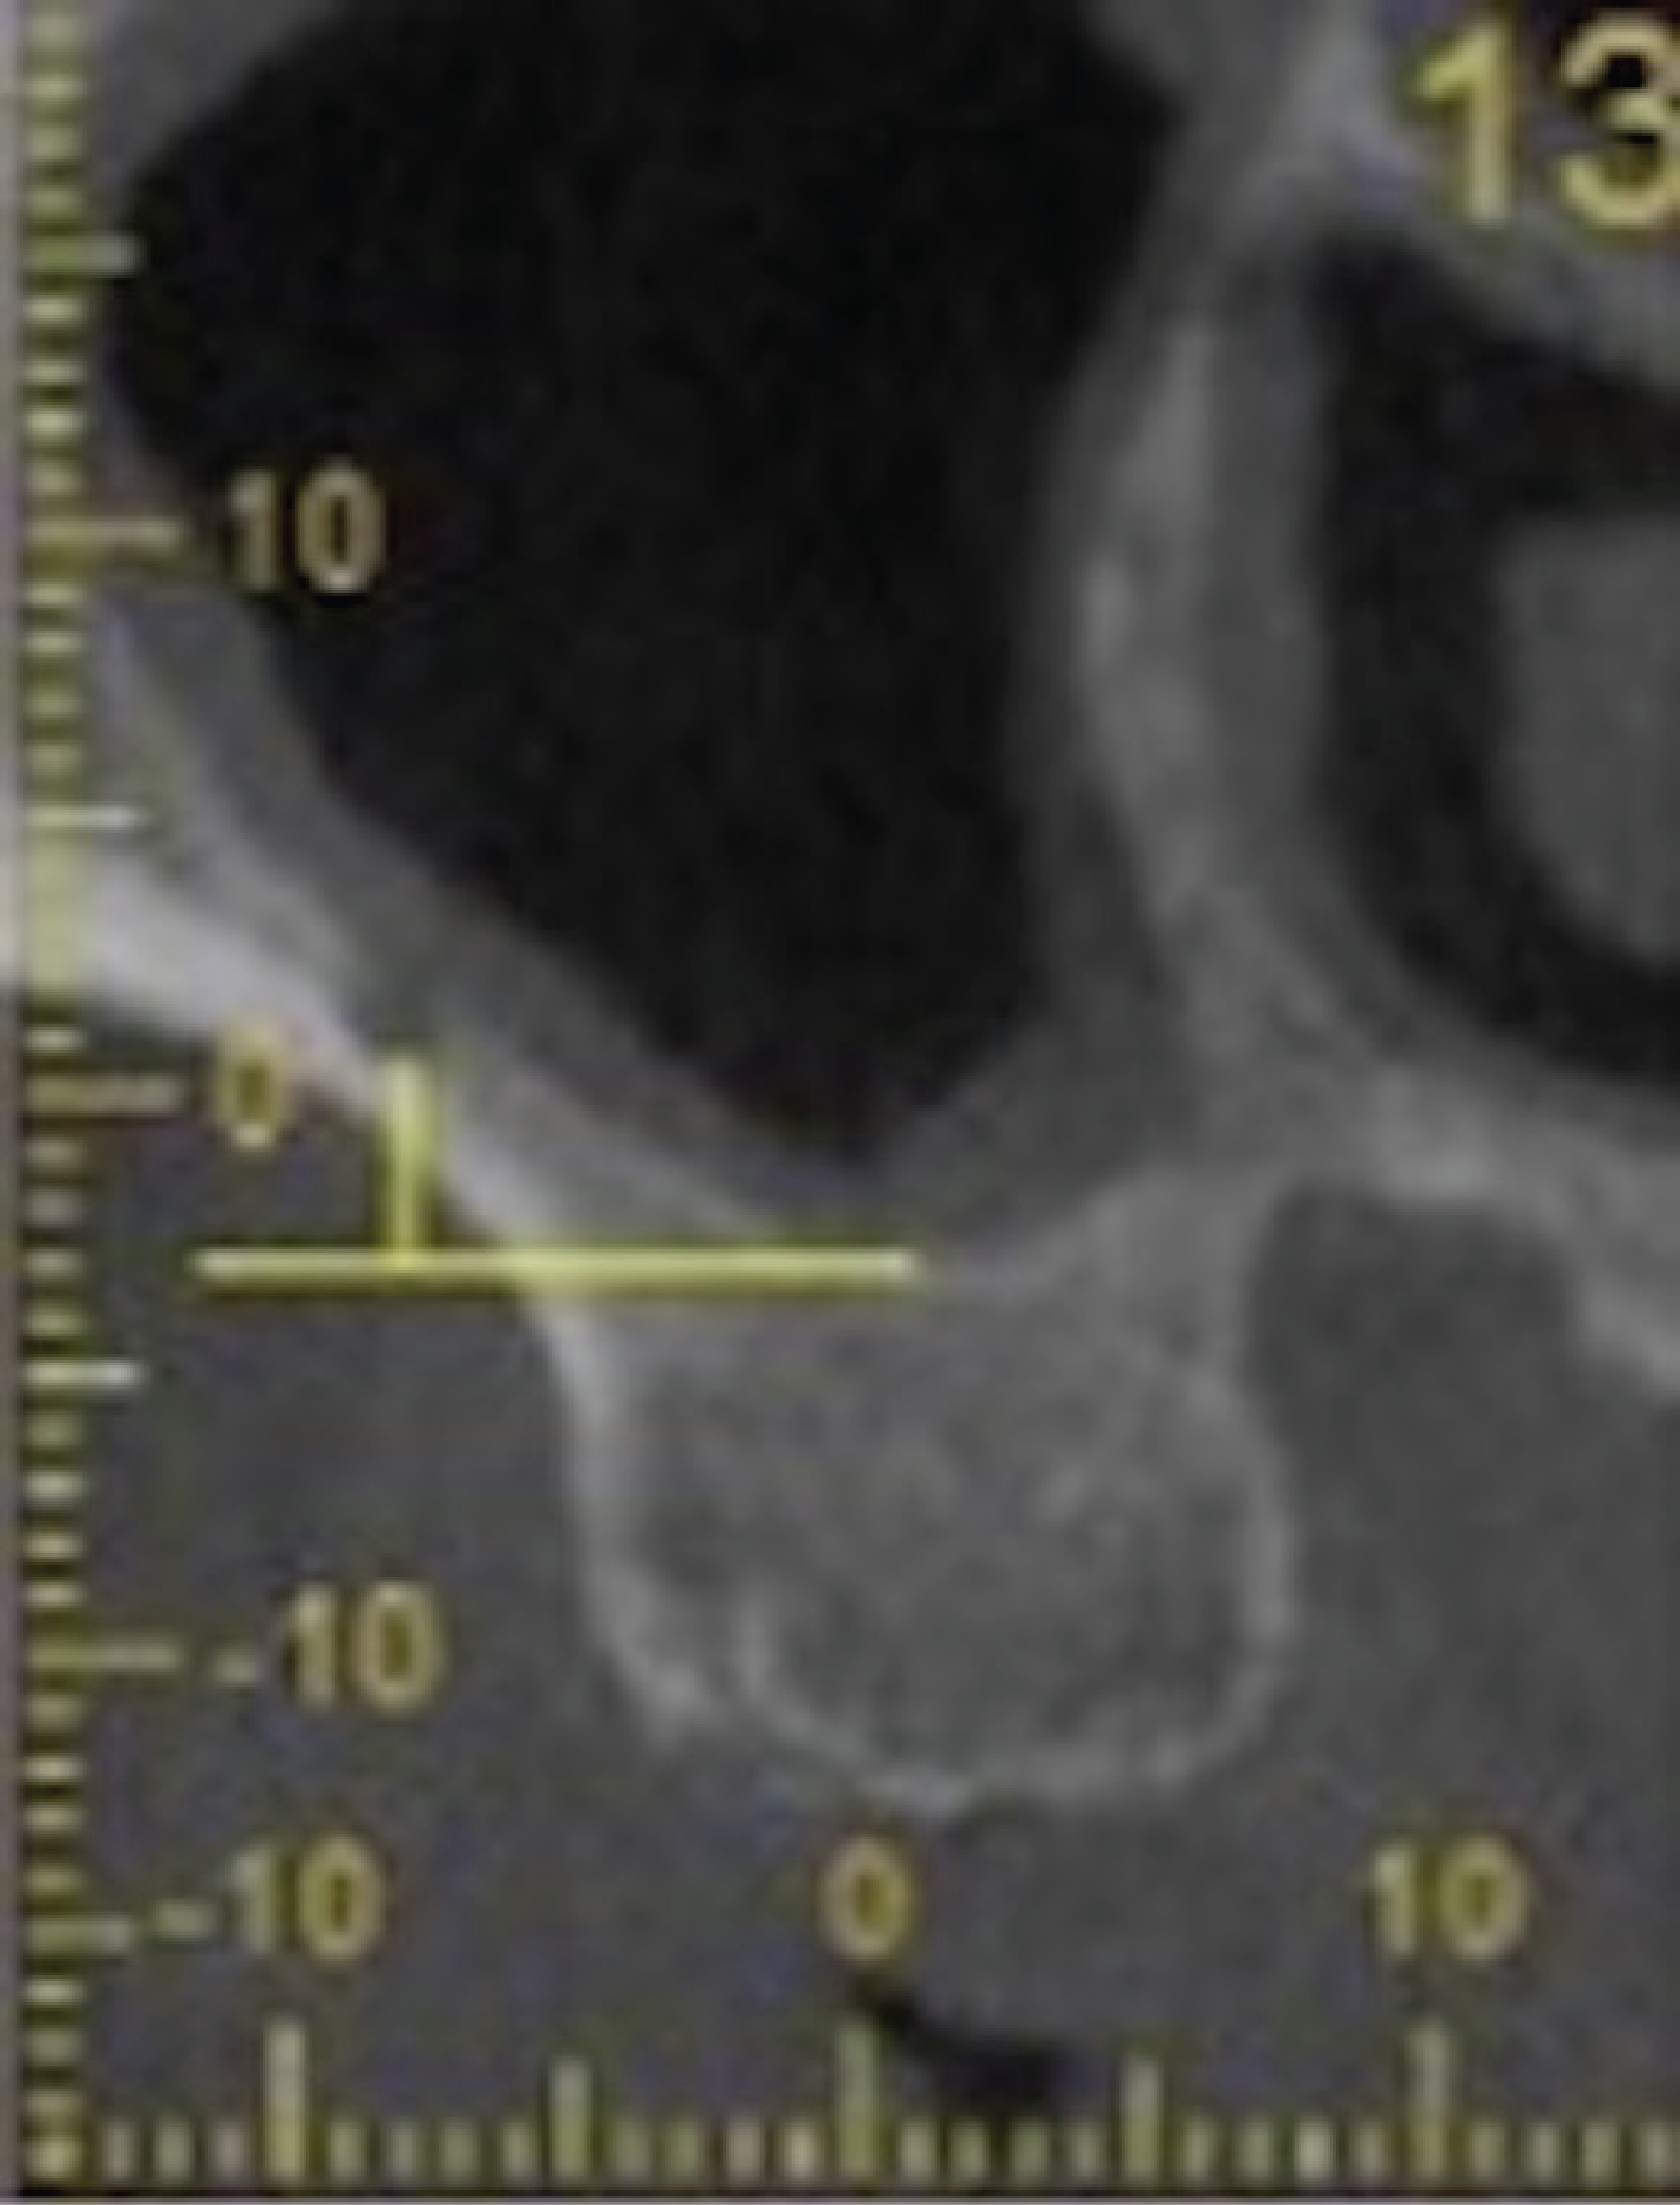
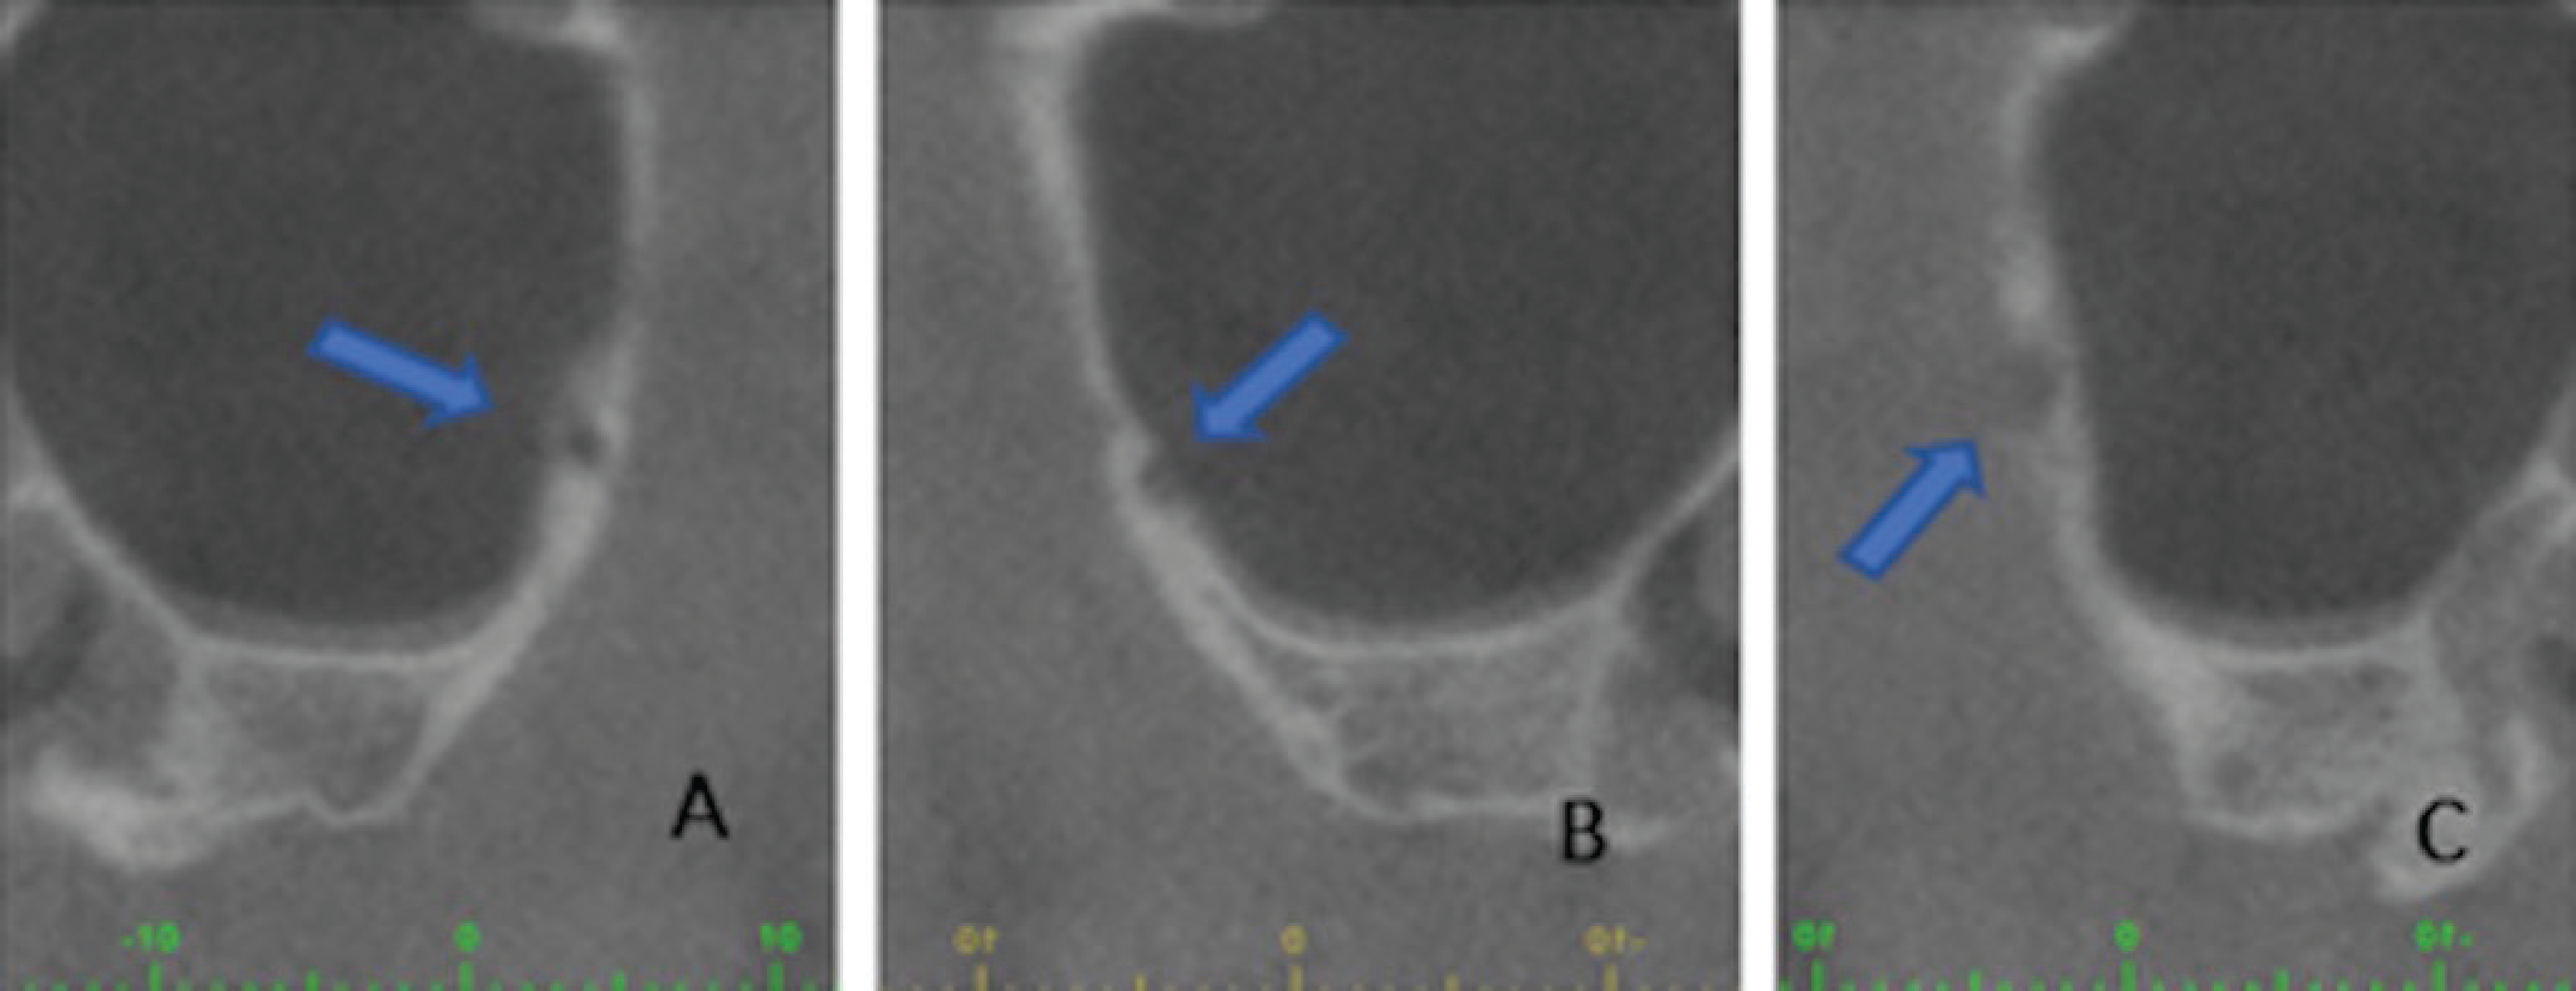
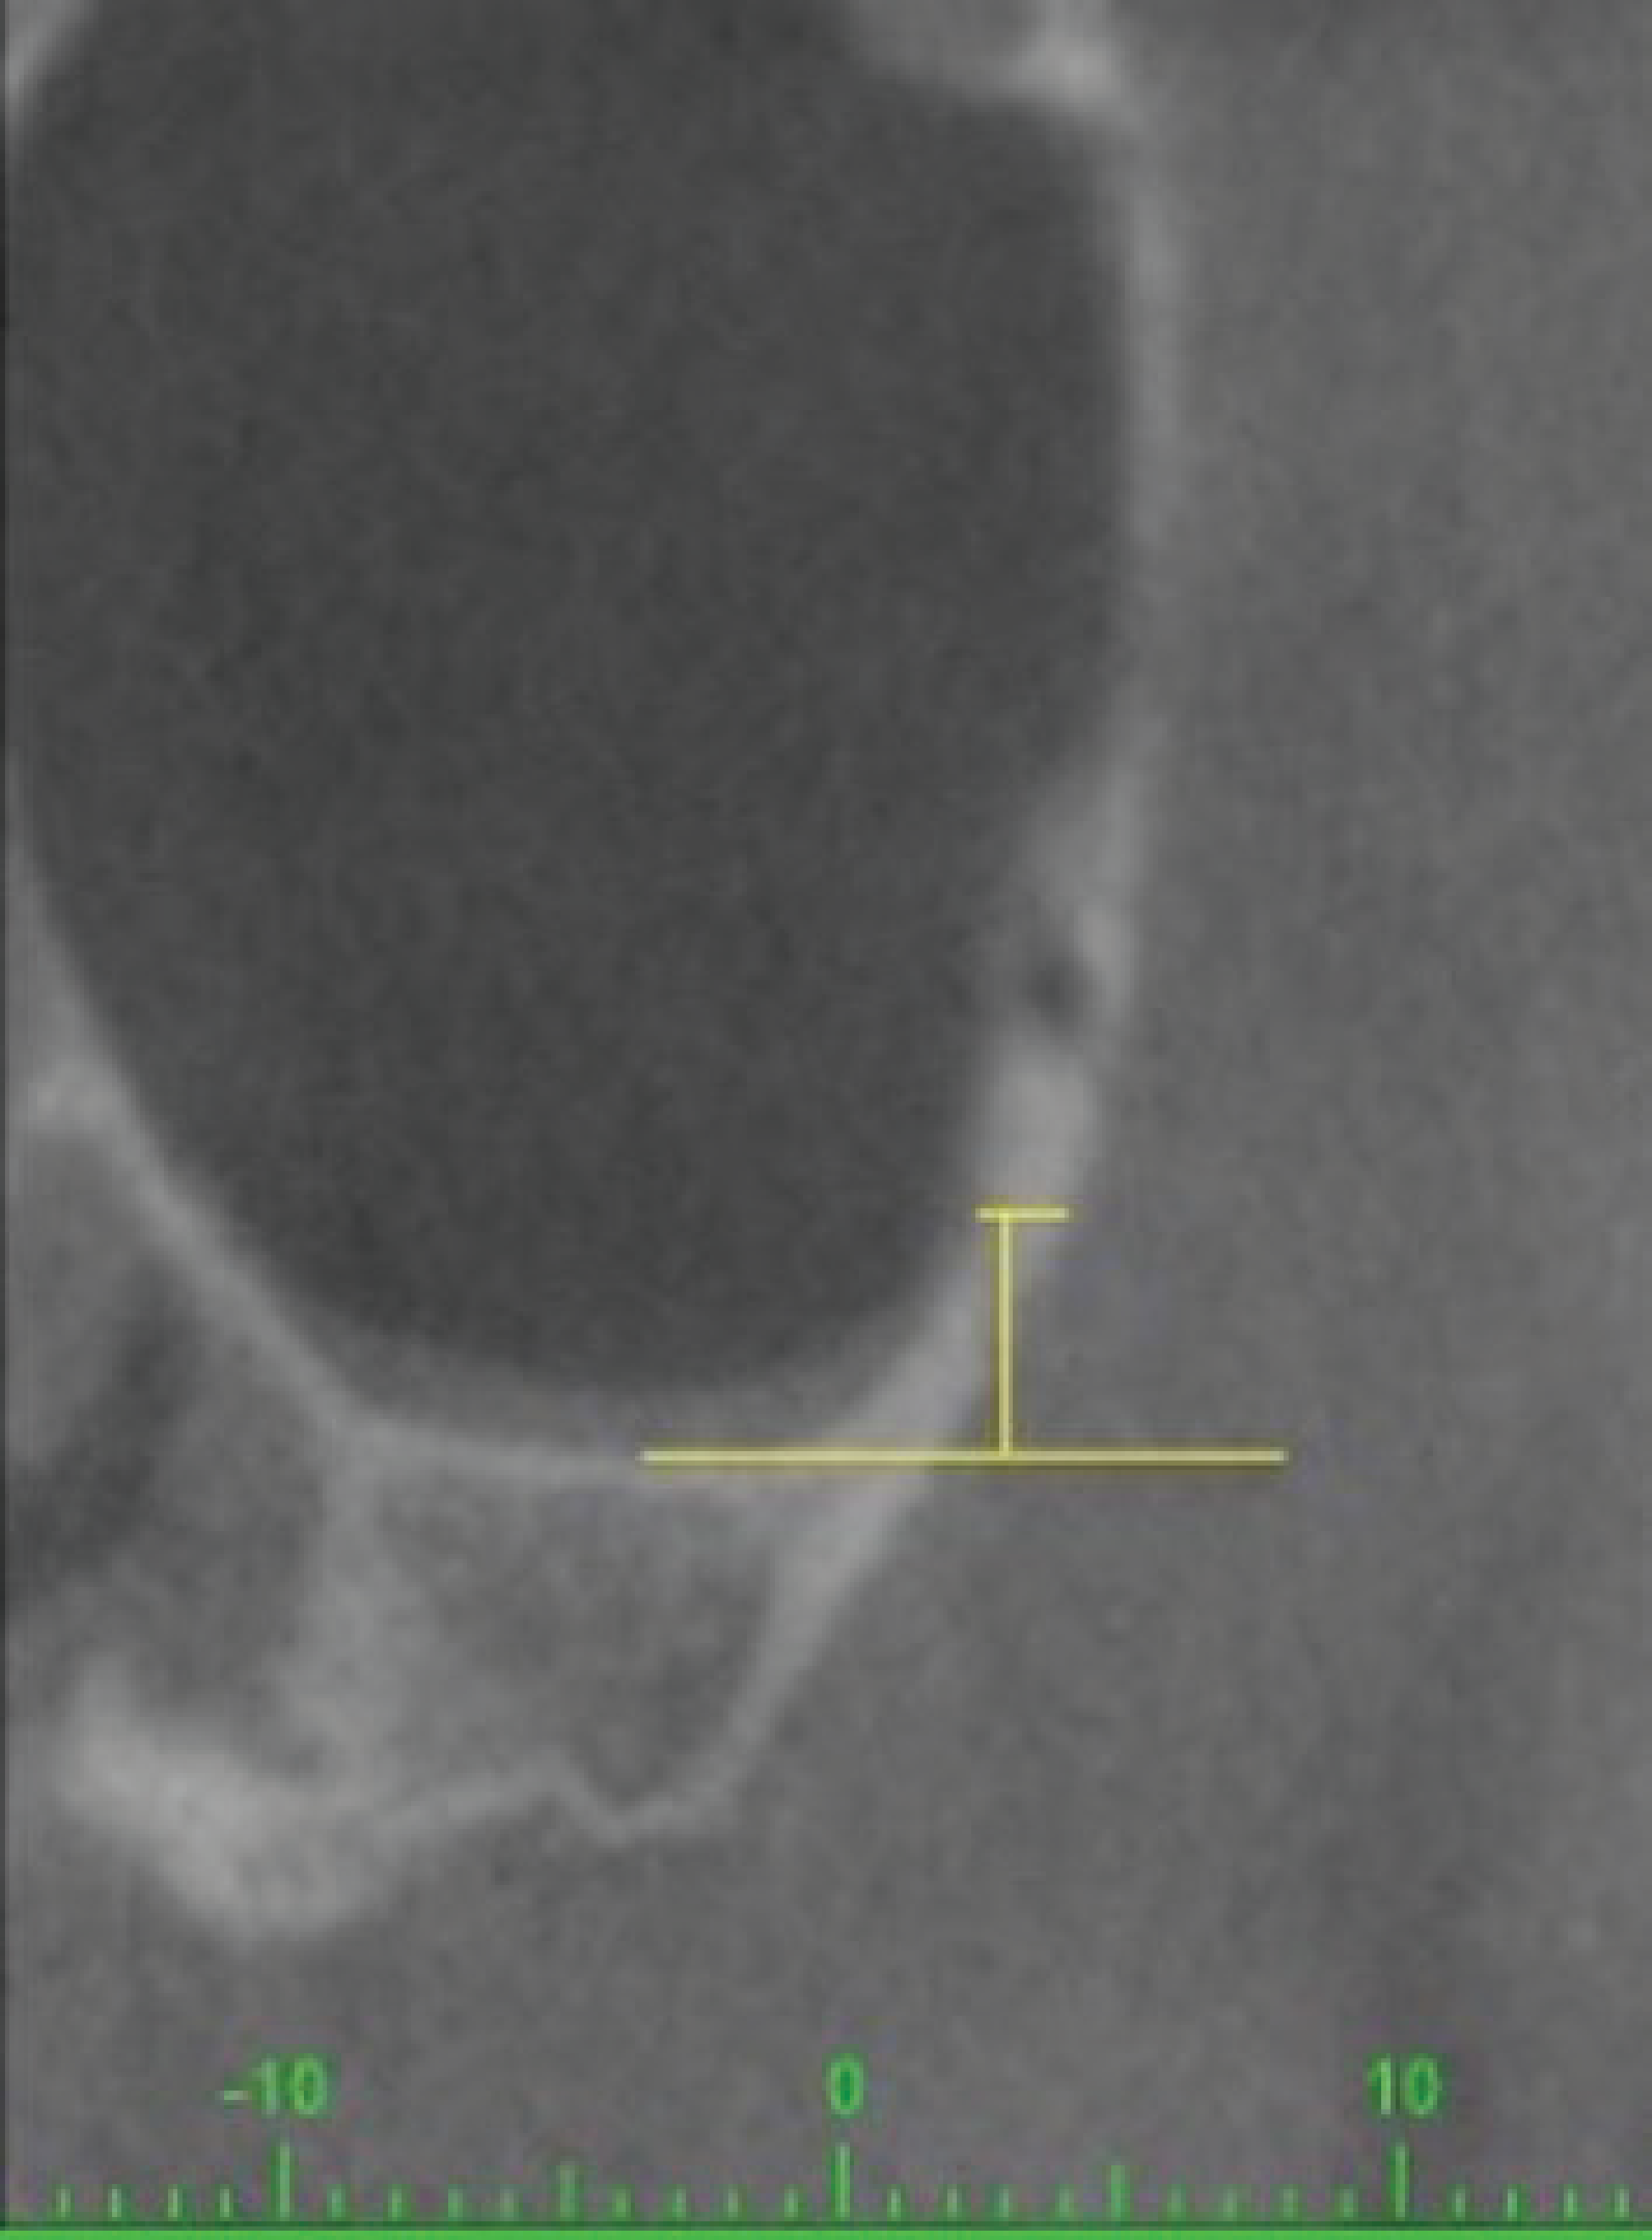
The following measurements were recorded from the right and left edentulous maxillary posterior region: (a) prevalence of PSAA (Table 1), (b) PSAA diameter which was classified into three groups—(i) <1 mm, (ii) 1–2 mm, (iii) >2 mm (Figure 1), (c) distance from the PSAA to the most inferior point in the floor of the sinus (Figure 2), (d) localization of the PSAA which was categorized into three groups—(i) intraosseous, (ii) submembranous (beneath the Schneiderian membrane), (iii) extraosseous (on the external cortex of the maxillary sinus lateral wall; Figure 3), (e) first detection point (FDP) and last detection point (LDP) of PSAA on coronal CBCT images (FDP was defined as the observation of PSAA in the most posterior border of the maxillary sinus and LDP was defined as the most anterior border of the maxillary sinus), (f) thickness of the maxillary sinus lateral wall which was divided into three groups—(i) 0–1 mm, (ii) 1–2 mm, (iii) >2 mm (Figure 4). Measurement of the thickness of the maxillary sinus lateral wall was performed 3 mm above the floor of the sinus.
Percentages of PSAA Localizations
Measurement of the PSAA Diameter
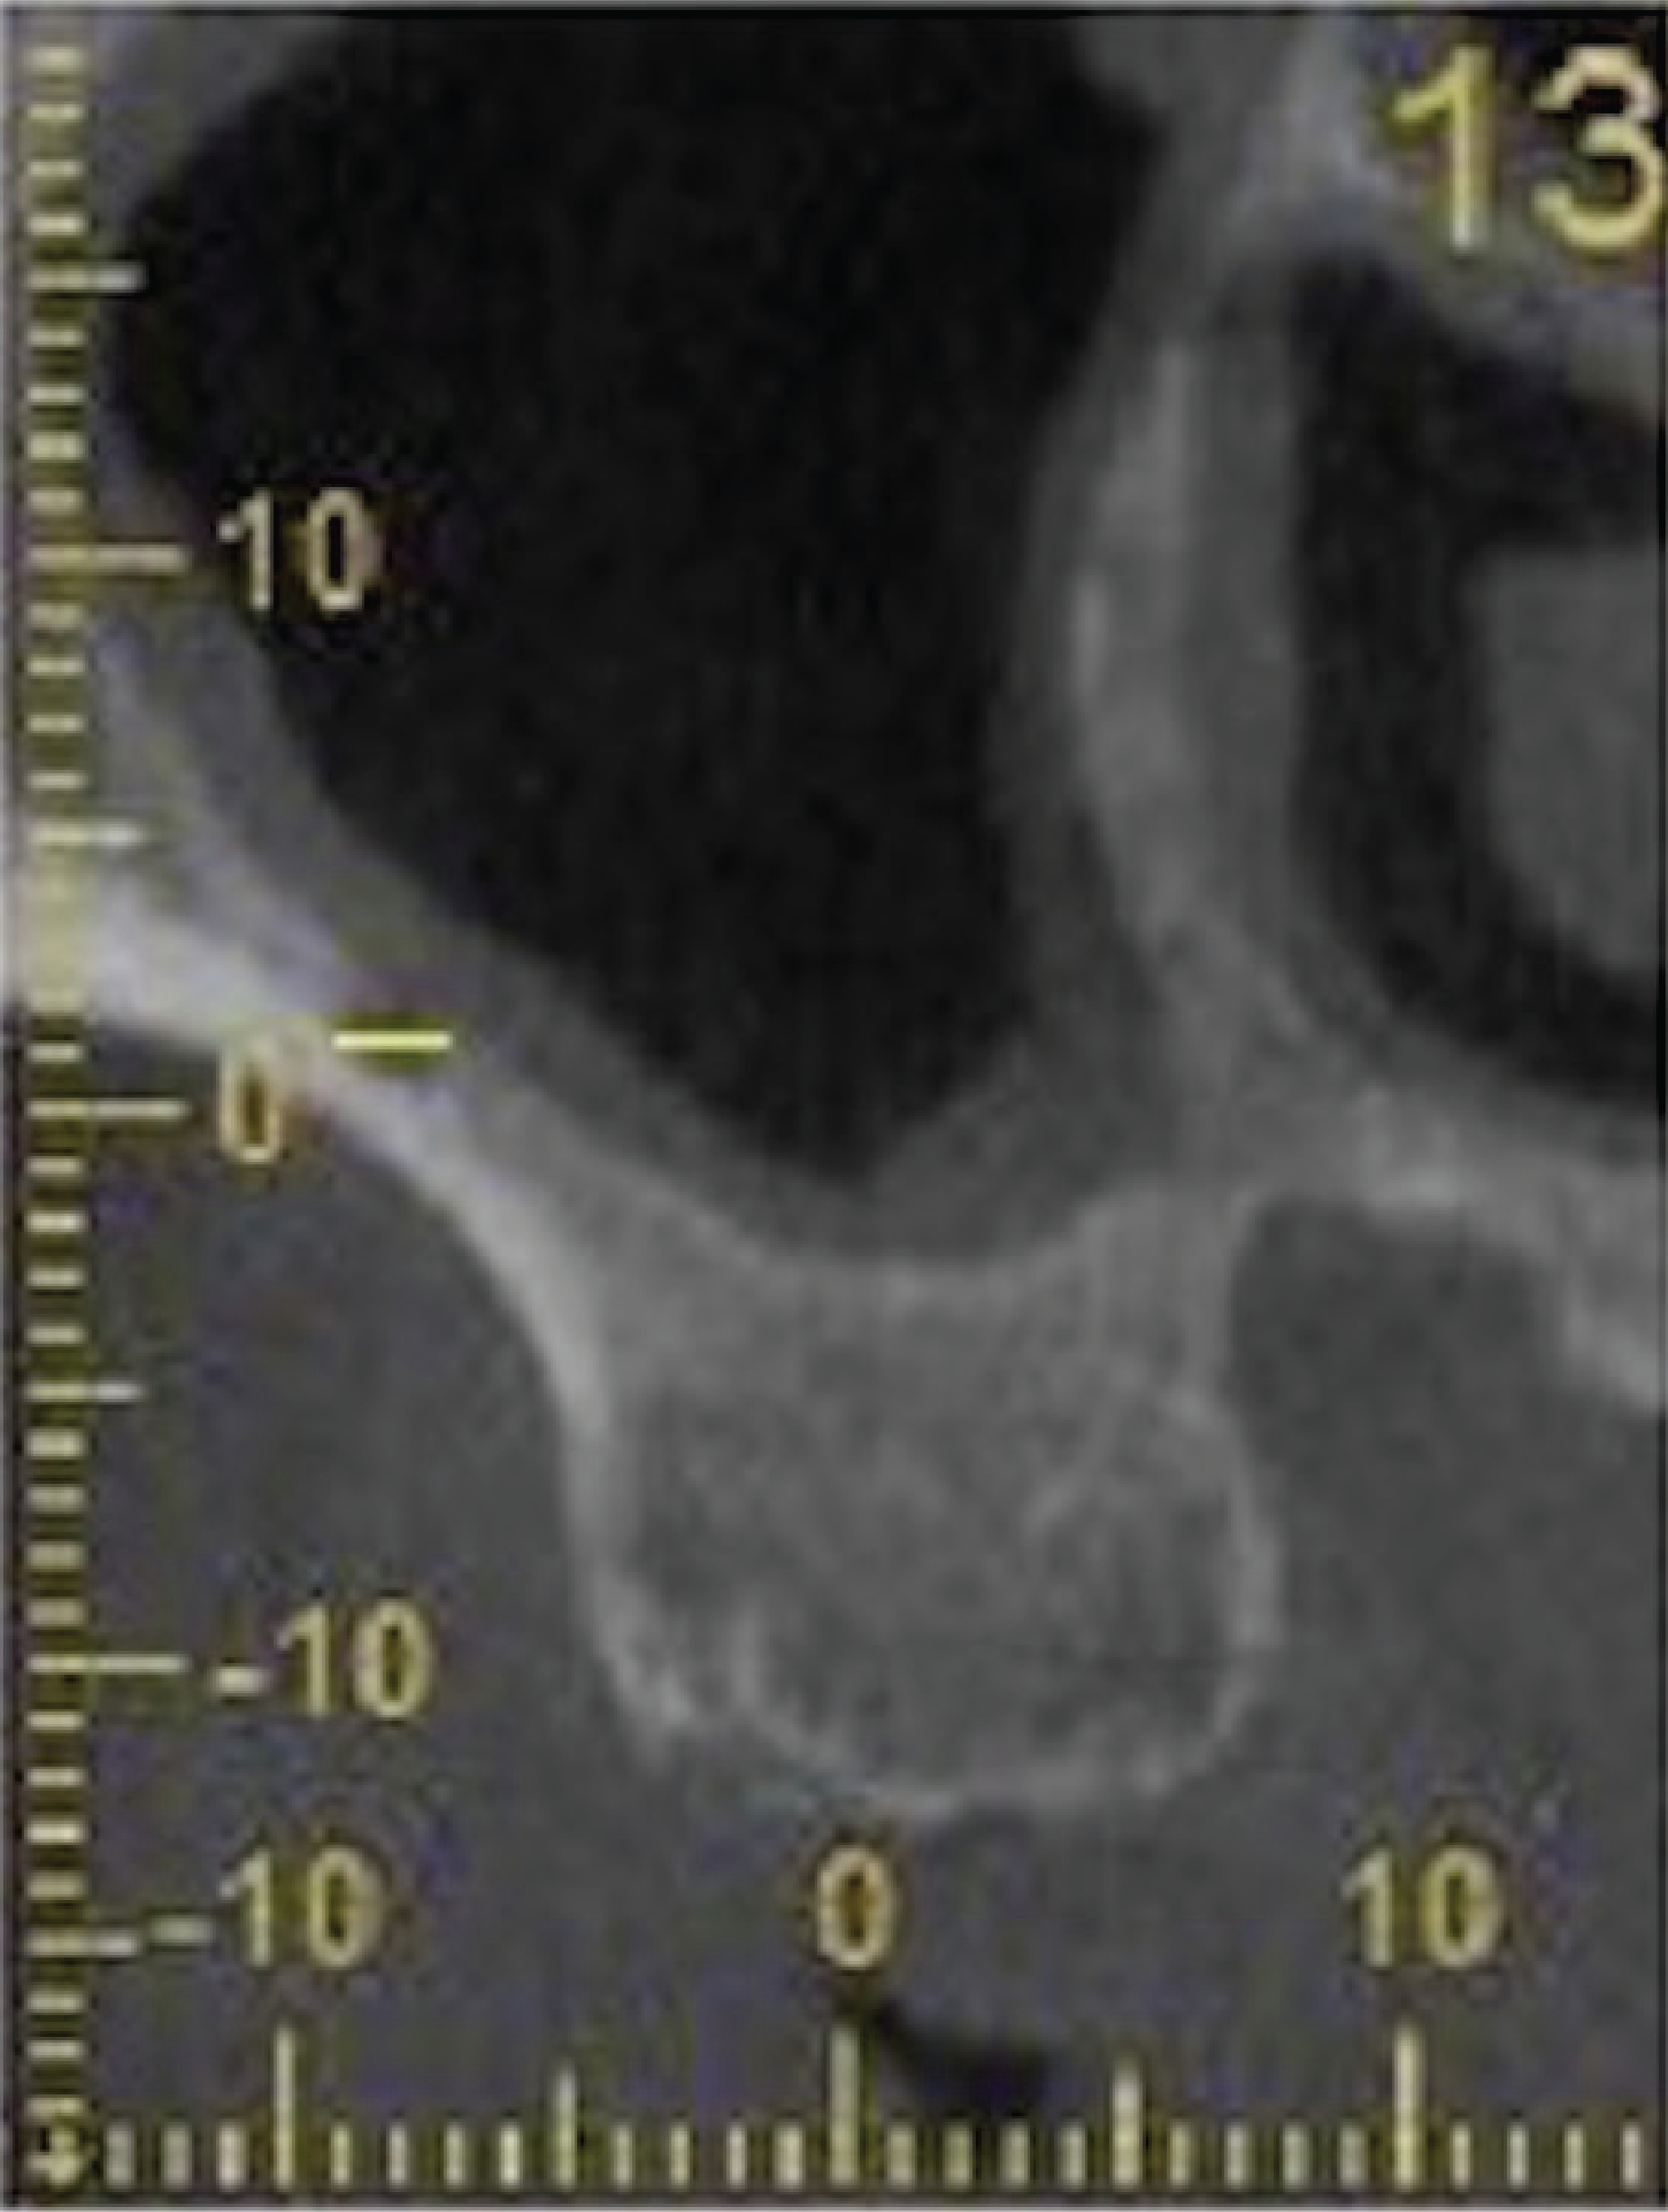
Distance between the PSAA and Floor of the Maxillary Sinus
Classification of the PSAA According to Localization: (A) Intraosseous, (B) Submembranous, (C) Extraosseous
Thickness of the Maxillary Sinus Lateral Wall 3 mm Above the Floor of the Sinus
All measurements were evaluated separately by two experienced specialists. The intra-class correlation coefficient was used to determine intra-operator reliability for measurements performed by the two researchers which yielded a 97.6% agreement rate.
Statistical data were analyzed using SPSS for Windows version 22 (IBM Corp. Released 2013. IBM SPSS Statistics for Windows, Version 22.0. Armonk, NY: IBM Corp.). Descriptive statistics (mean, standard deviation, frequency) were used for the analysis.
Results
In this study, 120 CBCT images of the PSSA from 60 patients comprising 32 (53.3%) men and 28 (46.7%) women were analyzed. The ages of the participants ranged between 26 and 76 years and the mean age was 54.48 ± 10.92 years. All the 60 CBCT images were obtained from maxillary posterior edentulous patients (with complete or partial edentulism). The PSAA was detected on the right side in 95% of the CBCT scans and on the left side in 85% of the maxillary sinuses. In total, the PSAA was detected in 108 (90%) of the 120 CBCT images while the PSAA was not observed in 12 (10%) of the CBCT images (Table 1).
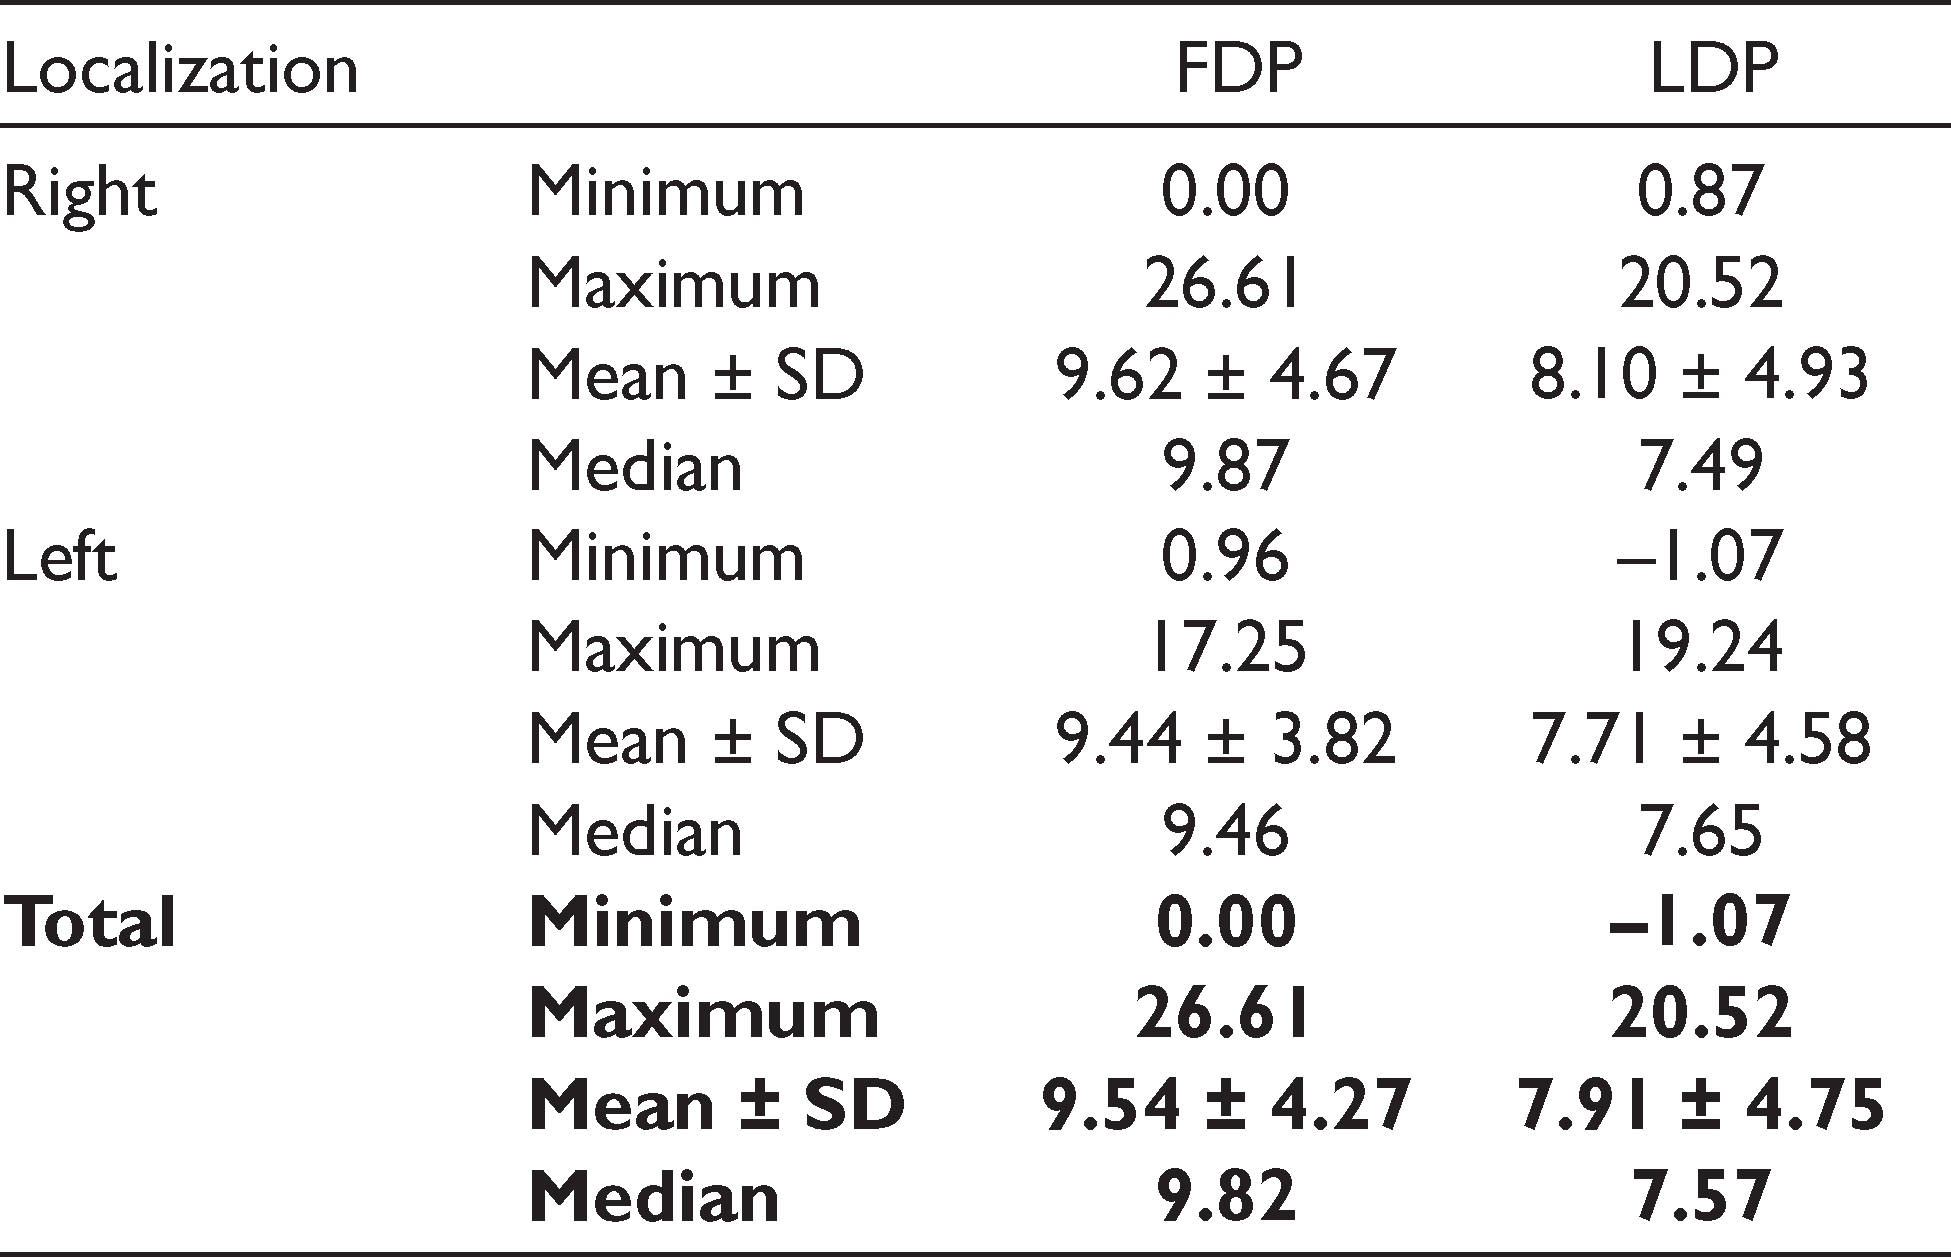
At the FDP, the distance between the inferior border of the PSAA and the floor of the sinus ranged between 0 mm and 26.61 mm. The mean and median values were 9.54 ± 4.27 mm and 9.82 mm, respectively. At the LDP, the distance between the PSAA and the floor of the sinus ranged between –1.07 mm and 20.52 mm, with a mean and a median value of 7.91 ± 4.75 mm and 7.57 mm, respectively (Table 2).
Distance between PSAA and the Floor of the Maxillary Sinus (mm)
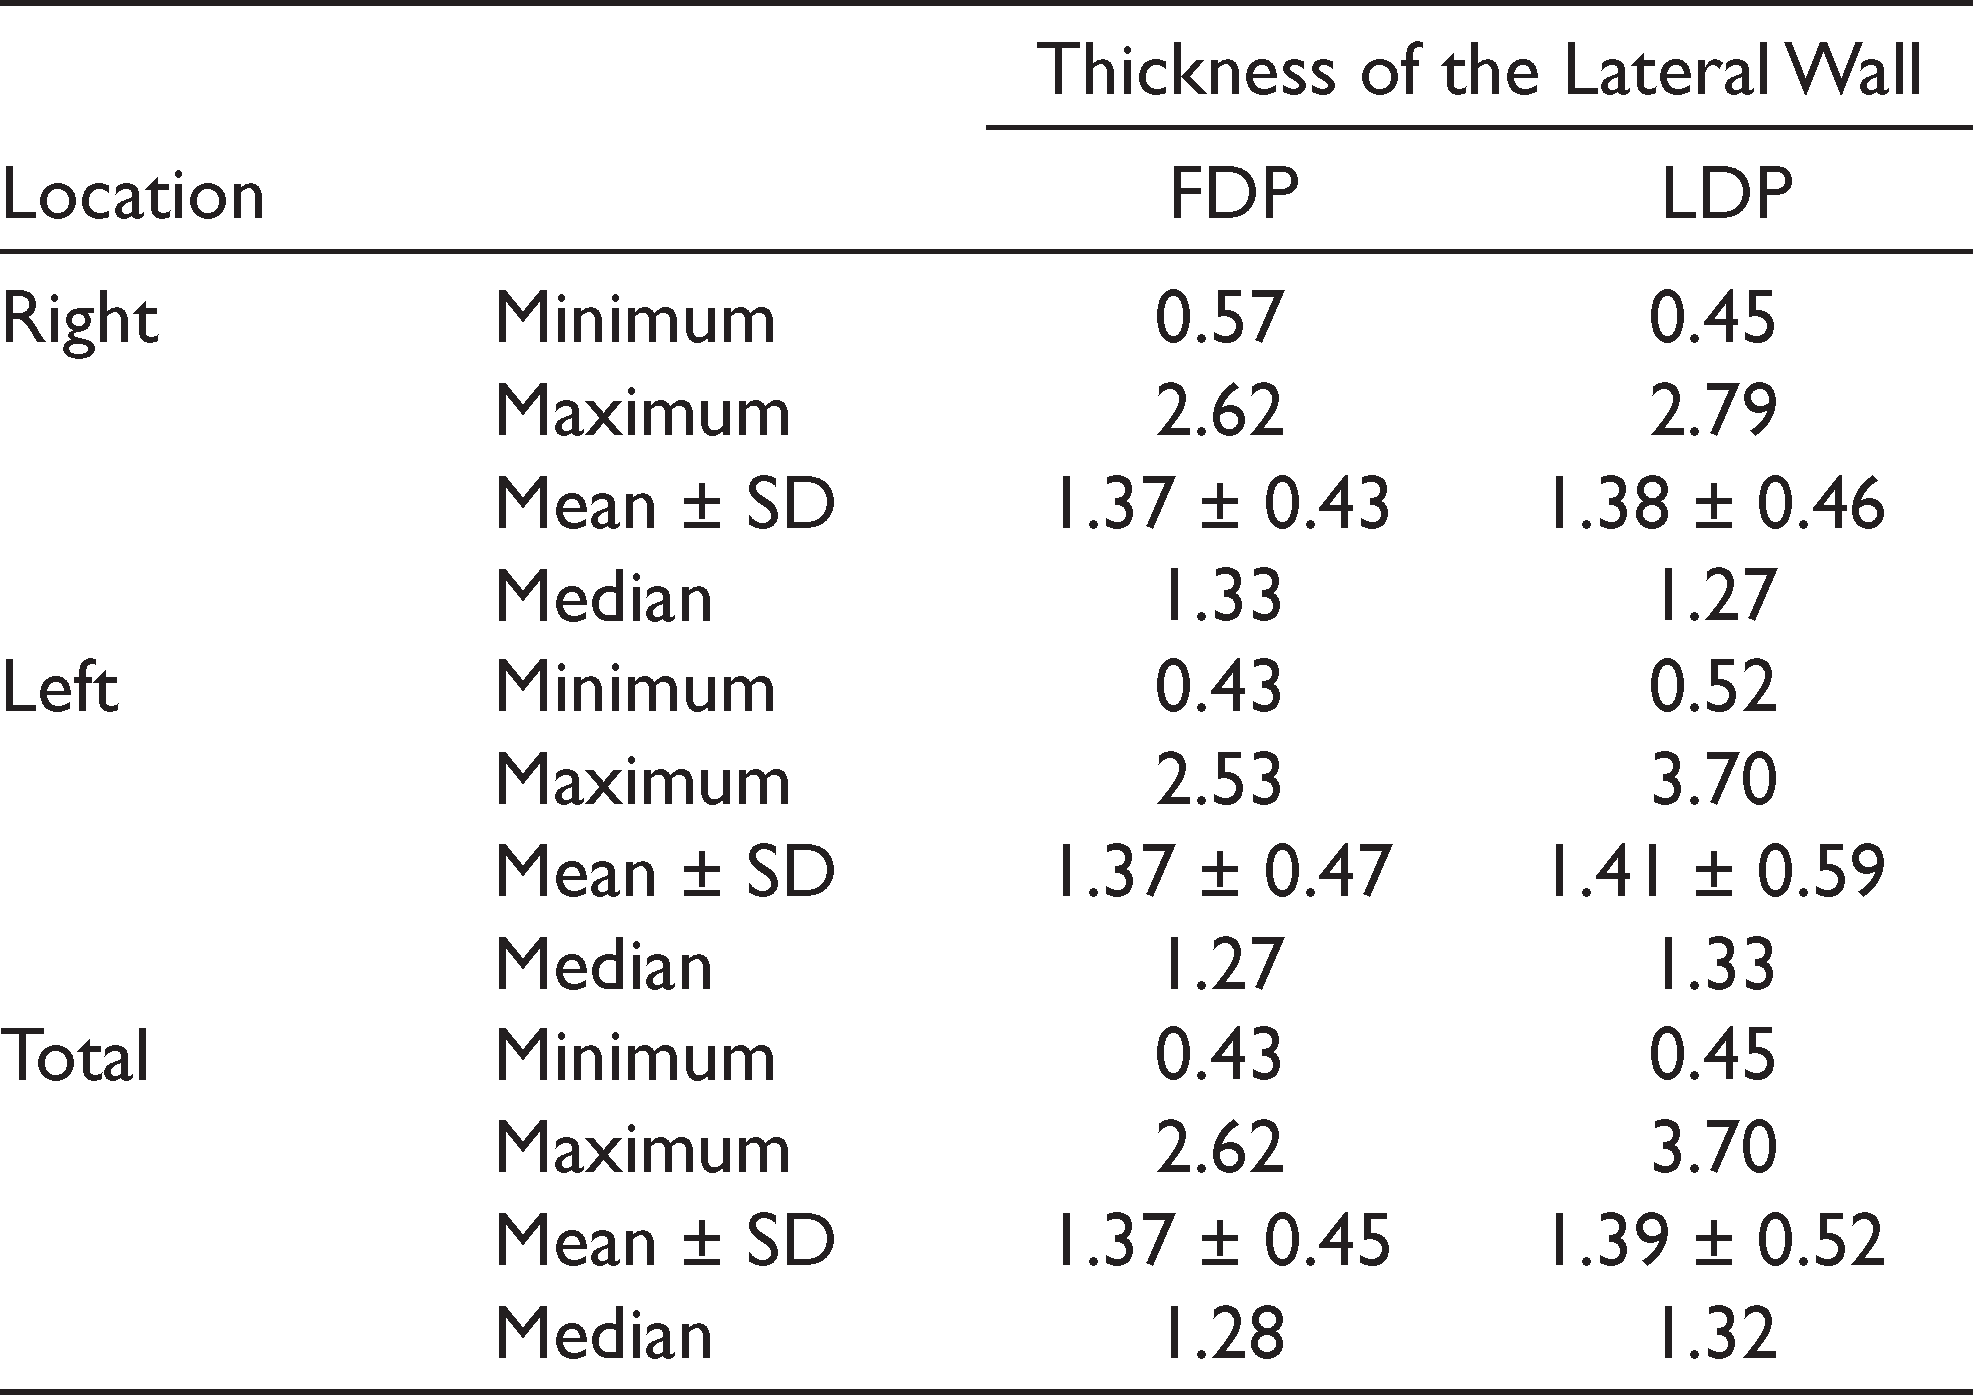
At the FDP, the thickness of the lateral sinus wall was 0–1 mm in 19.4% (n = 21), 1–2 mm in 69.4% (n = 75) and >2 mm in 11.1% (n = 12) of the images. In LDP, the thickness of the lateral sinus wall was 0–1 mm in 18.5% (n = 20), 1–2 mm in 74.1% (n = 80), and >2 mm in 7.4% (n = 8) of the images (Table 3). At the FDP, the thickness of the lateral sinus wall ranged between 0.43 mm and 2.62 mm and the mean and median values were 1.37 ± 0.45 mm and 1.28 mm, respectively. At the LDP, the thickness of the lateral sinus wall ranged between 0.45 mm and 3.7 mm and the mean and median values were 1.39 ± 0.52 mm and 1.32 mm, respectively (Table 4).
Distribution of the Thickness of the Maxillary Sinus Lateral Wall
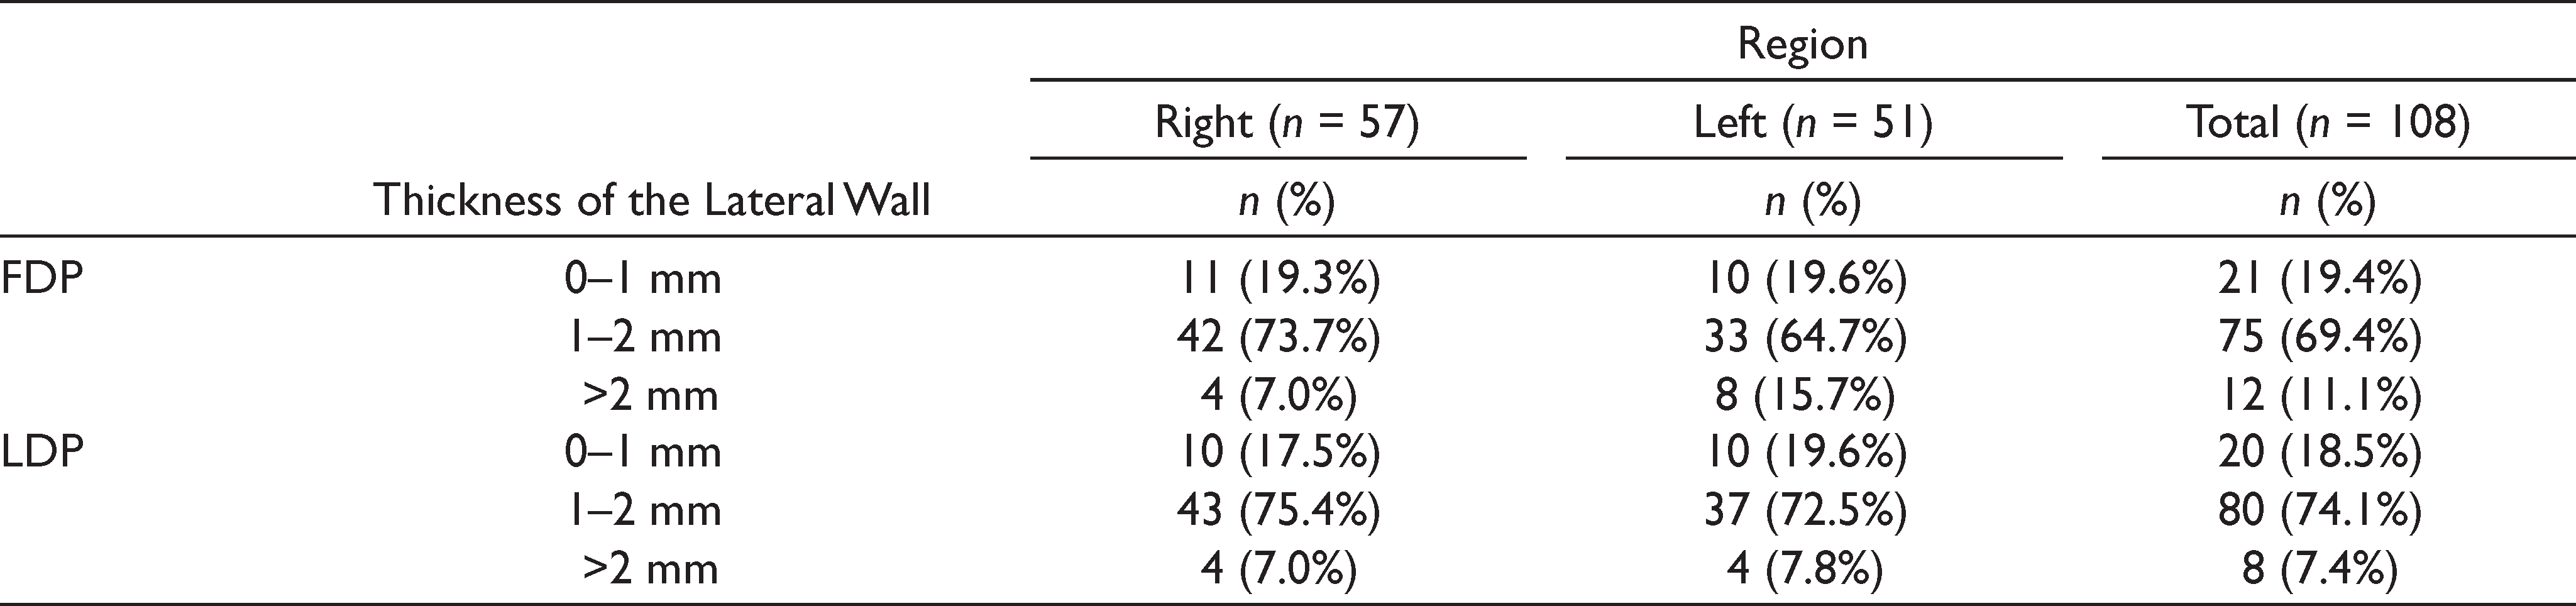
Thickness of the Maxillary Sinus Lateral Wall
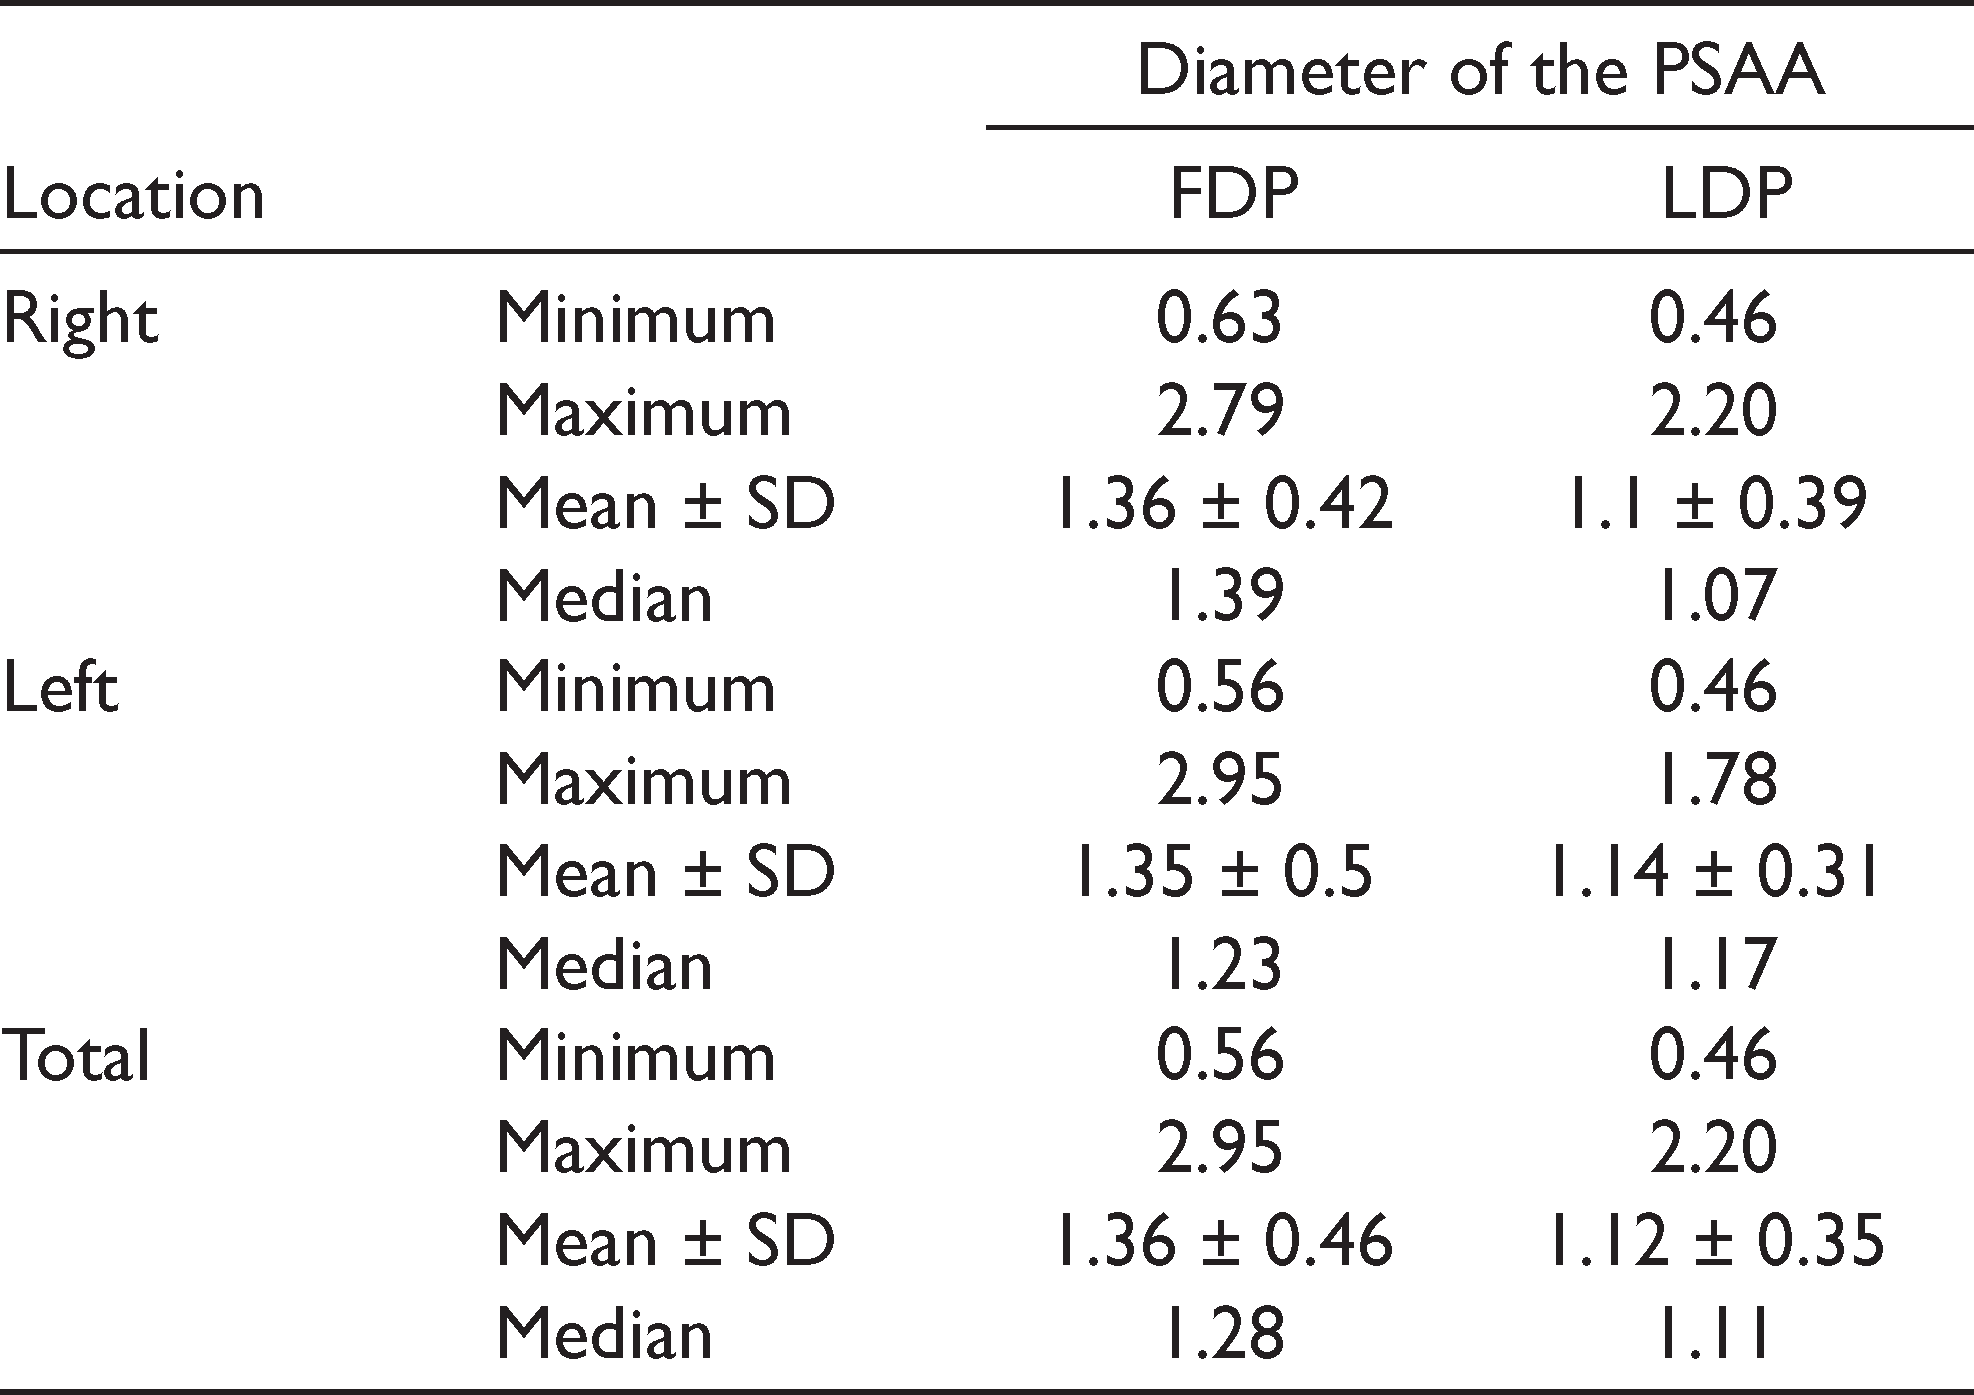
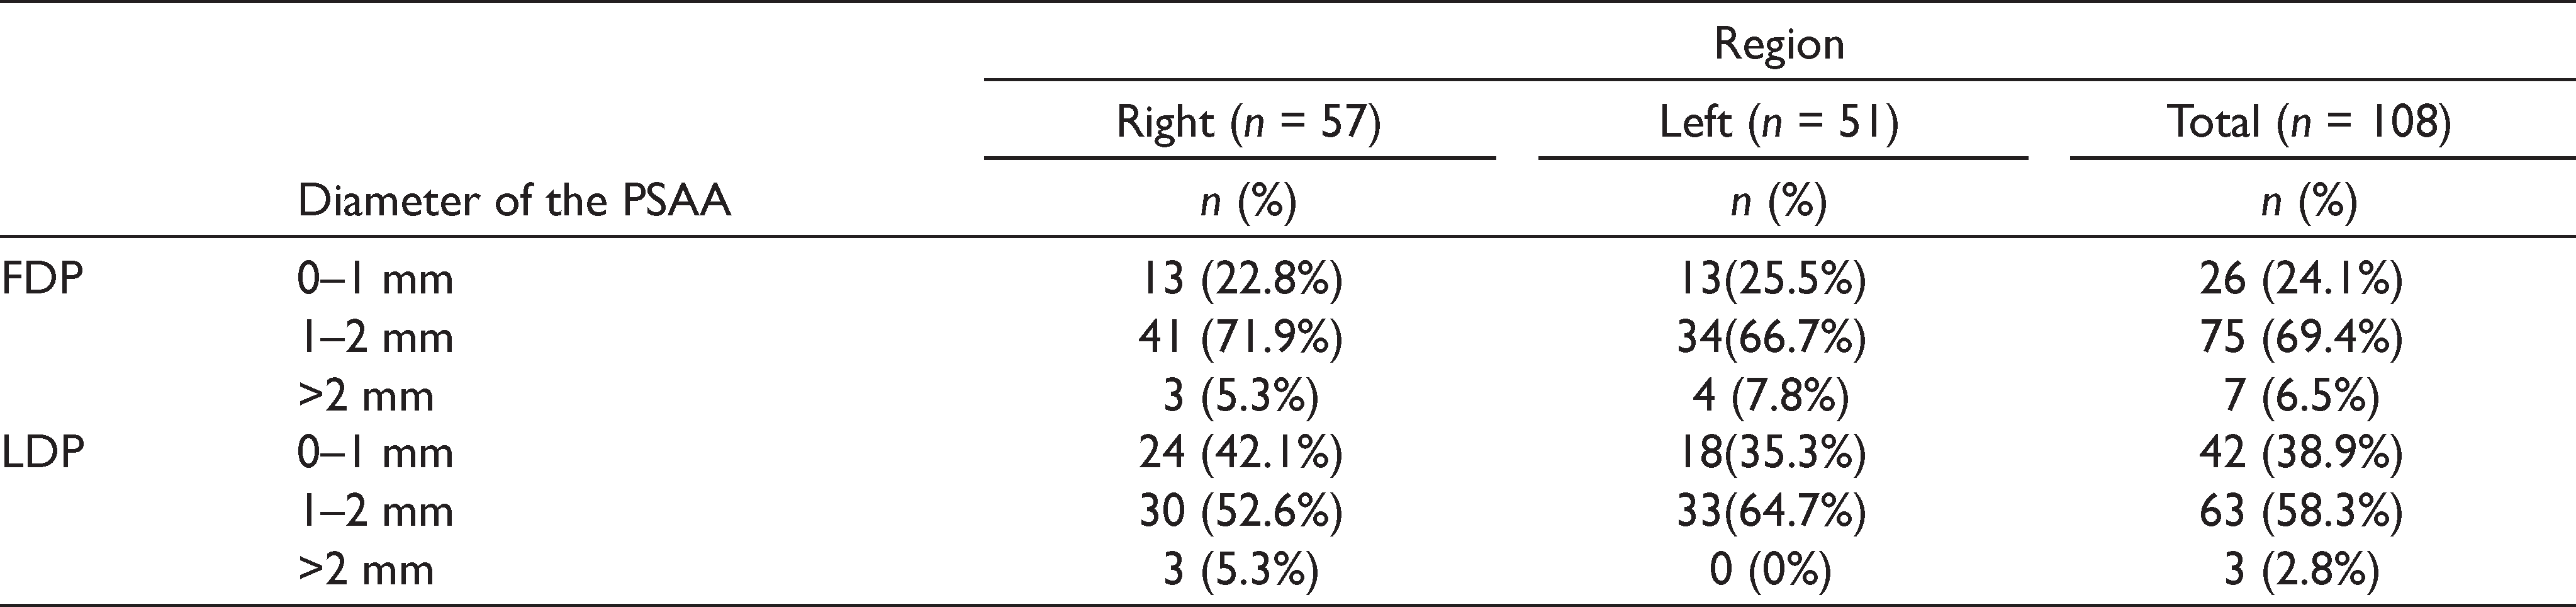
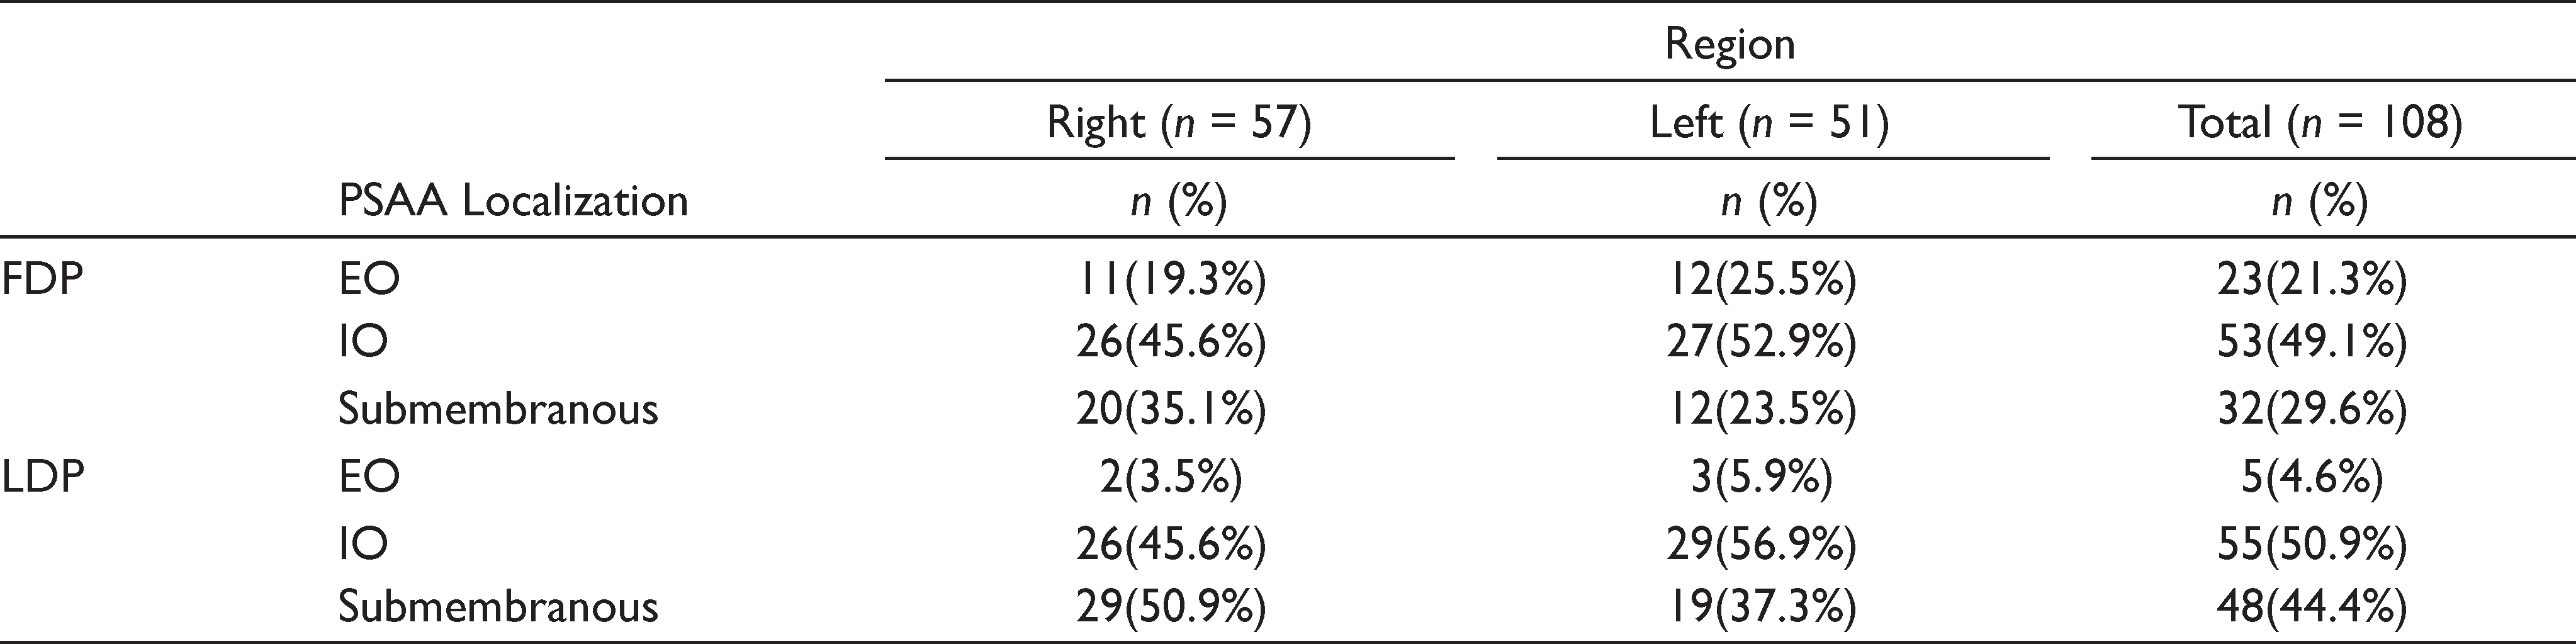
The diameter of PSAA ranged between 0.56 and 2.95 mm at FDP and between 0.46 and 2.20 mm at LDP, respectively. The mean diameters of the PSAA at the FDP and LDP were 1.36 ± 0.46 mm and 1.12 ± 0.35 mm, respectively. While the diameters of the PSAA at the FDP were found to be 0–1 mm, 1–2 mm, and >2 mm in 24.1%, 69.4%, and 6.5% of the cases, respectively, these percentages at the LDP were 38.9%, 58.3%, and 2.8%, respectively (Tables 5 and 6) . The localization of the PSAA was intraosseous, extraosseous, and sub-membranous in 49.1%, 21.3%, and 29.6% of the cases at FDP and in 50.9%, 4.6%, and 44.4% of the cases at LDP, respectively (Table 7).
The Diameter of PSAA (mm)
Distribution of PSAA Diameter
Distribution of PSAA According to Localization
Discussion
In sinus floor elevation surgery with a lateral approach, preoperative three-dimensional radiological evaluation can prevent iatrogenic complications.16,17 Varela et al. reported that PSAA was detected more frequently and more effectively on CBCT compared with computed tomography (CT) in preoperative evaluations. 18 Likewise, over 60% of the images examined by CBCT were observed to have a PSAA of <1 mm in diameter, which is higher than CT-examined sinuses.18–20 This suggests that a CT cannot detect vessels of less than 1 mm as clearly as CBCT. The prevalence of PSAA on CT scans as conducted by Elian et al., 21 Mardinger et al., 12 Rosano et al., 22 Kim et al., 23 and Güncü et al. 24 was found to be 52.9%, 55%, 47%, 52%, and 64.5%, respectively. In contrast, the prevalence of PSAA on the CBCT examination was reported by Tehranchi et al., 25 Anamali et al., 26 Ilgüy et al., 27 and Kang et al. 19 as 87%, 94.4%, 75.9%, and 90%, respectively. In this study, the percentage of PSAA observed on CBCT scans was 90% and was similar to the CBCT studies mentioned in Table 1. The reason as to why CBCT results are higher than the CT results may be due to the higher resolution of CBCT, the specialization and/or experience of the examiners, the methodology applied, and whether dentulous or edentulous patients are included in the study as well as sample size.25,28,29
The quantity of the alveolar bone is expected to reduce after tooth extraction in the posterior maxilla. Furthermore, the alteration in the alveolar crest is expected to be much greater than in the maxillary sinus floor. Therefore, measurements are likely to be more reliable for the evaluation of the location of the PSAA when the floor of the sinus is used as a reference point. Determination of the PSAA concerning the floor of the maxillary sinus is crucial due to the planning of the lateral window for sinus floor elevation to prevent bleeding complications. Watanabe et al. stated that the distance between the PSAA and the floor of the maxillary sinus at the first premolar (P1) region was 10.4 ± 6.0 mm, 10.4 ± 6.2 mm at the second premolar (P2) region, 9.0 ± 5.1 mm at the first molar (M1) region, and 8.5 ± 4.3 mm at the second molar region (M2). 30 The authors also reported that there were no significant differences between these anatomic locations although the distances were shorter at M1 and M2 than at P1 and P2. 30 Ilguy et al. 27 reported that the distance between PSAA and the floor of the maxillary sinus was found to be 8.66 mm in males and 9.29 mm in females. Güncü et al. 24 detected that this distance was 7.8 ± 0.3 mm. Pandharbale et al. 28 stated that the distance between the PSAA canal/notch and the floor of the maxillary sinus in the left first and second molar regions was 10.48 ± 3.21 mm and 9.49 ± 3.12, respectively, and was shortest in the second molar region. In this study, the mean distance from the PSAA to the floor of the sinus was 9.54 ± 4.27 mm at the FDP and 7.91 ± 4.75 mm at the LDP. Although the mean distance between the PSAA and the floor of the sinus was similar in all the previous studies, this study revealed that the PSAA was located higher at the FDP when compared to the LDP. It is assumed that different measurement methods may lead to distinctive results. Although the measurement locations were generally in the region of the premolar and molar teeth in other studies, the first and last observations of the PSAA on the coronal section were taken as the reference points in this study.
The thickness of the maxillary sinus lateral wall may increase the risk of perforation of the Schneiderian membrane. When the lateral wall of the sinus is thick, a lateral approach to sinus floor elevation becomes more difficult and prolongs surgical intervention. 31 Zijderveld et al. 32 reported that the most common intraoperative complication in sinus floor elevation operations was the perforation of the sinus membrane. Accordingly, we consider that it is important to evaluate the thickness of the lateral sinus wall before surgical treatment to preserve the integrity of the sinus membrane during surgical intervention.
Danesh-Sani et al. 33 reported that the average thickness of the lateral sinus wall was relatively higher in dentulous patients. Similarly, Monje et al. stated that the lateral wall of the sinus was thinner in the edentulous region.31,34–37 On the other hand, Khajehahmadi et al. 31 reported that there was no significant difference between dentulous and edentulous patients, although there was a tendency to greater thickness in the lateral wall in dentulous patients. Kang et al. 19 stated that the mean lateral wall thickness measured at 3 mm above the floor of the sinus was 1.67 mm. In this study, the mean value and the distribution of lateral wall thickness were analyzed at the FDP and LDP. At the FDP, the mean value was 1.37 ± 0.45 mm and 69.4% of cases had a thickness of between 1 mm and 2 mm. At the LDP, the mean thickness was 1.39 ± 0.52 mm and 74.1% of cases had a thickness of between 1 mm and 2 mm. Additionally, most of the cases had a lateral bone thickness of between 1 mm and 2 mm, and cases with a lateral thickness of over 2 mm that were detected at FDP and LDP accounted for only 11.1% and 7.4% of patients, respectively. Nevertheless, lateral bone thickness in dentulous and edentulous patients was not compared in this study.
The diameter of PSAA is important in evaluating the risk of severe intraoperative hemorrhage. In general, a PSAA with a diameter of more than 2 mm causes non-life-threatening bleeding complications, although it prolongs the operation time and makes the intervention more difficult. In this study, the diameters of the PSAA at the FDP were <1 mm, 1–2 mm, and >2 mm in 24.1%, 69.4%, and 6.5%, respectively. At the LDP, these percentages were 38.9%, 58.3%, and 2.8%, respectively. Chitsazi et al. 2 reported that the diameters of the PSAA were <1 mm, 1–2 mm, and >2 mm in 30.2%, 59.1%, and 10.5%, respectively. Tehranchi et al. 25 found that the diameters of the PSAA were 0–1 mm in 20.7%, 1–2 mm in 74.8%, and >2 mm in 4.5% of all cases, respectively. Mardinger et al. 12 stated that only 6.7% of PSAA had a diameter of >2 mm. Apostolakis and Bisson reported that the diameter of PSAA was >2 mm in 4% of cases. 35 Rosano et al. 3 and Danesh-Sani et al. 33 reported this rate as 6.7% and 6.4%, respectively. These results are similar to the findings observed at FDP in this study. The percentage of PSAA with a diameter of >2 mm was lower at the LDP (2.8%) than the measurements reported in the literature. We consider that these discrepancies may be related to the measurement locations.
In our study, the mean diameters of the PSAA at the FDP and LDP were 1.36 ± 0.46 mm and 1.12 ± 0.35 mm, respectively. Chitsazi et al. 2 , Güncü et al., 24 and Kim et al. 23 stated that the mean diameters of the PSAA were 1.37 ± 0.44, 1.3 ± 0.5, and 1.52 ± 0.47 mm, respectively, which were consistent with the results obtained in this study. Tehranchi et al. 25 reported that the mean diameter of PSAA was 1.2 ± 0.37 mm in females and 1.38 ± 0.35 mm in males. Nevertheless, Ilguy et al. 27 stated that the mean diameter of the PSAA was 0.94 ± 0.26 mm and that 68.9% of the PSAA had a diameter of <1 mm. Güncü et al. 24 reported that there was no statistically significant correlation between age and the diameter of the PSAA at both right and left sides. Additionally, Chitsazi et al., 2 Mardinger et al., 12 and Beretta et al. 38 stated that there was no correlation between gender and the diameter of the PSAA.
In this study, the PSAA localization was divided into three groups: (a) intraosseous, (b) extraosseous, and (c) submembranous. At the FDP, the prevalence of intraosseous, extraosseous, and submembranous localizations was 49.1%, 21.3%, and 29.6%, respectively. Similarly, these percentages were found to be 50.9%, 4.6%, and 44.4% at the LDP, respectively. In both locations, the intraosseous type was observed as the most frequent type. The prevalence of extraosseous location of PSAA was 4.6 times higher at FDP (21.3%, n = 23) compared to LDP (4.6%, n = 5). The sub-membranous location of the PSAA was higher at the LDP (n = 48) than at the FDP (n = 32). Duruel et al. 39 reported that the most frequent localization of PSAA was intraosseous in the first premolar region and submembranous in the second premolar and molar regions. The authors also noted that the extraosseous localization of PSAA was rarest in all regions. Chitsazi et al. 2 stated that 73.2% of PSAA was intraosseous, 21.7% of them were under the sinus membrane, and 4.9% of them were extraosseous. Güncü et al. 24 found that the most commonly seen location of PSAA was intraosseous (68.2%) and also noted that 5.7% of PSAA was located under the Schneiderian membrane. Tehranchi et al. 25 investigated PSAA localization based on gender and type of edentulism and found that although the intraosseous type (47.9%) was mostly observed in males, the submembranous type (48%) was mostly detected in females. The authors also reported that in cases of complete edentulism, PSAA was mostly located beneath the membrane (45.7%), while the external cortex of the lateral sinus was not observed. Additionally, when the localization of PSAA was evaluated in cases of partial edentulism, PSAA was intraosseous in 47.7%, submembranous in 38.5%, and extraosseous in 7.7% of the cases. 25 In this study, cases of both partial and complete edentulism were analyzed together, while the PSAA path along the lateral wall of the maxillary sinus was not examined. The path of the PSAA was grouped into two categories: straight (type 1) and U-shaped (type 2). 11 Hur et al. 11 conducted a cadaver study and determined that type 1 was observed in 25 cases (78.1%) and type 2 was detected in 7 cases (21.9%). Taken together, these findings implicate that the PSAA path may influence the examination results such as the evaluation of the distance between the sinus floor and PSAA.
In the literature, there are various studies evaluating the characteristics of PSAA and the thickness of the lateral sinus wall in different populations.2,12,23,24,27 In these studies, however, racial differences have not been evaluated and the sample size, measurement techniques, and the CBCT devices were not standardized. Therefore, a comparison of our findings with those reported in previous studies that have been conducted in different populations and races such as Asians, Americans, and Europeans may not yield reliable results. Accordingly, standardized multicenter studies should be conducted to evaluate the PSAA and the thickness of lateral sinus wall in different populations and races.
Limitations of this study included limited sample size and the absence of an evaluation on the efficacy of gender and age groups on the results. On the other hand, the inclusion of patients with sinus floor elevation indications and the administration of measurements by using two reference points in each patient were the strengths of our study.
Conclusion
In conclusion, identifying the characteristics of the PSAA by using CBCT is crucial for handling the sinus floor elevation procedures uneventfully. Besides, the thickness of the maxillary sinus lateral wall influences the duration of surgery and increases the risk of Schneiderian membrane perforation.
Footnotes
Declaration of Conflicting Interests
The authors declared no potential conflicts of interest with respect to the research, authorship, and/or publication of this article.
Ethical Approval
This article does not contain any studies with human participants or animals performed by any of the authors. The study was approved by the local ethics committee (Approval No: 154) and was conducted in accordance with the 1975 Helsinki Declaration, as revised in 2000.
Funding
The authors received no financial support for the research, authorship, and/or publication of this article.