Abstract
Objectives:
One of the most important problems of cone-beam computed tomography (CBCT) imaging technique is the presence of dense objects, such as implants, amalgam fillings, and metal veneers, which result in beam-hardening artifacts. With an increase in the application of CBCT images and considering the problems in relation to cupping artifacts, some algorithms have been presented to reduce these artifacts. The aim was to present an algorithm to eliminate cupping artifacts from axial and other reconstructed CBCT images.
Materials and Methods:
We used CBCT images of NewTom VG imaging system (Verona, Italy, at Dentistry Faculty, Medical Sciences University, Tabriz, Iran) in which every image has a resolution of 366 × 320 in DICOM format. 50 images of patients with cupping artifacts were selected. Using Sobel edge detector and nonlinear gamma correction coefficient, the difference was calculated between the density of axial images in the main image and the image resulting from nonlinear gamma correction at the exact location of the radiopaque dental materials detected by Sobel. The points at which this density difference was out of a definite limit were treated as image artifacts and were eliminated from the main image by the inpainting method.
Results:
The resultant axial images, for producing reconstructed cross-sectional, panoramic images without cupping artifacts, were imported into NTT viewer V5.6 and utilized.
Conclusions:
With comparison, acquired images observed that the offering algorithm is practical and effective for reducing the cupping artifacts and preserving the quality of the reconstructed images. This algorithm does not need any additional equipment.
Keywords
Introduction
One of the most essential characteristics for dental implant imaging technique is the ability to allow reliable and accurate measurements. Of all the available imaging techniques, cone-beam computed tomographic (CBCT) imaging technique provides high-resolution three-dimensional images of high-diagnostic quality with significantly reduced acquisition times and radiation burden with low cost. Like other images, CBCT images have their own disadvantages, including patient motion artifacts, inherent artifacts, procedure-related artifacts, and beam-hardening artifacts. Beam-hardening artifacts are nonlinear artifacts arising from the fact that the energy distributed over the voxels along the projection rays in reconstruction does not correctly represent the actual (real) physical energy distribution. This induces incorrect gray values in the projection/back-projection direction, consequently wasting the benefit of information on the images. Yet it also means that the reconstruction “does not know” which would be the correct density (gray value) in this artifact region. Of all these problems, cupping artifacts are one of the most essential problems in CBCT images because they significantly reduce measurement accuracy in reconstructed two-dimensional sections. To improve these artifacts, various methods, including software- and hardware-based algorithms, have been proposed. Most software-based approaches are based on Monte Carlo simulation, which is a very powerful, albeit time-consuming tool in CBCT scatter correction. 1
Many hardware-based correction methods are powerful, such as the beam stop array method, the moving blocker method, primary modulation, and so on. However, these types of correction methods add extra hardware to the CBCT system which can increase the difficulty and complexity. 1 Among the above-mentioned methods, algorithm-based methods, with high-speed operation, low cost, and no need for additional equipment are preferable to other methods. Of all these, we can mention the level set-based algorithm, 1 pixel gain correction (PGC), 2 segmentation, boundary points, 3 etc.
Since in the above-mentioned studies, just proceeded to reduce artifacts in axial CBCT images with JPEG format and were unable to import the corrected images in NTT viewer software, it was not possible to exploit it in the cross-sectional CBCT images.
Therefore, the purpose of this study was to present a new delineation for elimination of cupping artifacts in axial CBCT images, with the aim to omit these artifacts in other reconstructed images. Since only the manufacture can gain access to raw data, this algorithm was evaluated on axial CBCT images, so that it would be suggested as an algorithm in image reconstruction phase to the manufacturer. In this paper, we introduce an algorithm that can omit cupping artifacts from axial CBCT images and then by importing images without cupping artifacts into NTT viewer software we can provide reconstructed cross-sectional, panoramic images without cupping artifacts.
Materials and Methods
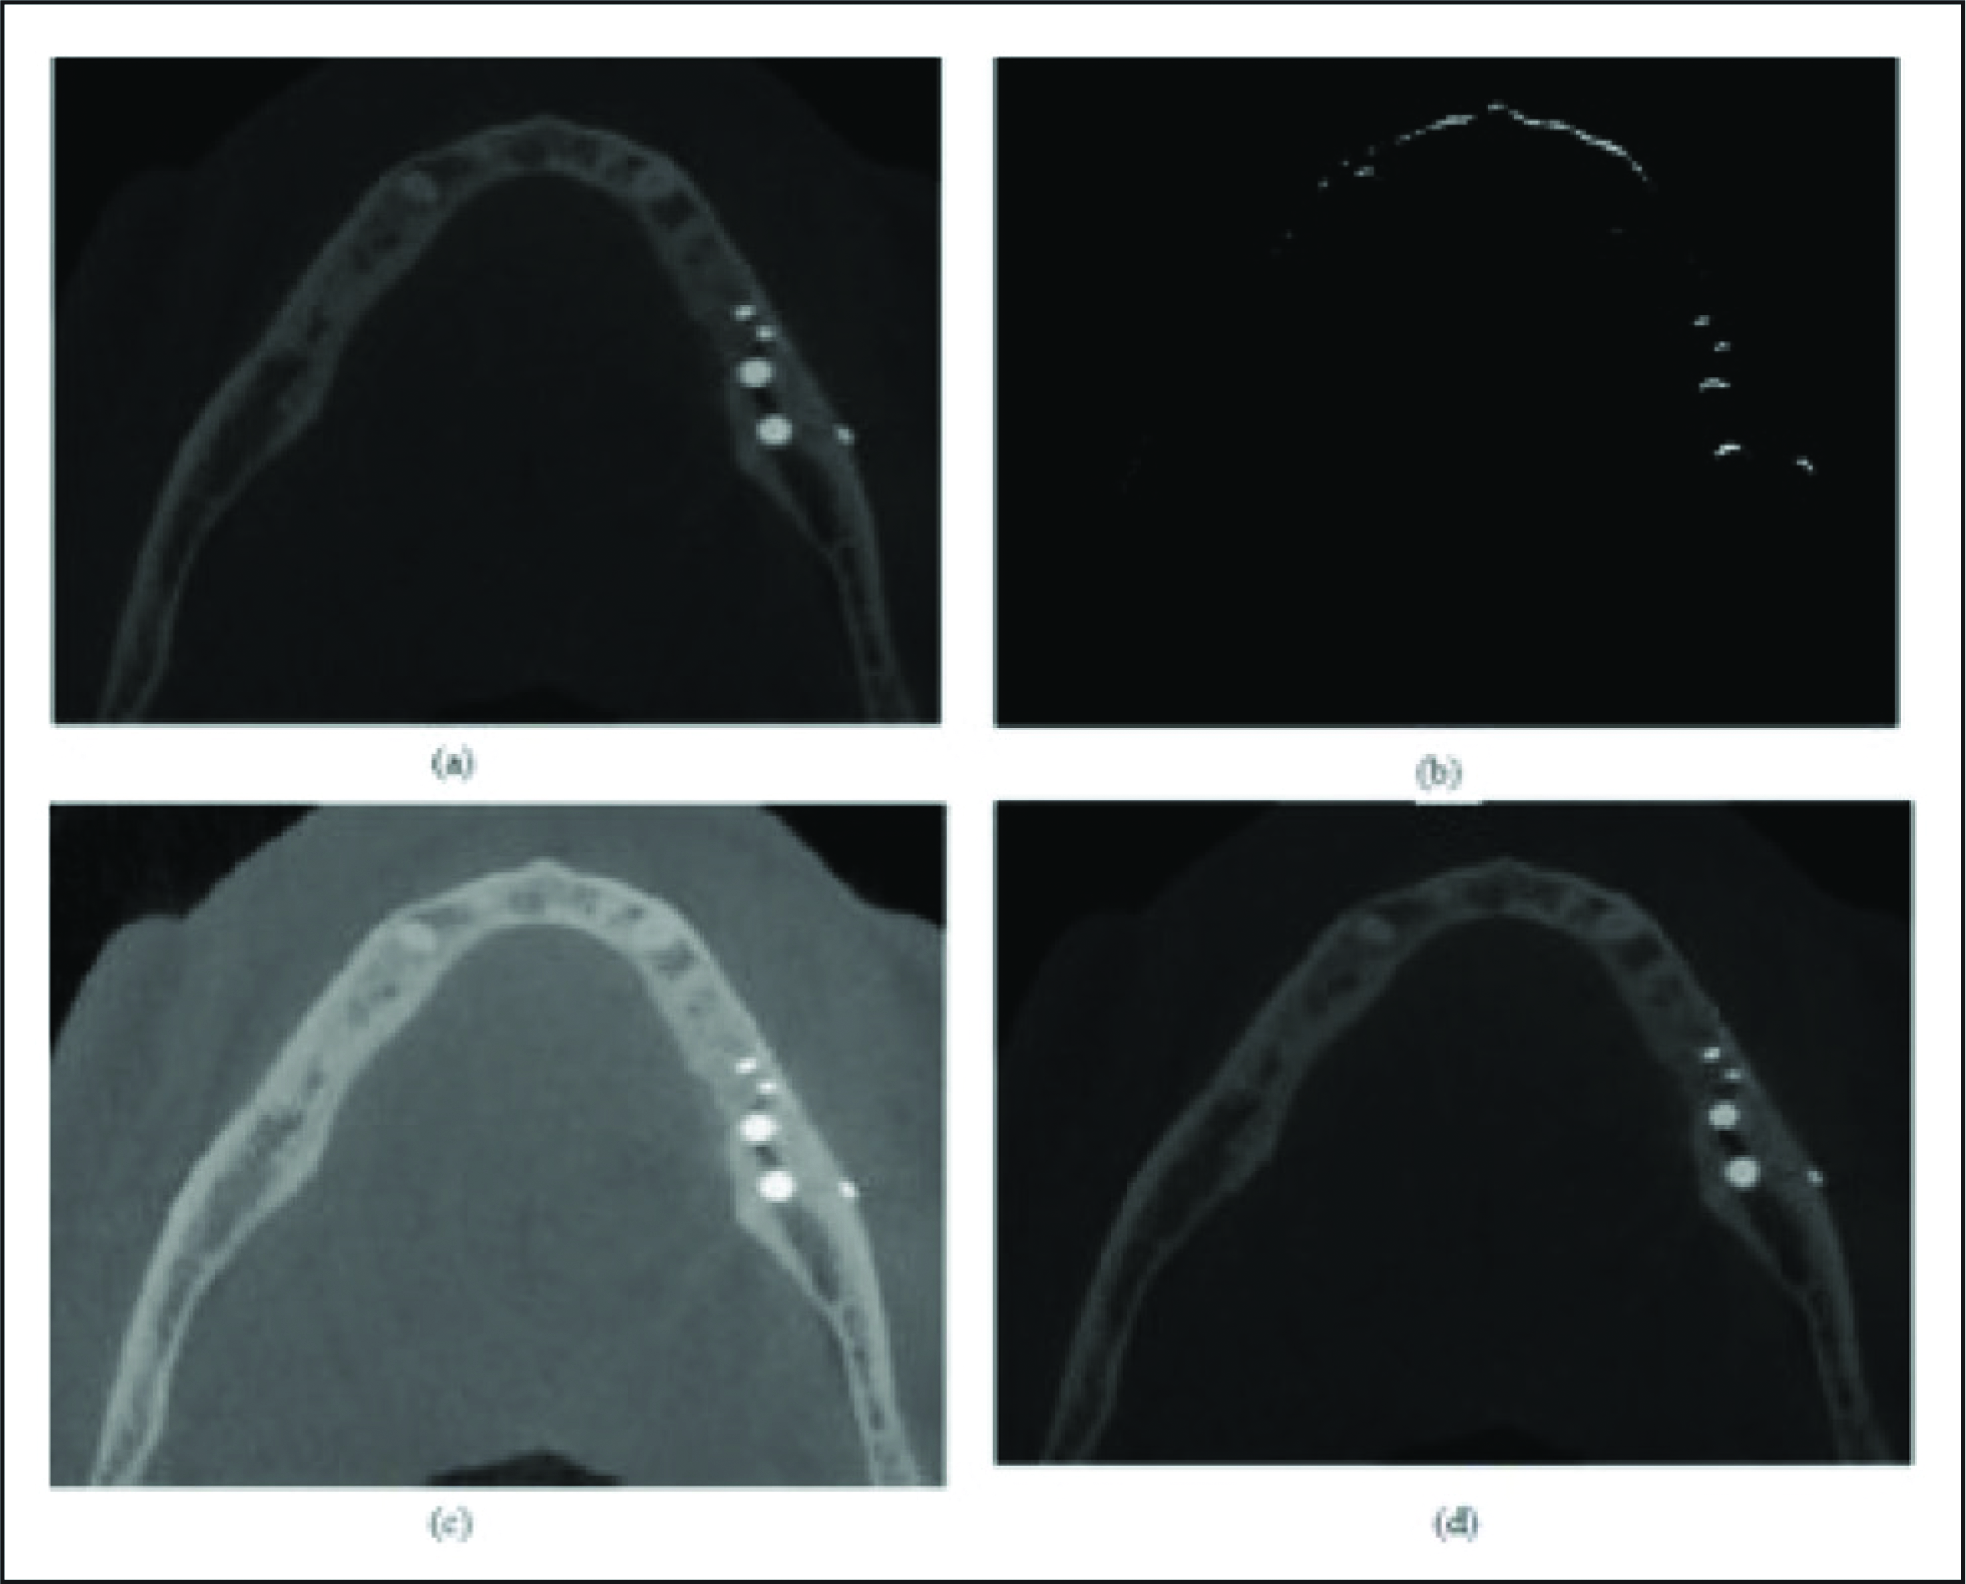
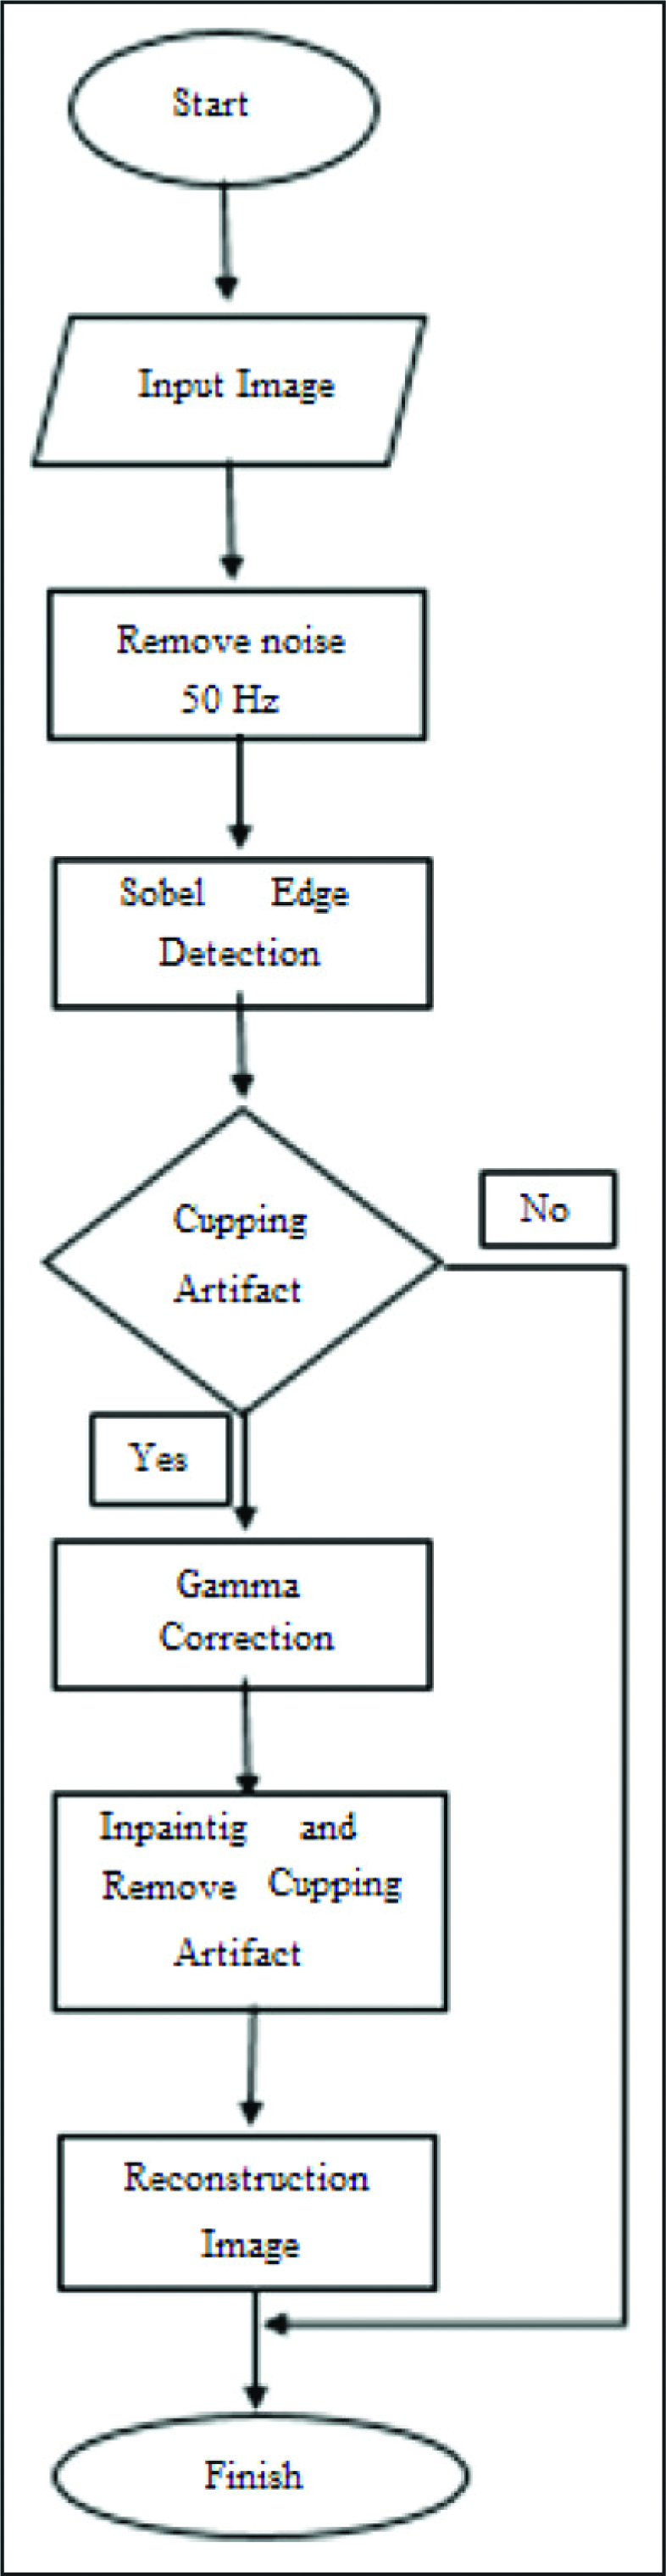
In this paper, we used axial CBCT images of NewTom VG imaging system, with a resolution of 366 × 320 for each image in the DICOM 1 format. Fifty images of patients with radiopaque dental materials were selected. The patients were 35 to 60 years old. Figure 1(a) presents one sample of axial CBCT image related to the patients with radiopaque dental materials. Figure 2 shows the architecture of the system implementation that has been developed.
The Proposed Algorithm
One of the best methods for the analysis of medical images, like Axial CBCT images, is the use of Sobel edge detector algorithm and linear gamma correction and inpainting, which were used for omission of cupping artifacts and metallic dental materials in this study.
Noise Removal
One of the radiographic image problems is mottle noise which impairs CBCT images and influences their distinction and interpretation. Radiographic image noise is classified in quantum mottles, and is related to the number of x-ray exposures and artificial noise of city electricity frequency (50 Hz). Quantum mottles appear as grains on radiographic images. To reduce these grains, the dose should increase, which is dangerous for patients. Therefore, reducing noise in radiographic images is highly important.
Median filter is one of the proper methods for noise elimination. An adaptive weighted median filter effectively decreases noise. This filter cannot eliminate image details, because it is a low-pass filter. It can eliminate separate spot noises or separate linear noises without changing image edges. Nonlinear filters like median filter effectively work in elimination of noise species. Adaptive median filter is calculated as follows:

Where, W is the window, w is the weight of the center pixel,
Sobel Edge Detector
Edge detection is one of the most important steps in segmentation of images. In order to divide an image into various segments, the edges of each segment should be determined. Edge detection is used to identify objects and has many applications. One of its most important applications is in the medical science.
One of the best and most commonly used operators for edge detection is Sobel which is one of the most commonly used methods for detecting significant discontinuities in intensity values. These discontinuities are detected by the first and second derivatives. The first derivative or two-dimensional function gradient, f(x,y), is defined as the following vector:
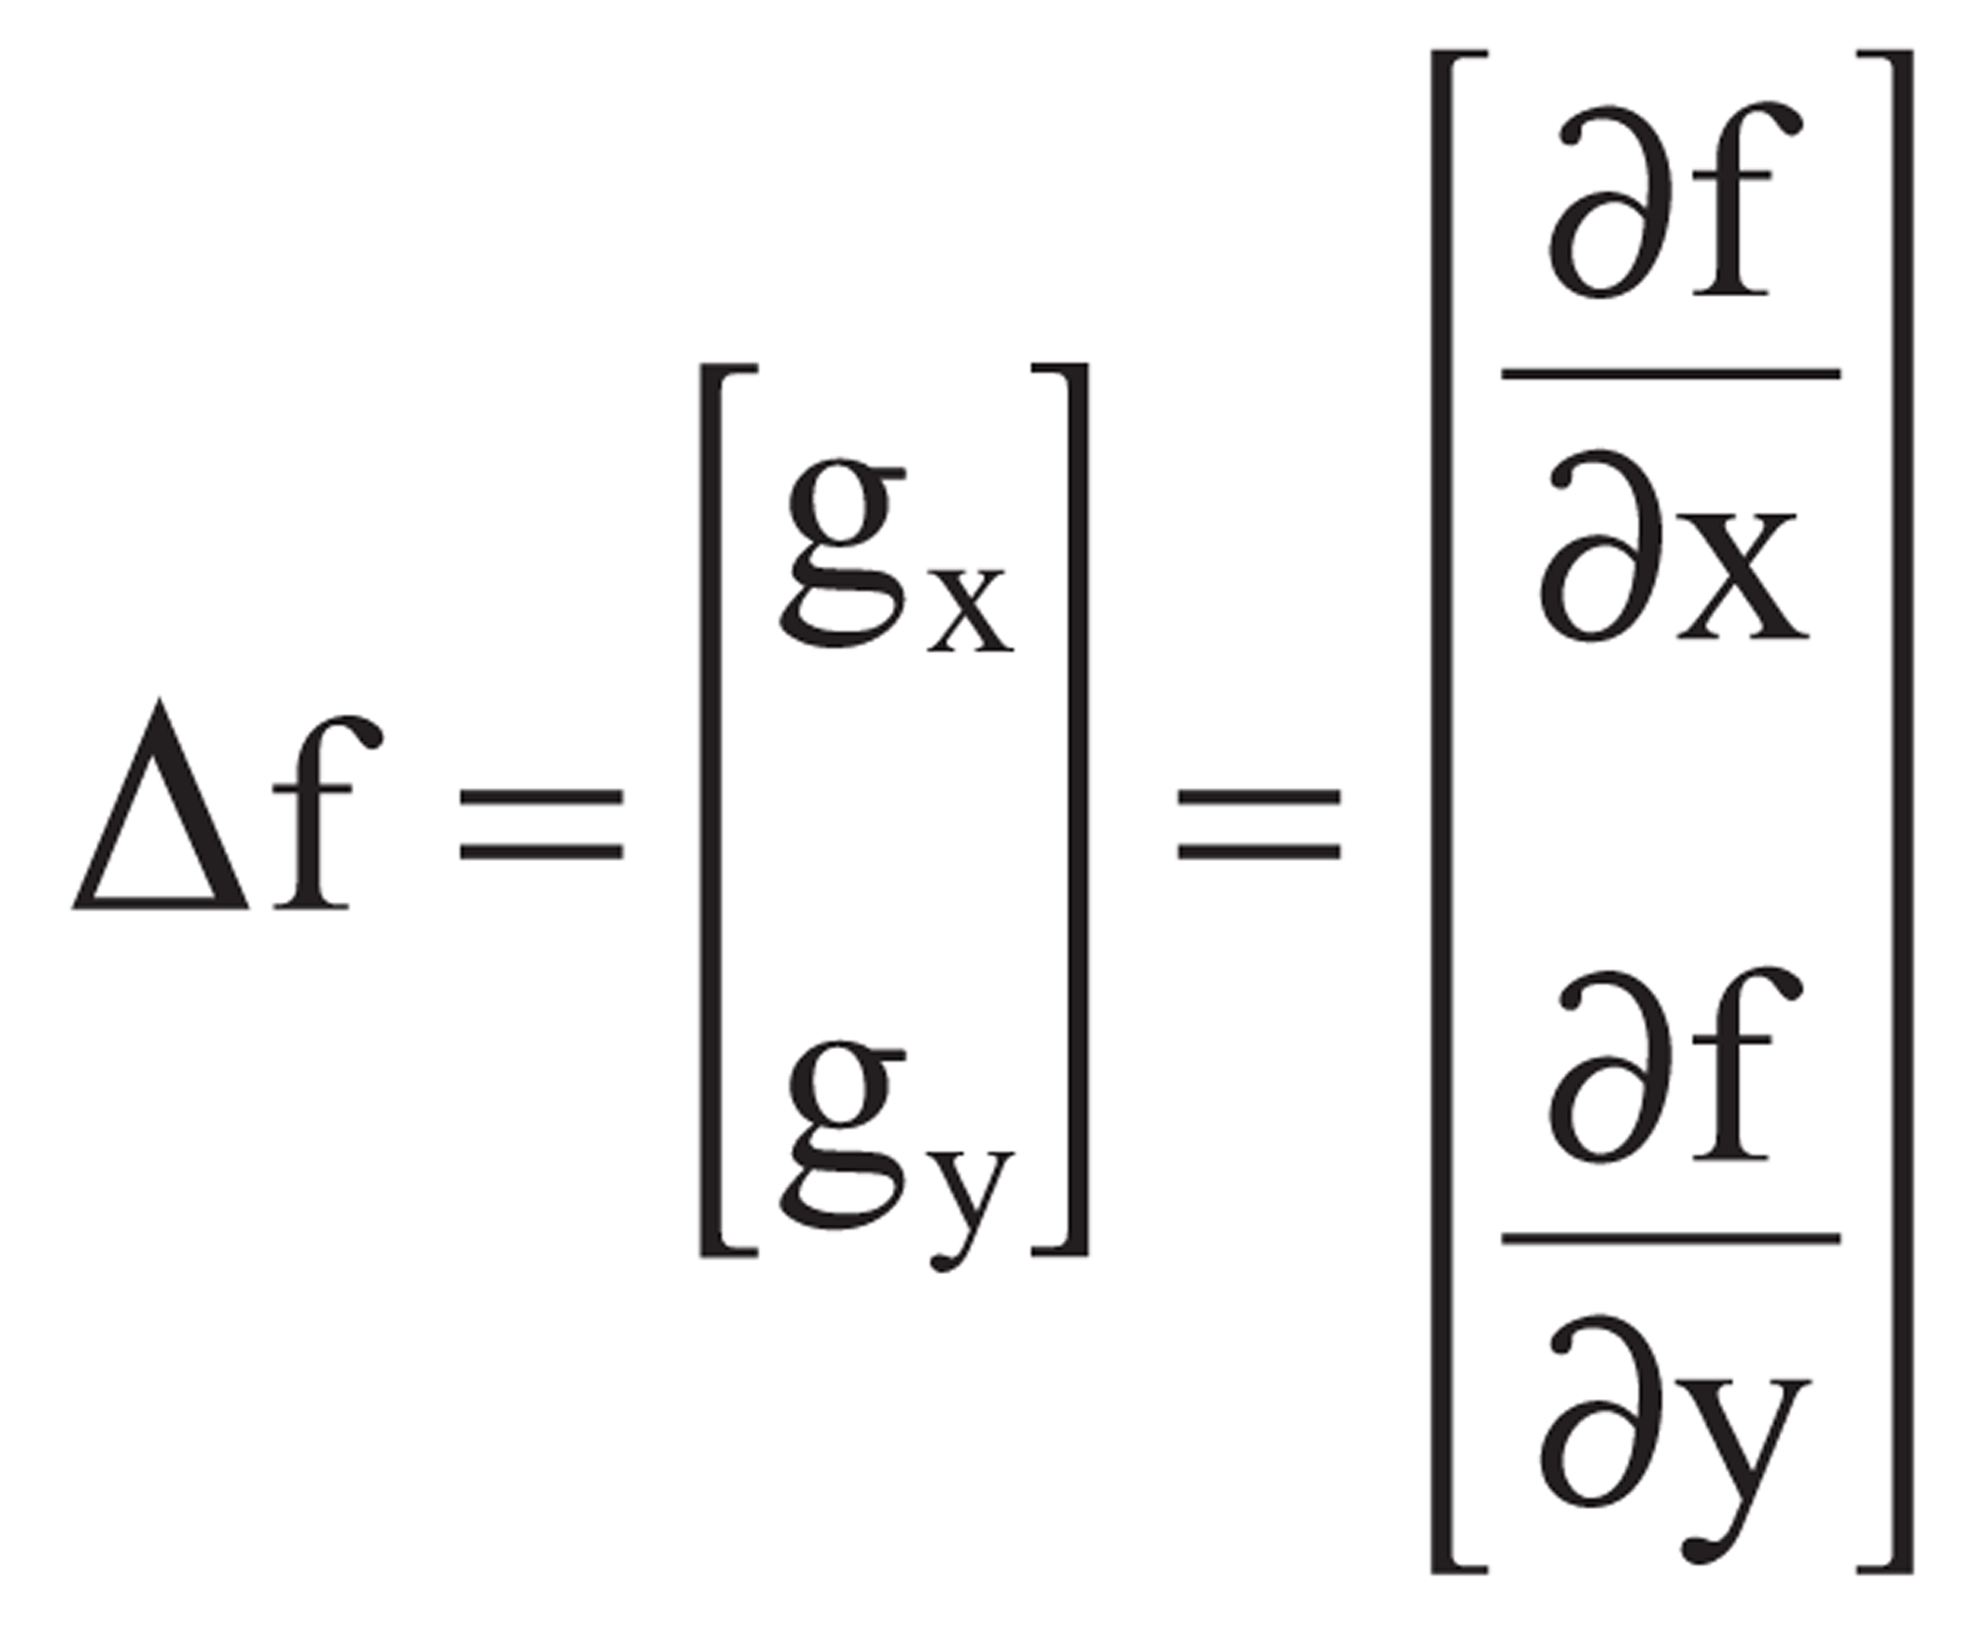
In which Δf is the gradient of function (f), and gx and gy are the gradient values on x and y axes, respectively. After simplification, the following equation is reached:
So that gradient matrixes are as follows:
Generally, the coefficient of 1/8 is ignored; however, this coefficient is necessary for accurate computation of the gradient value. Figure 1(b) presents the results achieved from Sobel edge detector.
Nonlinear Gamma Correction
Nonlinear gamma correction, or often simply gamma, is the name of a nonlinear operation used for coding and decoding of luminosity in still image systems or to determine the relative values of the main color in motion pictures. Nonlinear gamma correction, in the simplest cases, is defined by the following power-law expression:
In the above relation, where Iin and Iout are the input and output image intensities, respectively, A is the constant value and γ is nonlinear gamma correction value; the computation of the formula is shown in Equation (3). In the common case of A = 1, inputs and outputs are typically in the 0-1 range.
A gamma value of < 1 is sometimes called an encoding gamma, and the process of encoding with this compressive power-law nonlinearity is called gamma compression; conversely, a gamma value of > 1 is called a decoding gamma and the application of the expansive power-law nonlinearity is called gamma expansion.
The results of nonlinear gamma correction are shown in Figure 1(c).
Inpainting and Artifact Elimination
After application of Sobel edge detector and nonlinear gamma correction, the density difference of axial CBCT images in the main image and the image produced by nonlinear gamma correction is computed in outcome areas of Sobel. At points at which this difference in density exceeded a definitive threshold, the points were considered image artifacts and eliminated from the main image by using inpainting method as presented in Equation (6).

In Equation (6), ∆t is the rate of improvement and Itn (i, j) stands for the update of the image In(i, j). In + 1(i, j) is an improved version of In(i, j), with the “improvement” given by Itn (i, j) . The results are presented in Figure 1(d).
After elimination of the artifact, reconstruction of the image and transferring the corrected axial CBCT images in the DICOM format to NTT viewer software program (Version 5.6), the images could be compared in terms of volumetry, the results of which are presented in Figure 3.
Production of Reconstructed Images from Corrected Axial CBCT Images in NTT Viewer Software
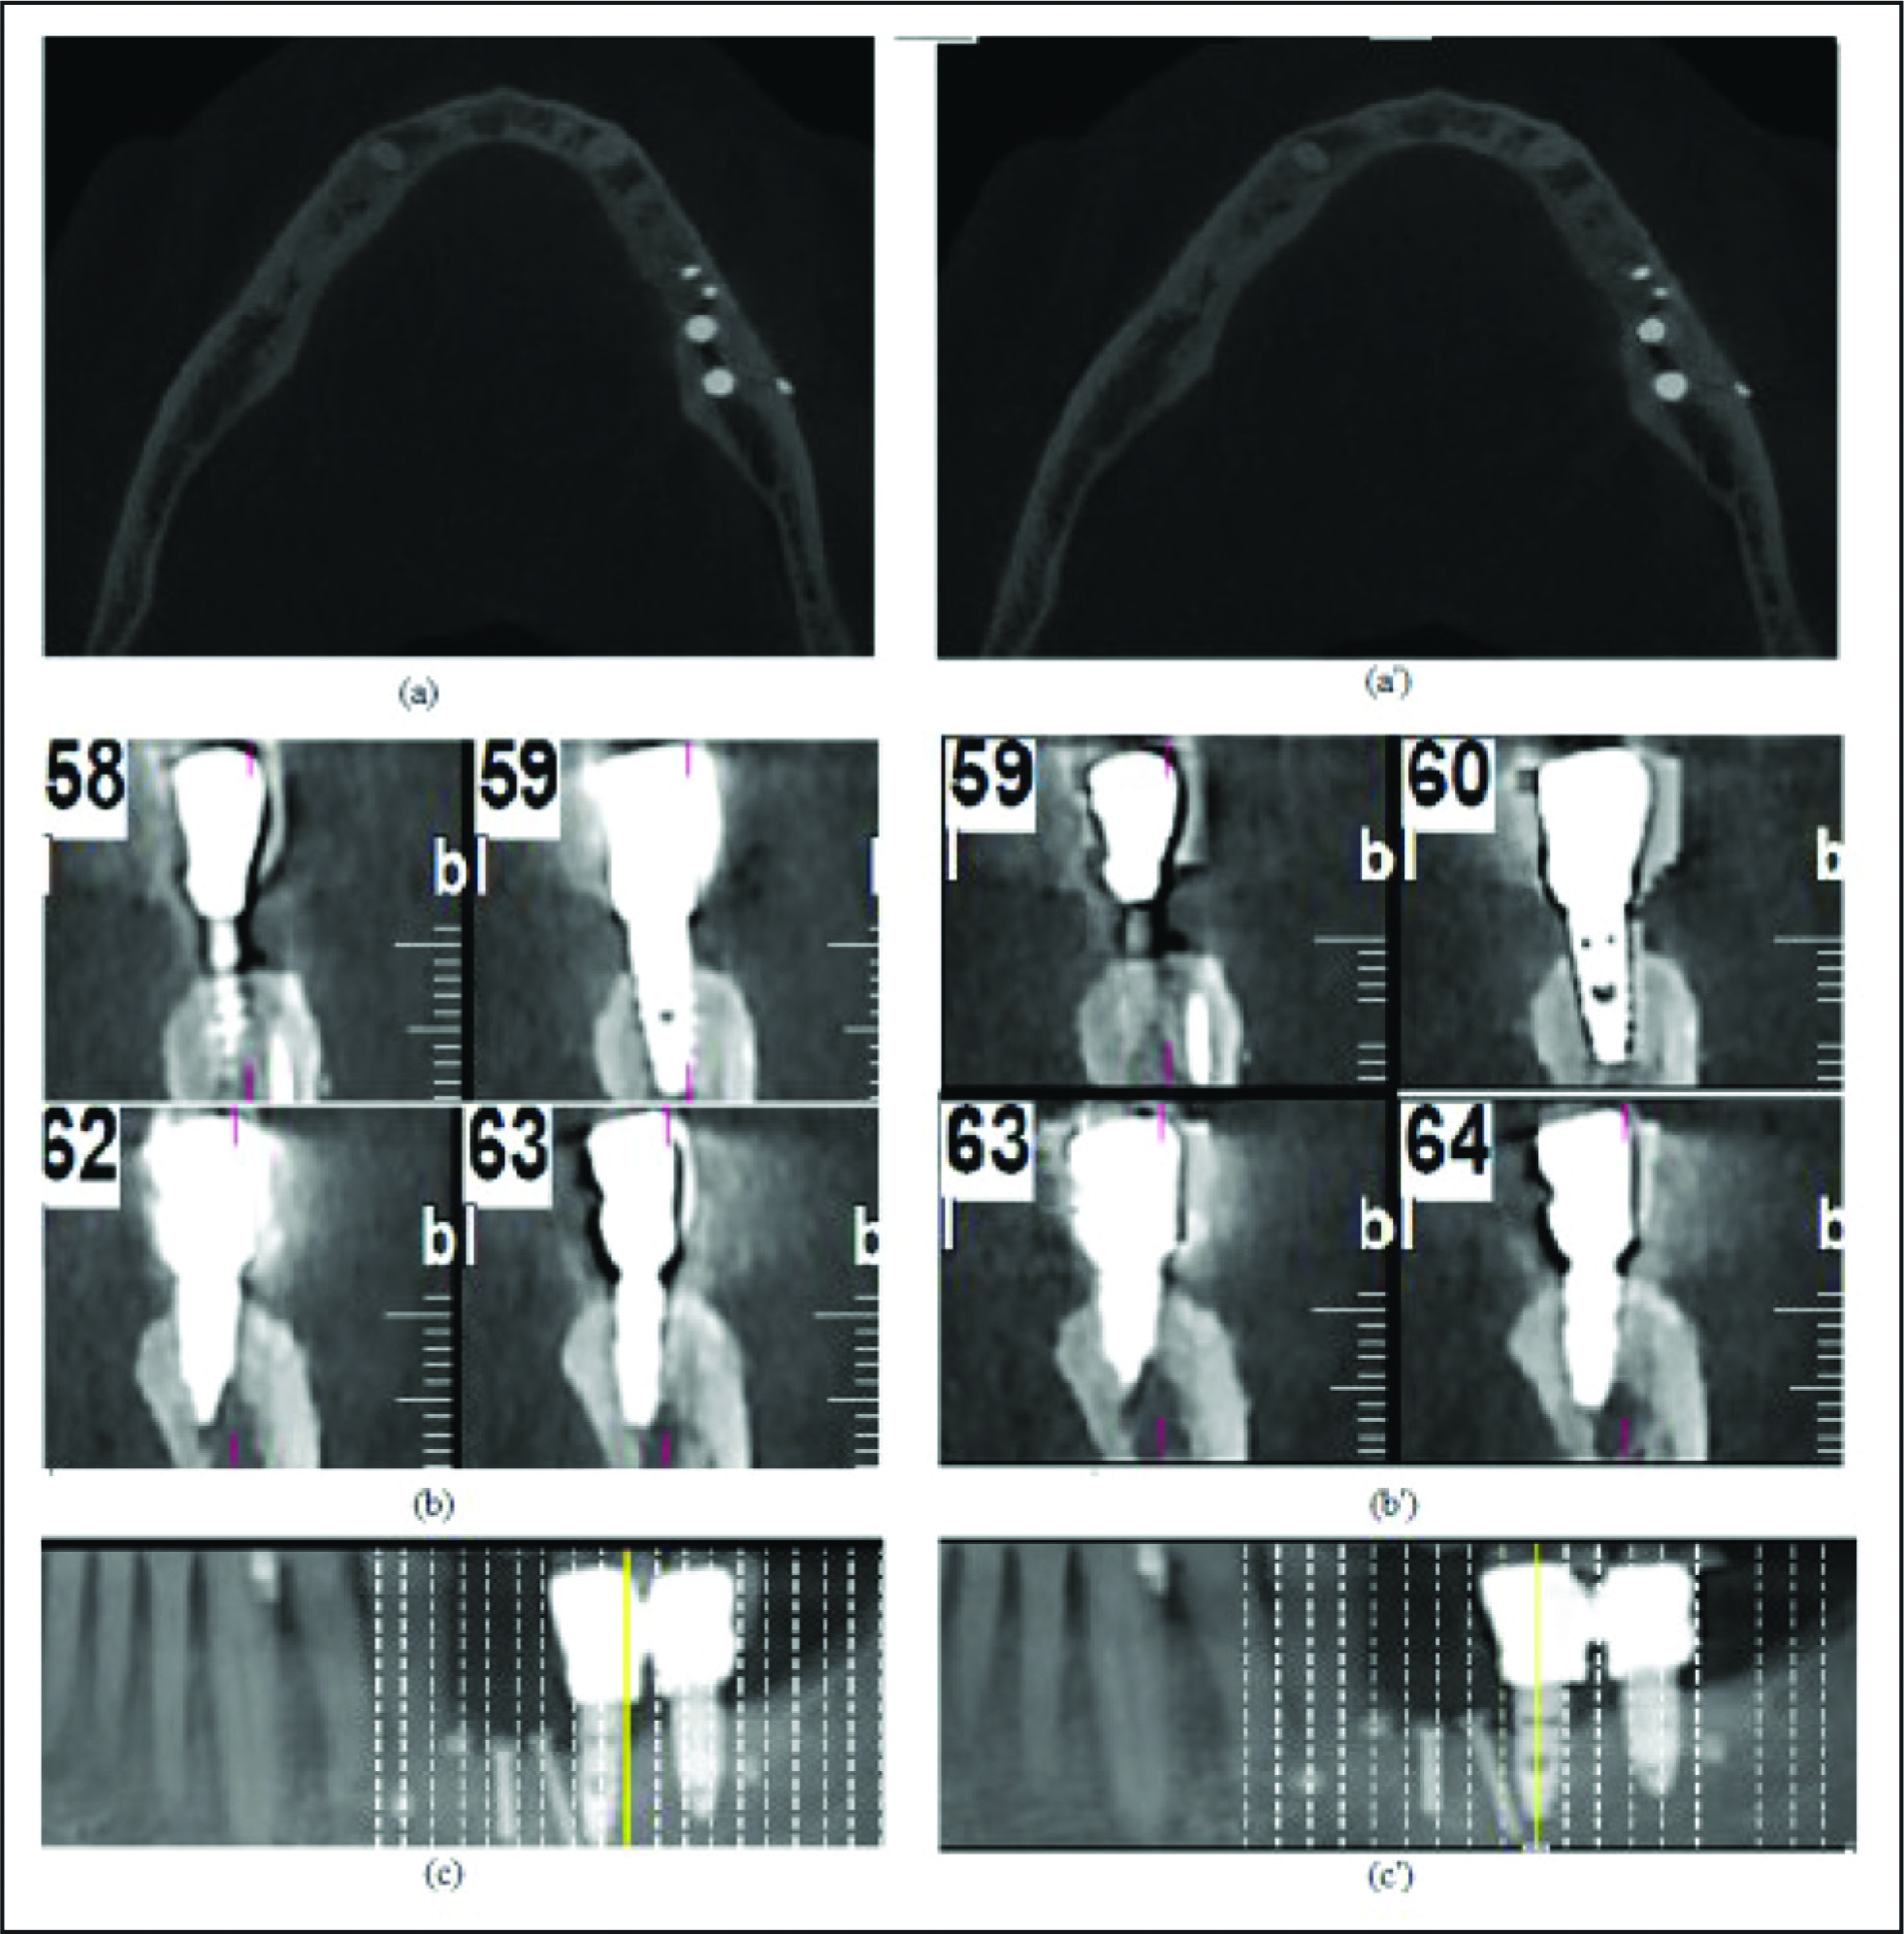
At this stage, after transferring the axial images to the NTT viewer software program, reconstructed cross-sectional, panoramic CBCT images were produced and comparison of these images with initial and secondary reconstructed images showed that the cupping artifacts had been eliminated with high accuracy (Figure 3).
Evaluation Criterion
For evaluation of the method used for noise reduction in radiographic images and its comparison with common methods applied a common criterion below:
Median-to-Standard Deviation Ratio (MSR)
In (9), ηd and σd are median and standard deviation of region of interest (DROI), respectively.
Contrast-to-Noise Ratio (CNR)
Noise-to-contrast ratio is also an important quality evaluation for medical imaging which represent as follows:
In (10), ηd and σd are median and standard deviation of unregion of interest (UROI), respectively.
Peak Signal-to-Noise Ratio
For efficiency evaluation of the new filter used in this study, we computed peak signal-to-noise ratio (PSNR) as image quality evaluation method.
Peak signal-to-noise relation used in medical x-ray images is defined as follows:
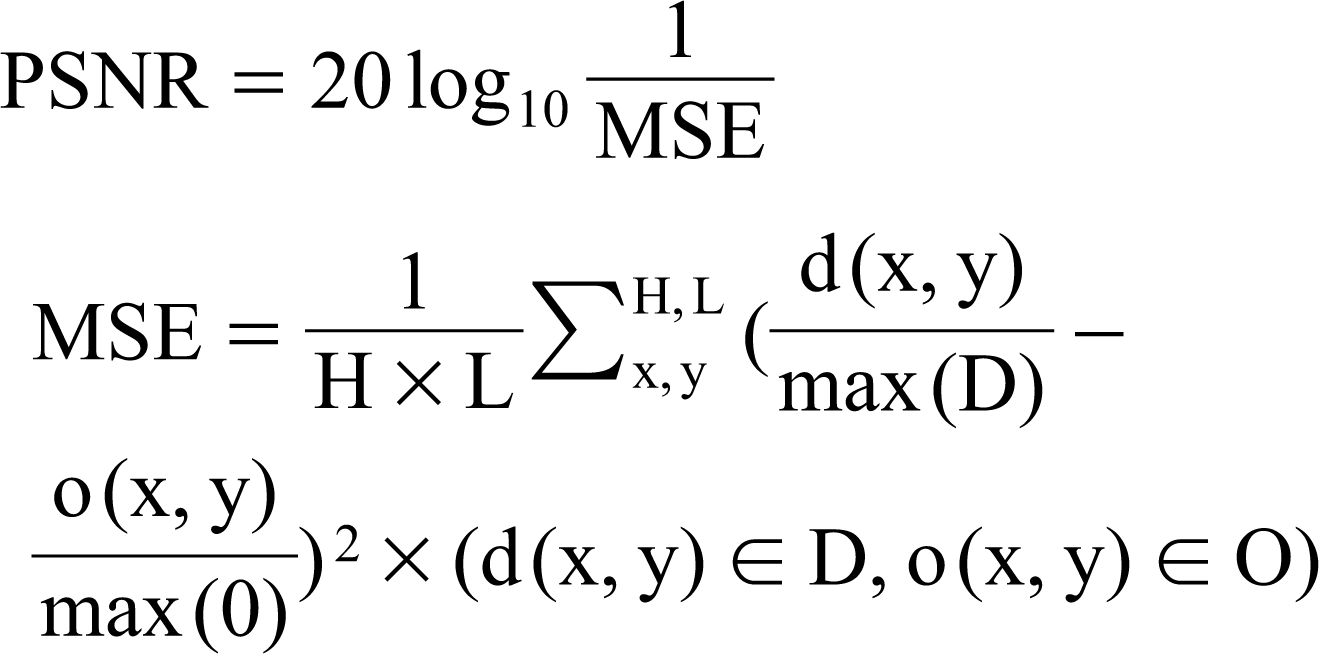
High-dose x-ray image (x,)εD, pixels content H × L, and revived image o(x,y)εO.
Conclusion
The presence of metallic radiopaque dental materials in the patients’ dentition results in cupping artifacts and decrease in the quality of CBCT images. Thus it is decreasing the accuracy of measurements on reconstructed CBCT images. By correction of cupping artifacts in axial CBCT images, we will be able to increase image quality and accuracy of measurements in other reconstructed CBCT images.
As for mottle noise and city electricity noise do to drop quality of radiographic images, so before image property survey and extraction, we proceed to eliminate the noise by median filter. This filter has the ability of eliminating separate-spot noises or separate-linear noises, without any alteration in image edges. After noise elimination, we used extracted properties of Sobel edge detector and nonlinear gamma correction and inpainting method to eliminate cupping artifacts from axial CBCT images.
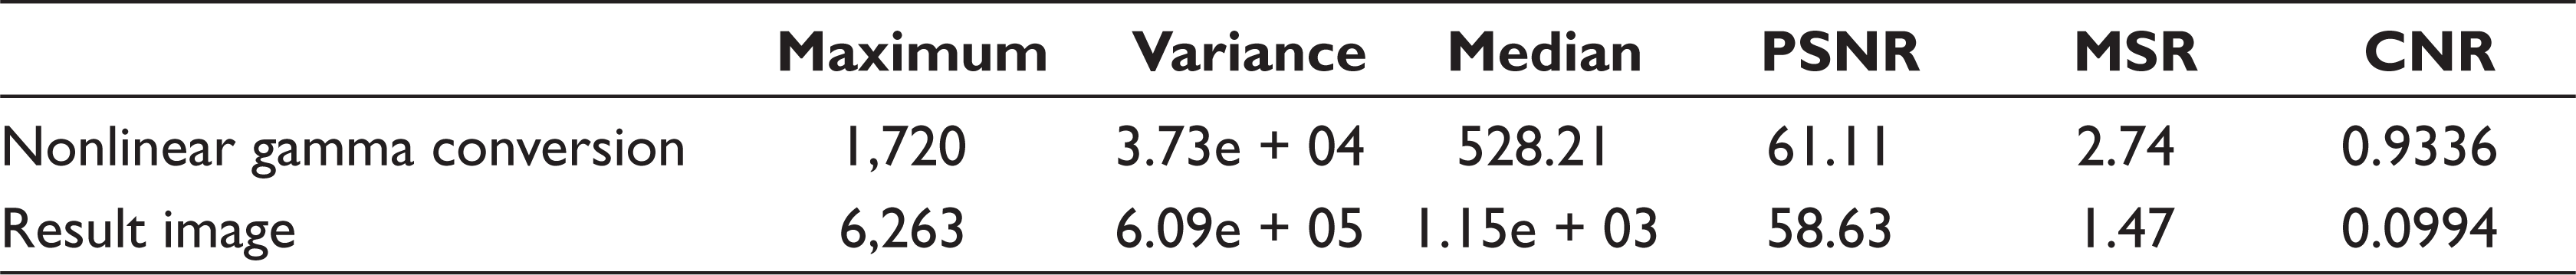
After application of the proposed algorithm on axial CBCT images and importing these images into NTT Viewer, version V5.6, reconstructed CBCT images without cupping artifacts were produced. Comparison of the reconstructed images in Figure 3 and Table 1 showed that the proposed algorithm was successful in removing cupping artifacts from CBCT images with high accuracy.
Comparison of Primary and Final Reconstructed CBCT Images Before (a, b, c) and After (a’, b’, c’) Algorithm: (a, a’) Axial Images, (b, b’) Cross-sectional Images, (c, c’) Reconstructed Panoramic Images
Results of Evaluation Algorithm Processes by Max, Variance, Median, PSNR, MSR, and CNR Criterion