
Abstract
This study examines the influence of financial literacy, gender, annual family income and neuroticism personality trait on the probability of millennial equity investors to suffer from selected cognitive biases (availability bias, representative bias, mental accounting bias and anchoring and adjustment bias). Binary logistic regression method is applied to conduct the analysis. Results of the current study indicate that selected demographic factors and investor personality are significant in predicting the probability of millennial Indian investor to suffer from the biases under consideration. For availability bias, financial literacy; for representative bias, financial literacy, neuroticism and gender; for mental accounting bias, neuroticism, gender and annual family income; and for anchoring and adjustment bias, financial literacy, neuroticism, gender and annual family income are found as significant predictors.
Keywords
Introduction
All traditional finance theories are derived from the idea of investor rationality, an efficient market and profit maximization (Glaser et al., 2003; Malkiel & Fama, 1970). Principles of maximization, self-interest and consistent choice commonly support the rational economic factor (Somil, 2007). Though conventional finance theories like portfolio allocation based on expected return and risk, risk-based asset pricing models like CAPM and other similar framework and the Miller–Modigliani theorem and its augmentation by the theory of agency have transformed the domain of finance and brought precision into the field, yet many gaps were left unsettled by these theories (Subrahmanyam, 2008). In real life, numerous irrational behaviours allied to investment judgment follow (Huang et al., 2016). Therefore, the need of studying the human side of economic decision-making attracted the attention and laid down the foundation of behavioural finance. Scholars connected economic utility with human psychology and morality and gave it a much wider implication. Behavioural finance amalgamates theories from the zones of finance, classic economics and psychology. A wide body of empirical research points that individual investors comport themselves differently from one another. Behavioural finance assumes that cognitive, emotional and psychological factors impact investors’ decisions (Barberis & Thaler, 2005; Chaffai & Medhioub, 2014). There can be various factors that may contribute towards the individual difference that people carry. Age, income, education level, objective of investment and risk appetite of investor along with other factors navigate the equity investment decisions of an investor (Choudhary, 2016). Further, psychological research validates that gender influence individuals’ outlook towards financial decisions (Acker & Duck, 2008; Graham et al., 2009; Grinblatt & Keloharju, 2009; Hoffmann et al., 2010). Also, educational level, portfolio size and wealth and investors’ experience of investing are observed to impact the investment decisions of individuals (Ekholm & Pasternack, 2008; Graham et al., 2009).
Current literature indicates that psychological factors can lead individuals to deviate from rational decision-making and demonstrate cognitive biases under conditions of risk and uncertainty (Kahneman & Tversky, 2013). A number of studies have examined various behavioural biases that usually arise in decision-making of investors (Filbeck et al., 2017). Degree of behavioural biases vary across various factors such as gender, professional competence among others (Barber & Odean, 2001, 2007; Tekçe et al., 2016). Further, Durand et al. (2008, 2013, 2019) and Lin (2011) indicated the relevance of personality traits to influence the likelihood of exhibiting cognitive biases during the investment decision process. In a recent study, Ahmad (2020) observed an association between personality trait and cognitive bias. Further, Baker et al. (2019b) indicated a significant linkage of demographic factors and financial literacy with cognitive biases. Notably, behavioural biases may adversely impact the investment decisions of the investors in various situations. For instance, under the influence of familiarity bias, individuals divert from the right way of picking stocks and end up creating suboptimal portfolio. A consequent allocation to company stocks is likely to be positively correlated with past returns of those stocks (Benartzi, 2001). This behaviour is likely to affect portfolio returns as individuals take decisions on limited data. It is significant to have a mechanism to explain the causes and effects of investors’ mistakes in order to propose a framework to ensure the investor protection (Daniel et al., 2001). Therefore, it is important to explore the various aspects of behavioural biases. Yet, there is a dearth of studies in Indian context which explore the factors that trigger behavioural biases to influence the investment decision-making of individuals (Baker et al., 2019b). Additionally, only about 3.7% of Indian population invest in equities but this number has seen a remarkable grown in the recent times (Balwani et al., 2021). Notably, the data from Bombay Stock Exchange show an addition of 1.78 crore new investors from May 2020 until May 2021 (ANGELONE, 2021). These developments further strengthen the need of conducting a study to explore the antecedents of behavioural biases for young Indian investors. Therefore, the current study attempts to investigate whether (selected) demographic factors (family income, financial literacy and gender) and neuroticism personality trait are significant predictors of the propensity of young equity investors to suffer from representative bias, anchoring and adjustment bias, mental accounting bias and availability bias.
Literature Review
Investor Demographics and Personality and Behavioural Biases
Financial literacy is the degree to which an individual understands crucial financial concepts and holds the capability and confidence to manage own finances by taking suitable short-term decisions and by doing appropriate long-term financial planning in accordance to various life events and varying economic conditions (Remund, 2010). Current literature indicates that financial literacy has large scale implications for investors’ risk taking (Bianchi, 2018; Liao et al., 2017), stock market participation (Almenberg & Dreber, 2015; Van Rooij et al., 2011), retirement planning (Anderson et al., 2017), asset allocation (Van Rooij et al., 2011) and better financial planning (Agarwal et al., 2015). Baker et al. (2019b) also observed that financial literacy is negatively associated with herding and disposition effect but has a positive linkage with degree of mental accounting bias. Further, Takeda et al. (2013) observed that high investment literacy leads to lower level of being overconfident. On the other hand, some of the earlier studies (Allgood & Walstad, 2016; Barber & Odean 2001; Odean, 1998) conclude that higher level of perceived financial literacy is likely to make investors become overconfident. Furthermore, a weaker significance of improving level of financial literacy on investors’ financial behaviour. Notably, Agarwal et al. (2015) observed a lower degree of financial literacy among young urban Indians. Therefore, to gain more clarity about the linkage of financial literacy and behavioural biases, more research in this area is required.
Personality of individuals is an important aspect, which is significant in explaining their actions and choice (Durand et al., 2019). Investors’ personality traits are linked with its investment picks and outcomes (Borghans et al., 2008; Durand et al., 2008; Sadi et al., 2011), risk tolerance and investment management (Borghans et al., 2008; Mayfield et al., 2008; Statman & Wood, 2004), portfolio selection (Bucciol & Zarri, 2017; Hunter & Kemp, 2004) and money management and financial satisfaction (Davis & Runyan, 2016; Ksendzova et al., 2017). In past few years, the association between personality traits and degree of various behavioural biases among stock market investors has been explored (Baker et al., 2019a, 2019b; Durand et al., 2008, 2019; Lin, 2011; Sadi et al., 2011).
Neuroticism personality trait influences individuals’ trading decisions most significantly (Costa & McCrae, 1980). Neuroticisms are selfish and self-centred individuals who like to be praised (Sadi et al., 2011). People having high degree of neuroticism are likely to be more depressed, anxious and pessimistic; such individuals tend to pay more attention to negative news than to positive news about a stock (Bolger, 1990; Costa & McCrae, 1992; Noguchi et al., 2006). Individuals that are high on neuroticism are observed to exhibit more panic during situations of ambiguity and uncertainty and prefer to evade such circumstances (Lommen et al., 2010). Therefore, investors who are high on neuroticism trait are observed to suffer from home bias (Niszczota, 2014) and include less risky assets in their portfolio (Becker et al., 2012; Gambetti & Giusberti, 2012; Nicholson et al., 2005). Similarly, high neurotic trait leads to more risk averse behaviour, put smaller proportion in riskier assets and trade less (Mayfield et al., 2008; Oehler et al., 2018). On the contrary, such investors are observed to invest in more volatile stocks (Durand et al., 2008) and bear higher portfolio risk (Durand et al., 2013). More recently, Baker et al. (2019a) and Ahmad (2020) observed neuroticism to remain relevant for behavioural biases; however, Sadi et al. (2011) did not find any linkage of neuroticism and behavioural biases. Moreover, Oehler et al. (2018) also indicated that relationship between risk behaviour and neuroticism is somewhat inconsistent. As impact of neuroticism still remains unclear hence more studies are required for in-depth understanding of the association between neuroticism and behavioural biases.
Since investor’s demographics exert a key influence on his/her response towards different situations (Baker et al., 2019b; Choudhary, 2016); hence, gender is likely to influence their investment process (Barber & Odean, 2001; Dohmen et al., 2011; Halko et al., 2012; Marinelli et al., 2017). Gender significantly impacts investors’ behaviour in financial decision-making. Male investors exhibited overconfidence bias and female was observed to show more risk averse attitude (Croson & Gneezy, 2009; Eckel & Grossman, 2008; Gong & Yang, 2012). In a more recent study, Baker et al. (2019b) observed that females demonstrate more heard behaviour and disposition effect that their male counterparts. Ahmad (2020) also finds similar results regarding disposition effect. However, this gap becomes narrower when socio-economic information is taken into account (Almenberg & Dreber, 2015; Bannier & Neubert, 2016). For instance, Filippin and Crosetto (2016) reported that tendency to avoid risk among female investors is an exception and not a rule. Although impact of gender on investment behaviour has taken up by several researchers, yet there is a need to explore it further in the current context when more and more females are becoming financially literate and independent.
Impact of income has also been investigated to understand the investors’ choice of investment avenues. Stock market participation strongly increases with increase in income as well as wealth (Van Rooij et al., 2011). Income levels were observed to be relevant for behvioural bias point of view (Dhar & Zhu, 2006; Graham et al., 2002; Kumar & Goyal, 2016; Tekçe et al., 2016). On the contrary, Lin (2011) and Baker et al. (2019b) observed no significant influence of income of behavioural biases demonstrated by investors. Therefore, there is a need to study the impact of income on behavioural biases demonstrated by retail investors.
Behavioural Biases
While investing in the market, individuals often show irrational behaviour and exhibit the tendency of being suffered from behavioural biases. Each individual suffers from one or the other biases and therefore, being biased is inevitable while making decisions (Shefrin, 2002). The current study considers four biases in the cognitive category. We have selected these four biases (cognitive biases) from the list of biases (including emotional biases) explored by Baker et al. (2019b) in Indian context. The relevant literature of these biases is discussed as follows.
Representative Bias
Representative bias is subjective assessment of the probability of an event, or a sample to the extent of its similarity in vital characteristics to its parent population and reflects the salient features of the process by which it is generated (Kahneman & Tversky, 1972). Representative bias plays a role in assessment of subjective possibilities (Kahneman & Tversky, 1973). It is a heuristic that explains investor overreaction to past growth trends. Law of small numbers navigates individuals to consider a randomly drawn sample as a perfect representative of the population it is drawn from, which influences their prediction procedure (Tekçe et al., 2016) and often results into asset mispricing (Lakonishok et al., 1994). Baker et al. (2019b) have indicated representativeness bias to be quite prominent among Indian stock market investors.
Mental Accounting Bias
Accounting is a tendency to code, classify and assess the economic outcomes by way of grouping assets in possession into any number of non-fungible mental accounts (Thaler, 1980). Mental accounting is a consequences of confusion arising due to base versus case data and poor application of basic calculation (Filbeck et al., 2017). Categorization of funds may help individuals to ease out the burden of financial decision-making. However, it has implications for how investors choose to save and spend their money. Therefore, individuals suffering from this bias may end up committing systematic errors (Zhang & Sussman, 2017). Mental accounting bias can cause investors to pursue income streams and irrationally damage the principal, construct an undiversified portfolio when company stock is offered, fail to treat all money as fungible and make wrong judgements about exiting from stocks that generated good return in the past followed by a price drop (Pompian, 2006).
Availability Bias
Availability bias is the tendency of people to estimate the frequency or probability of occurrence of an event by the ease with which related instances come to mind (Tversky & Kahneman, 1973). Availability bias triggers judgements regarding the chance or frequency of occurrence based on readily accessible information, not essentially on factual and complete information. Therefore, investors over-consider information that is easily available, recalled from memory and resembles to a future situation that is easy to visualize (De Bondt et al., 2008) and consider only those stocks that have attracted their attention initially for making investment (Barber & Odean, 2007). Availability bias triggers investor overreaction towards current market conditions and faulty investment decisions (Baker et al., 2019b; Pompian, 2006).
Anchoring and Adjustment Bias
Anchoring effects can exert an impact on economic decisions (Mussweiler et al., 2000). Anchoring and adjustment bias influences the approach of individuals to perceive likelihoods. Investors suffered from this psychological heuristic demonstrate influence of an arbitrary price levels and stay stick to these levels for valuation purposes (Northcraft & Neale, 1987; Tversky & Kahneman, 1974). This is particularly more applicable during the introduction of new information related to the security under consideration as it further complicates the situation. However, rational investors do not cling to a benchmark price and treat any new piece of information objectively. Anchoring and adjustment bias induces investors to perceive new information through a warped lens and put excessive emphasis on psychologically driven anchor points that are statistically arbitrary and, hence, decision-making departs from rational norms (Baker et al., 2019a; Pompian, 2006).
Current literature points that individuals carry a tendency to suffer from various behavioural biases that influence their decisions regarding investing activities, and individual-specific factors (demographic factors) may impact the propensity of an investor to suffer from these biases. The current study attempts to investigate whether income, experience, education and gender can forecast the tendency of an investor to suffer from representative bias, anchoring and adjustment bias, mental accounting bias and availability bias.
Data Description and Methodology
Measurement
A self-administered questionnaire consisting of four sections was used as a survey instrument for data collection purposes. Section 1 records the basic information of investors (name, age, education qualification, gender, family income and occupation). Section 2 measures financial literacy (10 questions) regarding various financial instruments, specifically equity shares. Questions included in this section are suggested by Van Rooij et al. (2011). Advance literacy score was calculated based on the option chosen by the respondent. As these questions are based on facts; therefore, choosing the right option for each question, respondents were given one point. Literacy score for each respondent is summation of all the points earned by him/her. Section 3 comprises of diagnostic tests to measure the stated biases (representative bias, anchoring and adjustment bias, mental accounting bias and availability bias). Each bias was measured through three diagnostic tests which were adopted from Pompian (2006) with some desired modifications. Respondents who demonstrated biased behaviour in two or more diagnostic tests were designated as biased and unbiased otherwise. Behavioural biases were measured on nominal scale. The last section contains 10 items to measure the neuroticism personality on a five-point Likert scale suggested by Goldberg (1992).
Sample Selection
This study employs survey method to collect responses. Client databases of brokerage houses in Delhi–NCR were used get contact information of active investors. Questionnaire was sent to 1000 millennial (born between 1981 and 1996) clients through e-mail. With constant follow up, we received 200 responses, in total. After eliminating incomplete responses and outliers, 113 responses were considered for final analysis.
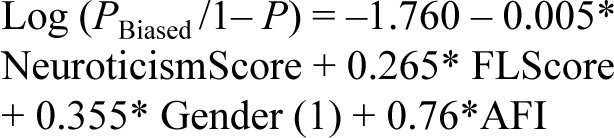
To attain the desired research objectives of the current study, binary logistic regression was applied to determine the impact of selected demographic variables (financial literacy and gender) and neuroticism trait of personality for predicting the membership of either of the two categories of dependent variable, i.e. biased or non-biased in case of the current study. In order to predict the probability of an investor falling in each group of two distinct categories of being biased or non-biased, four variables, namely, financial literacy, gender, income and neuroticism are considered as predictor variables. The current study uses standard, i.e. Enter Method for logistic regression. The logistic regression is based on the construct known as logit (natural logarithm (In) of odds). The log of the odds of biasness is a function of a constant, plus a series of weighed average of neuroticism personality trait, financial literacy score (AFLScore), gender and annual family income (AFI) as presented below:

where P is the probability of being in bias status (representative bias, mental accounting bias, availability bias and anchoring and adjustment bias).
Data Analysis and Interpretation of Results
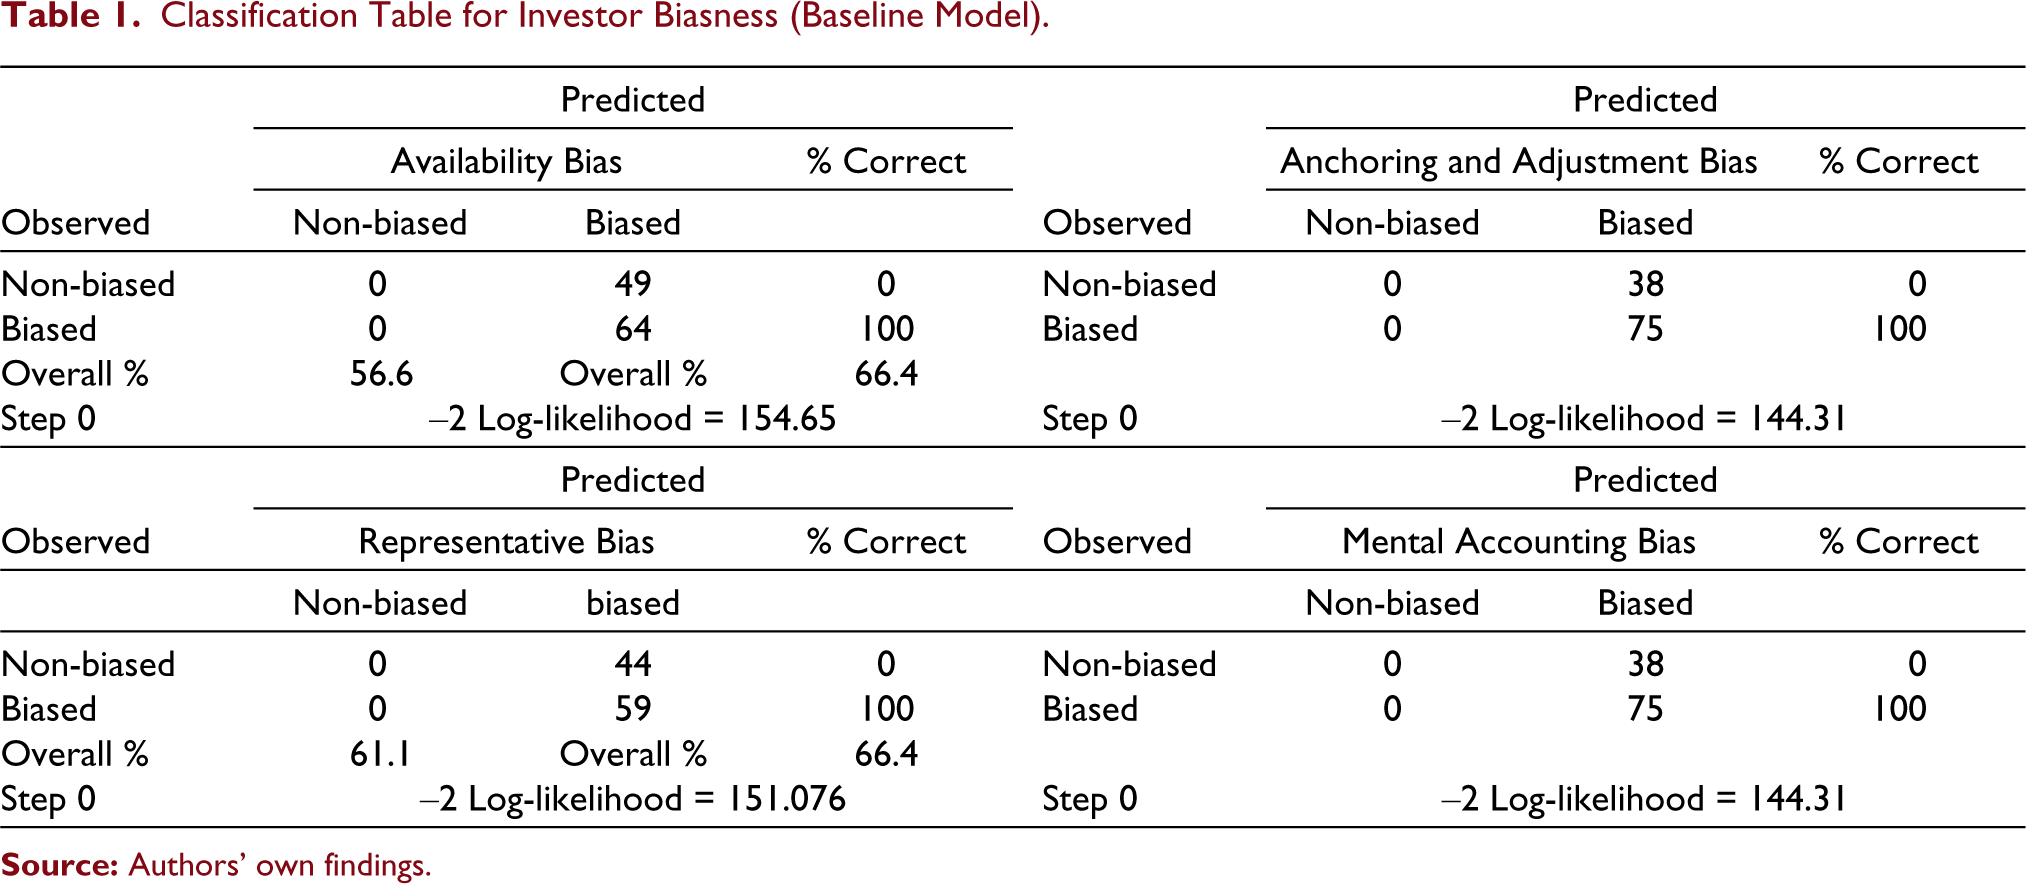
High model predictability for all the biases (as dependent variables) indicates that data are consistent and reliable for analysis. The baseline model (step 0) is derived with only the constant in the regression equation. The log-likelihood values of this initial model for availability bias, anchoring and adjustment bias, representative bias and mental accounting bias are 154.65, 144.33, 151.18 and 144.32, respectively. The larger values of log-likelihood reflect the existence of more unexplained observations in this model. This initial model of logistic regression assigns each subject to a single category of the outcome variable and predicts investor biasness (biased/non-biased) on account of the category that appears mostly in the given data set. The classification table reflects that majority investors in our dataset suffer with the behavioural biases under consideration for the current study. Therefore, the baseline model predicts all the investors to belong to biased category (refer to Table 1).
Classification Table for Investor Biasness (Baseline Model)
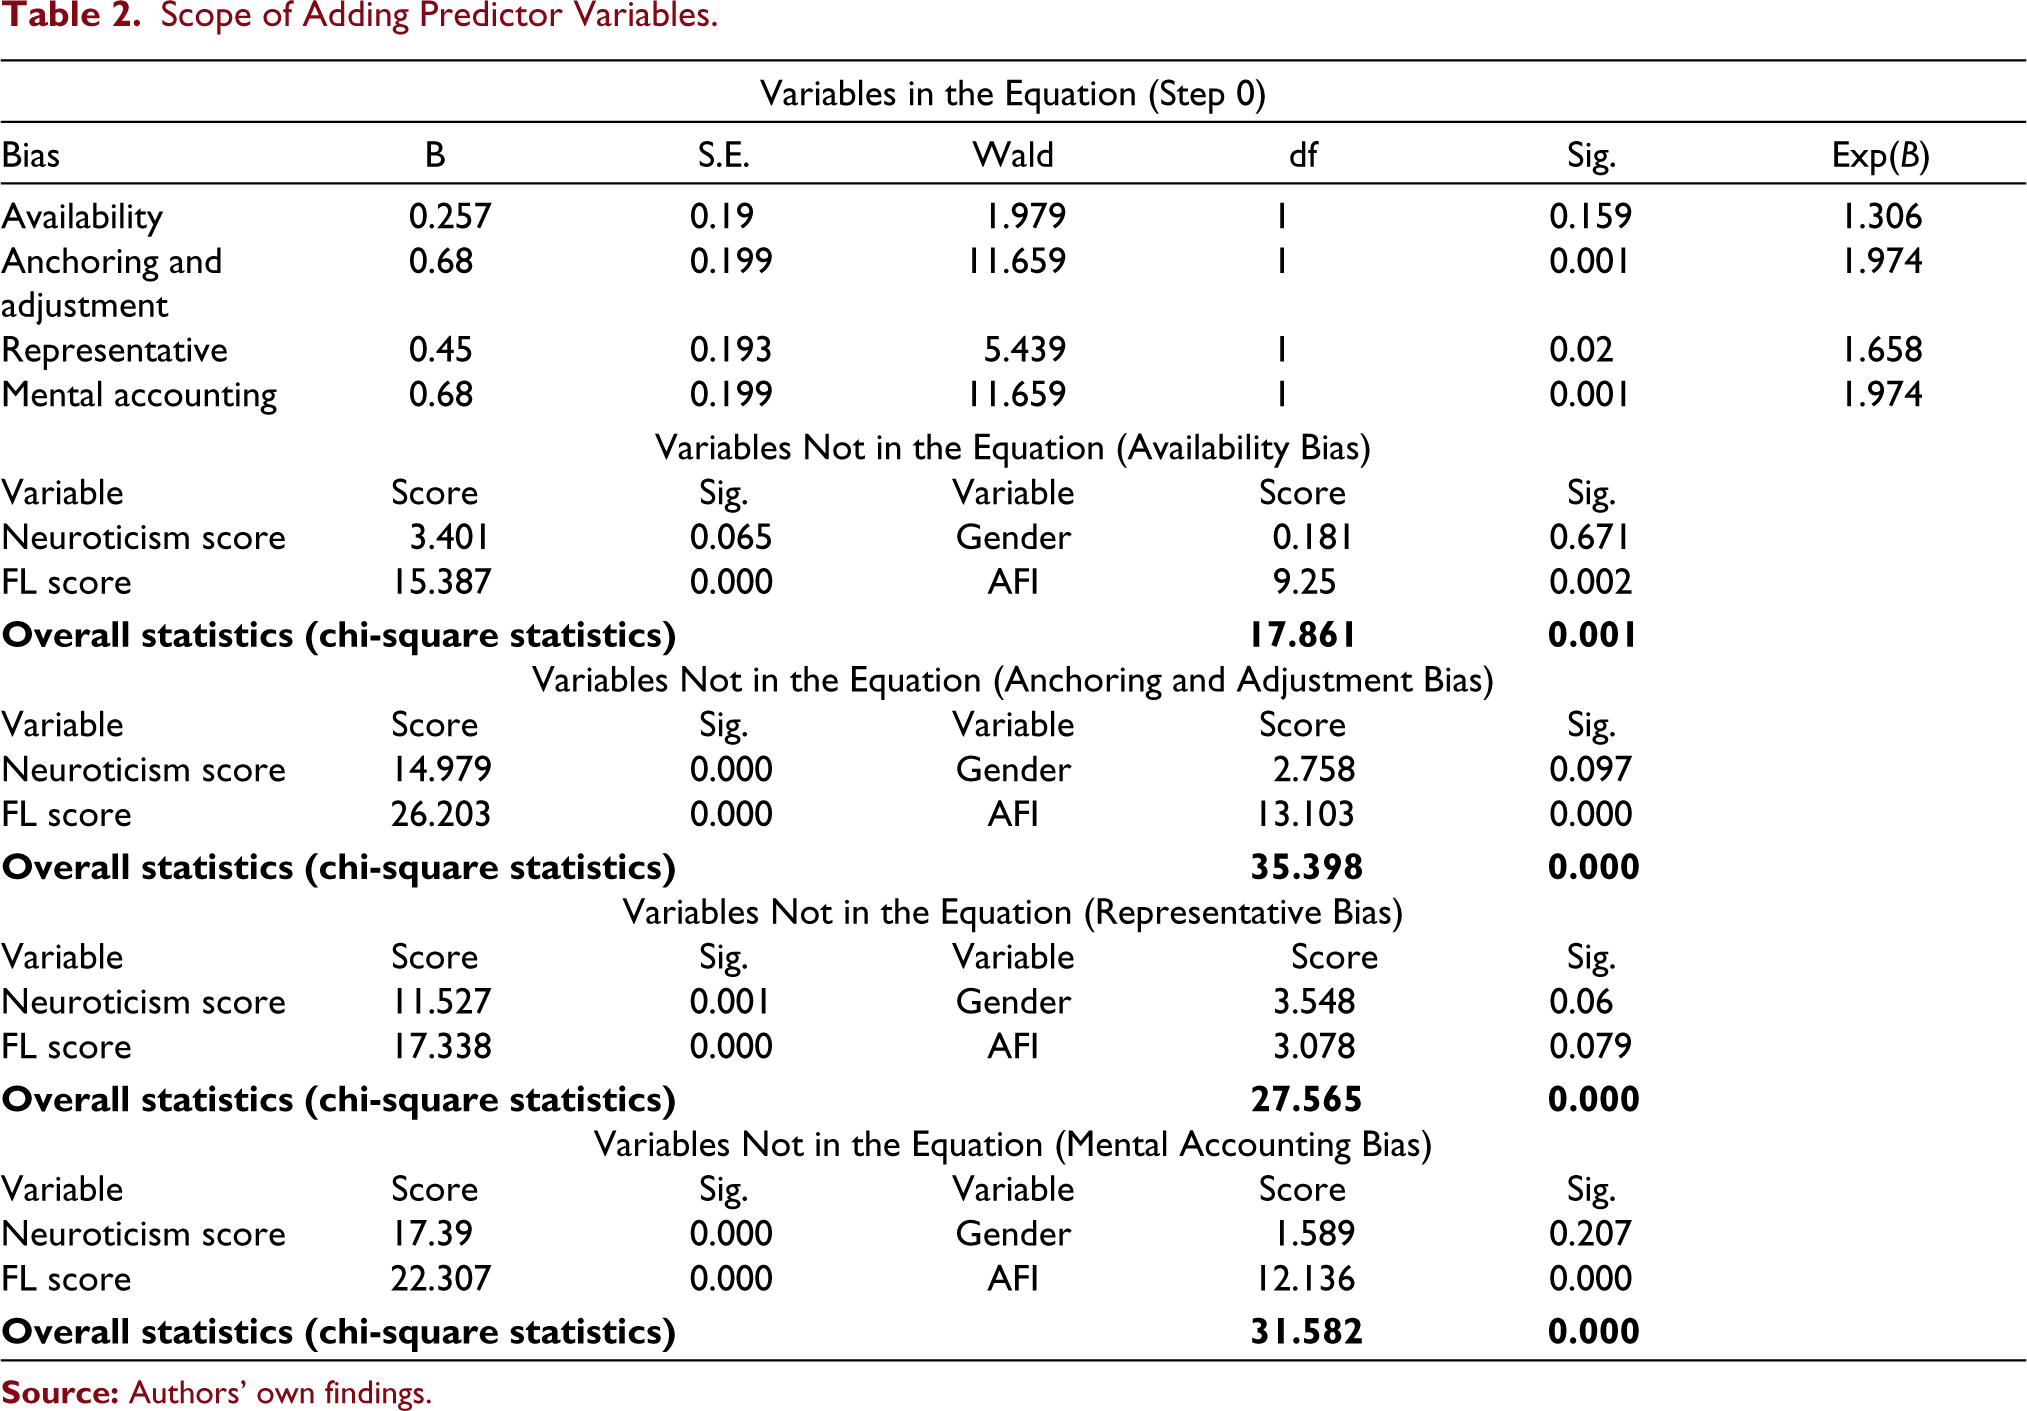
As mentioned earlier, the initial model does not consider any explanatory variables, and the values of constant are 0.257, 0.680, 0.450 and 0.680 for availability bias, anchoring and adjustment bias, representative bias and mental accounting, respectively. The P value (P < 0.000) of constant remains significant for all the biases except availability bias. A significant P values of constant points towards superiority of baseline model over the chance. Residual chi-square statistics that are statistically significant for all the biases indicate the scope of including more predictors to improve the prediction of the baseline model (refer to Table 2).
Scope of Adding Predictor Variables
The omnibus test of model (chi-square) coefficient indicates similar value for all three models because ‘enter method’ was used. It considers chi-square tests to check whether there is a significant difference between the log-likelihoods of the intercept only model and the new model. A significant reduction in –2LL for the new model indicates that the new model is the better one as it explains more variance in the outcome. Chi-square is highly significant (P < 0.000) for all the biases taken in the study. Hence, our new model (for each bias) is significantly better. The classification table also indicates that the new model (with predictors under consideration) correctly classifies (overall) 69.9%, 77%, 78.3% and 77% cases for availability bias, anchoring and adjustment bias, representative bias and mental accounting bias, respectively versus 56.6%, 66.4%, 61.1% and 66.4% for the taken biases (biases in the same order). The Hosmer and Lemeshow (H-L) test is the goodness of fit test. If H-L test statistics stand insignificant, we fail to reject the null hypothesis that there is no difference between observed and model predicted values, implying that the model’s estimates fit the data at an acceptable level. H-L statistics for each bias considered by the current study are statistically non-significant and therefore, our model (for each bias) is quite a good fit. Although there is no close analogous statistic in logistic regression to the coefficient of determination R-squared, the Model Summary Table provides some approximations. Cox and Snell’s R-square attempts to imitate multiple R-square based on ‘likelihood’, but its maximum can be (and usually is) less than 1.0, making it difficult to interpret. Here it is indicating that 16.5%, 35.7%, 24.1% and 32.6% of the variation in availability bias, anchoring and adjustment bias, representative bias and mental accounting bias (respectively), is explained by the logistic model (refer to Table 1). The Nagelkerke modification that ranges from 0 to 1 is a more reliable measure of the relationship between the predictors and prediction. Nagelkerke R-squared normally remains higher than the Cox and Snell measure. For availability bias, this value is 0.221, indicating that the independent variables account for 22.1% of the variation in outcome variable. Similarly, Nagelkerke R-square indicates a strong relationship of 49.5% for anchoring and adjustment bias, 32.6% for representative bias and 45.3% for mental accounting bias between dependent and independent variables (refer to Table 3).
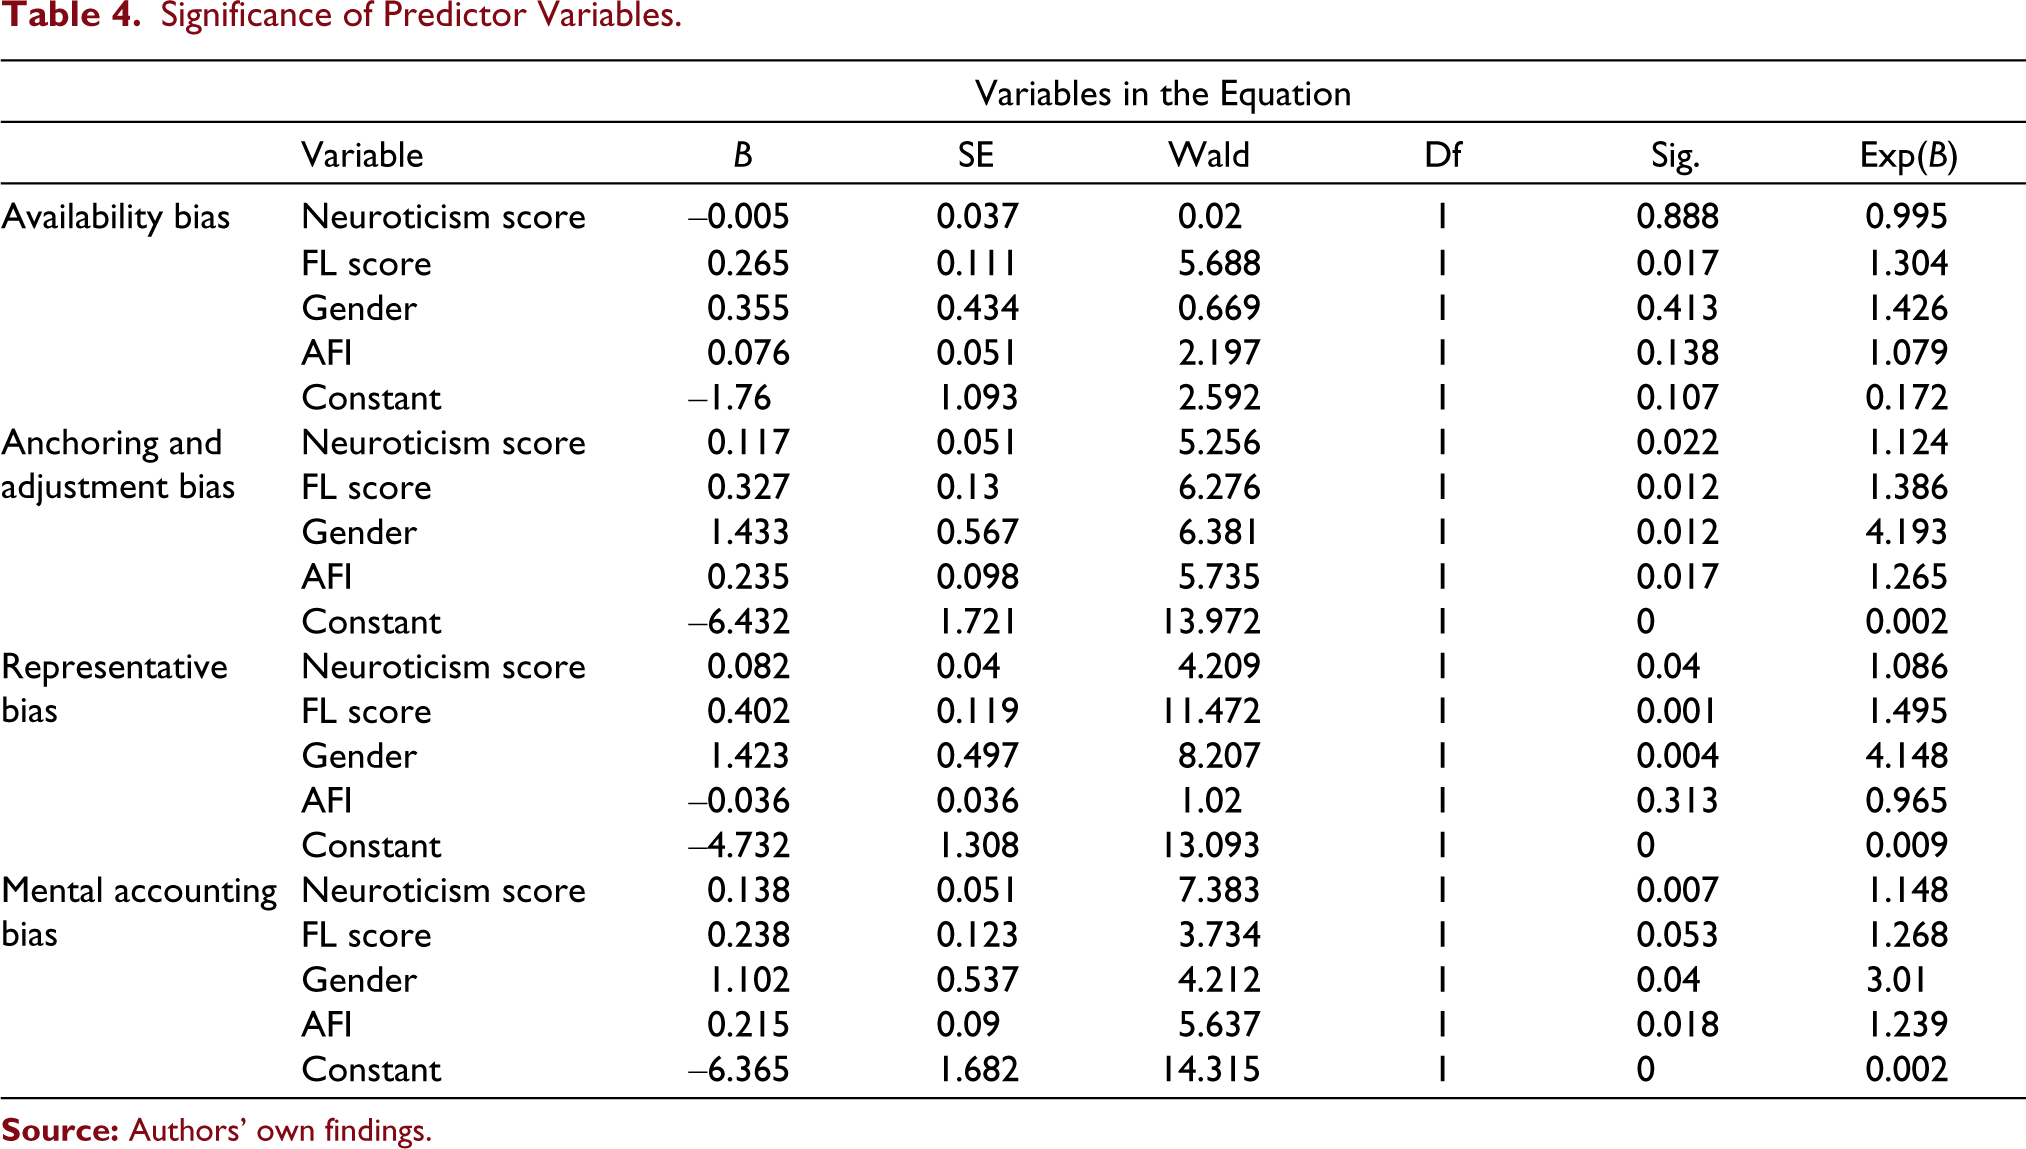
Contribution of Predictor Variables (Neuroticism Score, FL Score, Gender and AFI)
Table 4 is carrying the estimated regression coefficient (b) for each explanatory variable included in the model to assess the significance of these predictor variables while controlling other variables. These estimates demonstrate the relationship between the behavioural biases (independent variable) and neuroticism score, financial literacy, gender and AFI (dependent variables), where the dependent variable is on the logistic scale. The amount of increase (or decrease, if the sign of the coefficient is negative) in the predicted log odds of bias status = 1, would be predicted by one unit increase (or decrease) in the predictor, holding all other predictors constant. These values are in log-odds units, these coefficients are often challenging to interpret, so they are often converted into odds ratios.
Model Summary
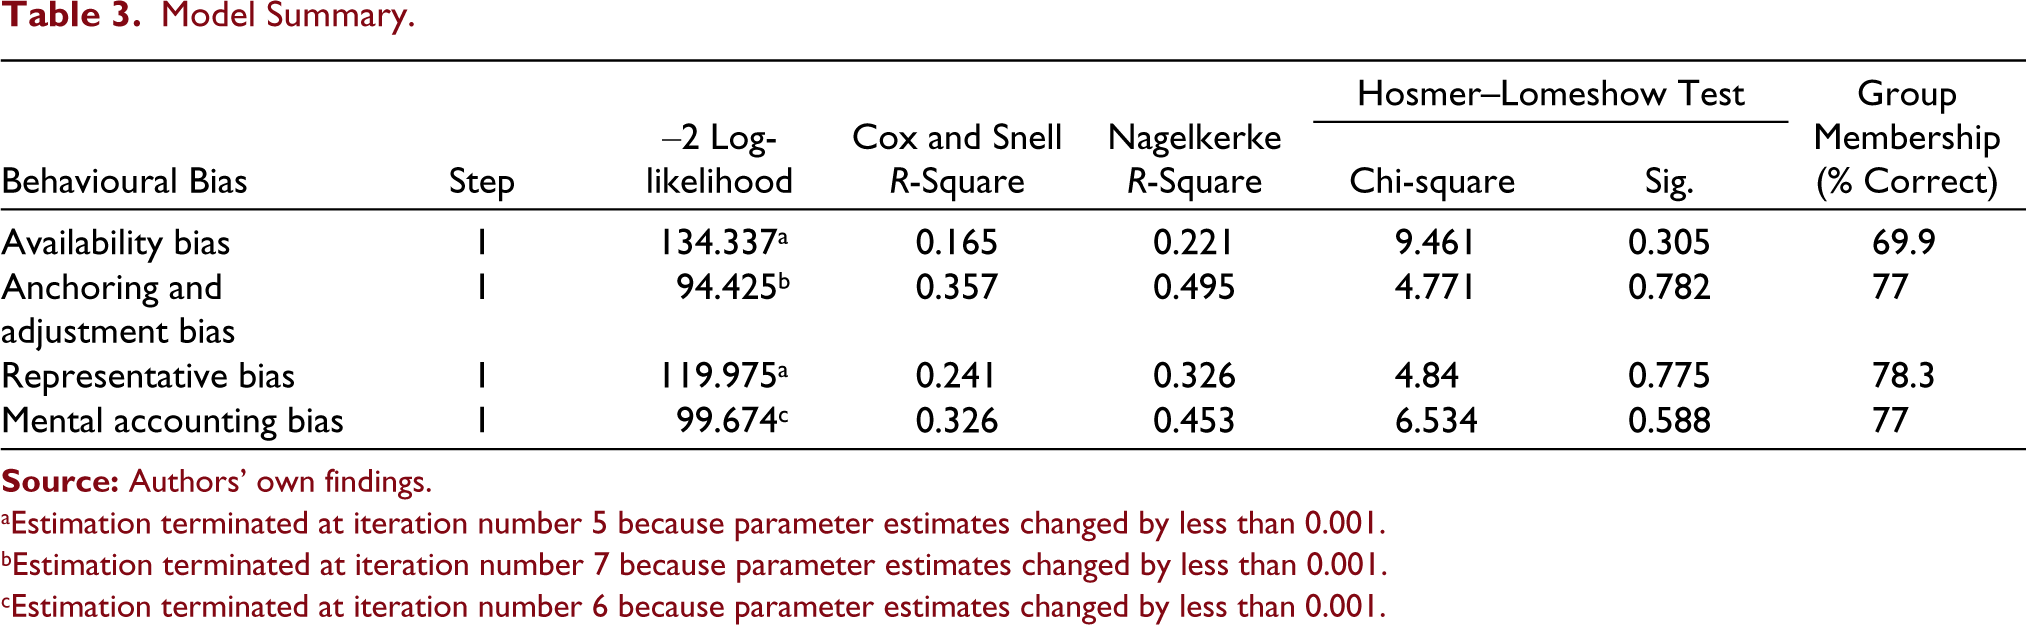
aEstimation terminated at iteration number 5 because parameter estimates changed by less than 0.001.
bEstimation terminated at iteration number 7 because parameter estimates changed by less than 0.001.
cEstimation terminated at iteration number 6 because parameter estimates changed by less than 0.001.
The logistic regression equation for availability bias is:
where P is the probability of suffering from availability bias status.
Regression coefficient for neuroticism score, gender and AFI is positive but insignificant. Hence, these variables do not contribute towards the prediction of the outcome variable. Regression coefficient for financial literacy is positive and significant. ‘Exp(B)’ indicates the exponentiation of the coefficient. The Exp(B) of FLScore (variable is significant) indicates that investors with one unit higher financial literacy score are 1.304 times more likely to exhibit availability bias. This indicates that with an increase in financial literacy, the probability of being availability bias increases (refer to Table 4).
Significance of Predictor Variables
The logistic regression equation for anchoring and adjustment bias is
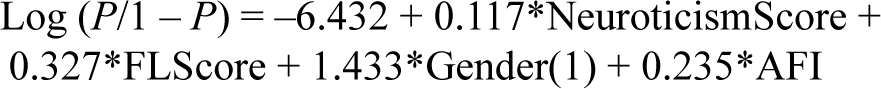
where P is the probability of being in anchoring and adjustment bias status.
For anchoring and adjustment bias, regression coefficient values of all the independent variables are positive and significant (refer to Table 4). Female investors are 4.193 times more likely to demonstrate anchoring and adjustment bias in their investment behaviour. Investors with one unit higher score of neuroticism, financial literacy and belong to one unit higher AFI group are 12.4%, 38.6% and 26.5% more likely to demonstrate anchoring and adjustment bias.
The logistic regression equation for representative bias is
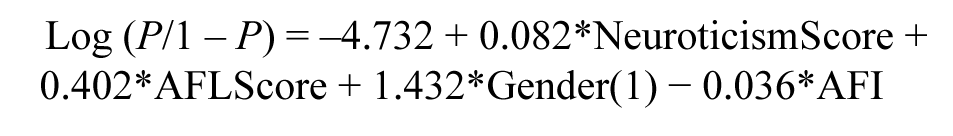
where P is the probability of being in representative bias status.
Regression coefficients for neuroticism, financial literacy and gender are positive and significant. Female investors are 4.148 times more likely to suffer from representative bias than their male counterparts. Increase in neuroticism score by one unit in investor personality is likely to boost the chances of sufferance from representative bias by 8.6%. Similarly, an upward movement in financial literacy by one unit is expected to substantially increase the chances of investors falling in representative bias category by 49.5%. AFI is found to be an insignificant predictor for this bias.
The logistic regression equation for mental accounting bias is
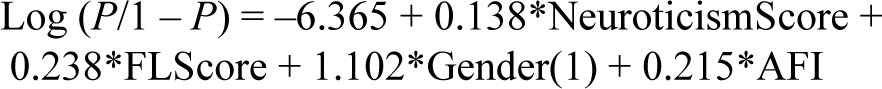
where P is the probability of being in mental accounting bias status.
For mental accounting bias, regression coefficient values for neuroticism, gender and AFI are positive and significant. Female investors are 3.010 times more likely to belong to the biased group than male investors. Similarly, investors are 23.9% and 14.8% more likely to demonstrate mental accounting bias with one unit increase in AFI and neuroticism score, respectively.
Discussion and Conclusion
The current study attempts to explore neuroticism, gender, AFI and financial literacy as predictor variables in context of availability bias, representative bias, anchoring and adjustment bias and mental accounting bias. Logistic regression method is used to analyse the data as these biases (independent variable) are measured on logistic scale. Results indicate that model with dependent variables (for each bias) carries better explanation of variance in dependent variable. Hence, model with independent variables offers a significant improvement over the baseline model (with intercept only).
Only one variable (financial literacy) is found to be significant for availability bias. However, all the four independent variables (financial literacy score, AFI, neuroticism score and gender) stand contributory for anchoring and adjustment bias. For representative bias, neuroticism, gender and financial literacy are observed to be significant. However, results indicate that three out of four variables considered under the current study (neuroticism, gender and AFI) significantly contribute towards predicting presence of mental accounting bias.
Financial literacy is found to be contributory for availability bias, representative bias and anchoring and adjustment bias. Neuroticism stands relevant for representative bias, anchoring and adjustment bias and mental accounting bias. Gender is observed to be significant in context of representative bias, anchoring and adjustment bias and mental accounting bias. However, AFI significantly contributes to anchoring and adjustment bias and mental accounting bias.
Regression coefficient values of significant variables in context of selected behavioural biases are positive, which indicate a positive relationship between dependent (presence of selected biases) and explanatory variables (AFI, neuroticism, financial literacy and gender). Higher level of neuroticism and AFI leads to increasing probability to suffer from mental accounting bias among investors. Greater wealth leads to inability to treat money as fungible as mounting wealth may lead to lower value of money. Our findings also support the finding of studies conducted by McInish (1982) and Lo et al. (2005). These studies observed the influence of neuroticism on investment behaviour of individuals. Female investors exhibit poor application of basic calculation (Lusardi & Mitchell, 2007; Lusardi & Mitchell, 2008), and mental accounting is a consequences of confusion arising due to base versus case data and poor application of basic calculation (Filbeck et al., 2017). Hence, female investors demonstrate higher tendency to suffer from mental accounting bias.
Higher neuroticism and financial literacy trigger the probability of representative biasness among investors. Representative bias plays a role in assessment of subjective possibilities (Kahneman & Tversky, 1973) and often results into asset mispricing (Lakonishok et al., 1994). Representative biased investors tend to perceive probabilities, which are in sync with their own pre-existing notions despite of statistical inaccuracy of the conclusions drawn from such process (Pompian, 2006). Investors usually indulge into such behaviour in order to avoid the diligent research required for taking investment decisions. This indicates that representative biased investors demonstrate a stereotyped behaviour. This finding is similar to findings of earlier studies (Bolger, 1990; Costa & McCrae, 1992; Noguchi et al., 2006), which suggests that individuals with high degree of neuroticism are likely to pay more attention to negative news than to positive news as such individual may perceive that bad news impacts the market more intensely than the positive events.
Financial literacy is likely to transform individuals into better investors (Van Rooij et al., 2011). On the contrary, our results suggest that higher financial literacy results into higher probability of representative biasness among investors. However, individuals with higher level of financial literacy are more likely to become overconfident investors and believe themselves to possess higher capabilities to create wealth than other investors (Allgood & Walstad, 2016; Barber & Odean, 2001; Odean, 1998). This type of stereotyped behaviour which is originating from high financial literacy is similar to what representative biased investors demonstrate. Female investors are more prone to this bias. This finding is similar to results of earlier studies (Croson & Gneezy, 2009; Eckel & Grossman, 2008; Gong & Yang, 2012), which highlights a particular pattern in the behaviour of female investors.
Female investors, individuals with higher AFI, neuroticism and financial literacy contribute towards propensity of individuals to suffer from anchoring and adjustment bias. Investors suffered from this psychological heuristic demonstrate influence of an arbitrary price levels and stay stick to these levels for valuation purposes (Northcraft & Neale, 1987; Tversky & Kahneman, 1974). Investors exhibit this particular bias by way of selecting a benchmark price and then further making adjustment in it for decision-making purposes. An individuals’ ability or willingness to hunt for more precise estimates tends to bring down the degree of adjustment-based anchoring biases (Epley & Gilovich, 2006). Incentives of being accurate in decision-making and providing warning to participants regarding anchoring effects also add to bringing down this bias (Epley & Gilovich, 2006). Individuals with higher family income may become less careful and have lower willingness to make precise estimates during investment decision-making process and demonstrate anchoring and adjustment bias. The current study concludes that increase in financial literacy lifts the degree of anchoring and adjustment bias, which is contrary to the findings of Epley and Gilovich (2006). Females (Croson & Gneezy, 2009; Eckel & Grossman, 2008; Gong & Yang, 2012) and high neurotic individuals are risk averse investors and, therefore, are more likely to make inappropriately conservative adjustment to the anchor level and are more likely to demonstrate this bias.
The current study puts forward that higher financial literacy score enhances the probability of being suffered from availability bias among investors. Investors suffer from this bias and over-consider the information that is easily available, can be recalled from memory and resembles to a future situation that is easy to visualize (De Bondt et al., 2008). Individuals who possess higher level of financial literacy rely more on financial magazines and newspapers (Van Rooij et al., 2011). Therefore, such individuals are more likely to demonstrate availability bias by considering the most recent information (about the stocks under consideration) covered by newspapers and financial magazines.
Managerial Implications and Future Directions
Findings of the current study have important implications for investment advisors and investors. Representative bias results into overreaction of investors towards past growth trends and asset mispricing (Lakonishok et al., 1994). Individuals who suffer from mental accounting bias may end up committing systematic errors (Zhang & Sussman, 2017). Mental accounting bias can cause investors to damage their principal, construct an undiversified portfolio when company stock is offered, fail to treat all money as fungible and make wrong judgements about exiting from stocks that generated good return in the past followed by a price drop (Pompian, 2006). Availability bias results into an overreaction of investors towards current market conditions and into erroneous investment decisions (Pompian, 2006). Anchoring and adjustment bias induces investors to perceive new information through a warped lens and put excessive emphasis on psychologically driven anchor points that are statistically arbitrary and, hence, decision-making departs from rational norms (Pompian, 2006). Hence, it is clear that these biases harm investor in a variety of ways. The current study provides important insights regarding how gender, financial literacy, neuroticism and AFI contribute towards probability of an investors’ tendency to suffer from availability bias, anchoring and adjustment bias, representative bias and mental accounting bias. The current study guides investment advisors to ascertain the propensity of an investors’ of being biased from the selected biases by collecting information about investors’ gender, neuroticism, financial literacy and AFI. This will help investment advisors to devise strategies to reduce or eliminate the harmful effects of these biases on the investment process of their clients. Better investment decisions have a spillover effect on profits and inclination of investors towards investing in equity. The current study makes it more explicit that given certain demographic characteristics of their clients what an advisor can primarily assume about their clients. Hence, it saves both time and efforts to spot the biases the client is suffering from. Once the existence of a bias is confirmed, investment advisors can win over their clients suffering from certain biases by making them via:
supplementing the desired information to help them in resetting their anchor price and bringing more mindfulness in making adjustments to decide entry and exit prices for a stock (to counter the damaging effect of anchoring and adjustment bias); demonstrating to the clients that how a comprehensive analysis (in terms of data spread as well as factors) can lead to choose a more appropriate stock (to counter the damaging effect of representative bias); making the correlations between various assets more explicit, demonstrating to them that maximizing total returns is important, saving them from falling prey of house money effect, destroying principle for interest income by providing appropriate information (to counter the damaging effect of mental accounting bias), suggesting clients goal based planning (to leverage upon the mental accounting bias); educating investors to avoid over reacting to current market condition and emphasizing to engage in disciplined research and not get influenced by media coverage (to counter the damaging effect of availability bias).
Therefore, the current study has important implication to enhance participation of retail investors into capital market also. The current study suffers from the limitation of small sample, focuses upon respondents from Delhi–NCR; hence, current work can be extended to cover a broader base to respondent; to explore variations in personality type and financial literacy in different parts of the country and predictability of these factors for a set of behavioural biases across regions. Further, the present study has taken into account four cognitive biases and four explanatory variables. This study can be extended to more biases in cognitive and emotional bias category by considering more explanatory factors. The current study does not look into the interactions of the taken variables. Experimental studies are taken as more reliable. However, we have used survey method for data collection.
Footnotes
Declaration of Conflicting Interests
The authors declared no potential conflicts of interest with respect to the research, authorship and/or publication of this article.
Funding
The authors received no financial support for the research, authorship and/or publication of this article.