
Abstract
The current study compares trade performance between India and China during COVID period (January–December 2020). The merchandise trade and commercial service exports and imports from both countries were obtained from the official World Trade Organization website to compare the output (deviation of actual from projected during COVID-19) of India and China’s foreign trade with the rest of the world. The present study employs models of autoregressive integrated moving average using a three-step model creation process. As per the results obtained, we can conclude that India is behind China in achieving the amount of merchandise exports and imports in relation to the output of its previous years, while China’s variance between expected and real is relatively lower. When comparing service exports and imports, it can be found that the gap between service exports is not much, but in the case of service imports, China’s deviation from India is much greater.
Keywords
Introduction
In the current pandemic, the global economy is expected to contract by 3% as quarantines and lockdowns cripple output, even worse than during the financial crisis of 2008–2009, as mentioned in the World Economic Outlook report recently published by the International Monetary Fund (IMF). The World Trade Organization (WTO) stressed ‘As the COVID 19 pandemic disrupts normal economic activity and life across the world, world trade is projected to plunge by between 13% and 32% in 2020’ (WTO, 2020). By comparing a number of different lockdown speeds, studies show that the economic impacts of COVID-19 are responsive to the pace at which lockdown restrictions are enforced globally (Guan et al., 2020). In this situation, the first major economy to shut down to combat the virus was China, where the pandemic started in December 2019, and also the first to begin the battle to restore normal economic activity after the ruling Communist Party claimed victory over the epidemic in March. China’s foreign trade was affected during the most grievous time of combat against COVID-19 in the first quarter of 2020. Later, in April and May, while the domestic economy was rebounding rapidly, foreign trade was still under pressure as the pandemic spread to many of China’s trading partners. The exports from China were also contracted. It is also an outcome that underlines the permanent position of the nation in development, even in the midst of simmering tensions with the USA, which have sparked talk of changing supply chains.
A reshaping of the global supply chain was on the cards, with companies searching for alternative supply choices, with the current instability in China and with some countries planning to pull their businesses out of China. India has already earned the reputation of being a responsible and trustworthy nation with efficient and participatory governance in these times of crisis. India’s response to the pandemic was swift and prudent. Knowing the severity of an uncontrolled outbreak, the government took a timely decision on a full shutdown to carry out social distancing effectively. The impact of COVID-19 was everywhere; even in the education institutions, and the future strategies, challenges and long-term plans to combat such crisis began to be discussed (Rana et al., 2020a). The efforts to revive the domestic economy are in the right direction; we can also simultaneously begin to look at the effects of the crisis on international trade and investment and the lessons that India can learn to devise its future trade and investment strategy. During this turbulence period, international trade and investment are directly affected. According to WTO, ‘In 2020, world trade is expected to decline as COVID 19 pandemic disrupts normal economic activity and worldwide life’. With this kind of prediction, in the near future, the prospects for global trade and investment look rather bleak. Economies diversified as regards export baskets will suffer less compared to those reliant on fewer products. Similarly, countries that depend heavily on the travel, hospitality and entertainment sectors will also be lagging behind other recovering countries due to significant disruptions in these sectors. The heavy reliance of the USA on China and India for pharmaceutical drugs had disrupted the US drug supply during this period and resulted in shortages, as a large number of Chinese drug factories shut down during the coronavirus outbreak. Although India is the world’s largest supplier of generic medicines, it imports a significant portion of active pharmaceutical ingredients from China, thereby raising its dependency on China.
This motivates India to put an effort to improve its competitiveness in areas with export potential that can become essential components of the global value chain. Certain studies discuss the competitiveness of Indian industries (textile industries and products) and suggest that export competitiveness needs to be addressed for sustaining in global marketing environment (Dhiman et al., 2020b). Several studies suggest that India can also utilize its trade competitiveness with its neighbouring trading block where it can make the benefit from similar cultural environment. In the multicultural global climate, Rana et al. (2020) have suggested four powerful factors for useful impact estimation. These variables are sources of beneficial effects, operating efficiency, strategic option for foreign marketing and beneficial outcomes (Sharma & Shrivastava, 2021a). In the light of this backdrop, the current study contrasts the success of Indian and Chinese foreign trade with the rest of the world.
Considering all of the above which shows an opportunity for India to improve in terms of global trade, as China is no longer a trusted venue on the world market, we would like to make a comparison of merchandise and service trade in the COVID-19 era to understand India’s increased share in this time as compared to China. The analysis is categorized into six parts. The second section presents the theoretical framework on the subject. The third section provides the details of the methodology and describes the data used for analysis. The fourth section discusses the validity of research along with the empirical findings and explanations thereof. The fifth section discusses the threat to validity of the current work. Finally, the sixth section identifies the outcome of the analysis undertaken, its implications and future research directions.
Theoretical Framework
After its independence in 1949, China’s economy has remained largely closed to the rest of the world, but it has begun to open up its economy since the late 1970s and early 1980s. Since then, China has begun to achieve double-digit growth rates, partly fuelled by the rapidly increasing commercial market. China has been continuously changing its trading structures with its fast-growing international trade (Caporale et al., 2015). China’s economy is globally linked via trade, investment and tourism, and any slowdown or ongoing travel and transportation constraints are likely to place pressure on global supply chains and potentially generate global economic fallout. Several studies have been conducted to assess the effect of COVID-19 on China’s economy because of the large contribution of China’s economy to the global economy (Liu et al., 2020; Maffioli, 2020; Vasiev et al., 2020). In 1991–1992, India embarked on an ambitious programme of economic reform to turn its centrally planned, inward-looking economy into a market-driven economic system focused on export-led development. (Haralambides & Behrens, 2000) also explored India’s competitiveness in global trade. Indian manufacturing industries are already going through a phase of transformation, and studies also indicate the accelerated actions of the Government of India towards making more policy decisions to make Indian firms more globalized (Rana et al., 2018). This is the right time for Indian industries to make their mark in the global market. While both economies start their economic recovery at different periods of time, both economies are competitive and have important positions in the global market.
Both China and India have huge populations and economies that are increasing rapidly. At current exchange rates, they now account for almost 5% and 2% of the global gross domestic product (GDP), respectively. If we extrapolate their recent growth rates over half a century, we would find that China and India, the giants, are among the world’s largest economies (Winters & Yusuf, 2007). Dahlman (2011) also concentrated on India and China’s relationship with the global system and found that both countries have their own strategies and are equally competitive in the global arena. Hölscher et al. (2010) also studied the competitiveness between India and China in relation to international trade. The study also examines how regional economic integration influences trade in COVID-19 products, and it identifies a range of factors that are crucial for positive trade between the two countries (Uttama, 2021).
Khan and Ahmad (2017) analysed the export pattern and competitiveness of India–China in global and bilateral market. The emerging Chinese and Indian multinationals (Pradhan, 2017) dealt with the root and development of outward foreign direct investment (OFDI) and investigated the locational determinants of such investment. Quer et al. (2017) argue on the influence of host country’s institutional factors on location. In their study, Li and Zhang (2018) empirically analyse the contrast of the international competition between China and the manufacturing industries of India by drawing up specific indicators.
Zhao et al. (2018) compared domestic value added differences between China and the USA, Japan, Korea, and India based on generalized logarithmic mean divisia index by considering value-added coefficient effect, effect of input–output structure, effect of domestic scale and effect of international scale. Ahmad et al. (2018) studied India and China’s short- and long-term trade patterns using the revealed comparative advantage (RCA) and bilateral RCA; this study specifically attempts to identify export patterns and specialization areas of the economies under investigation. Dwesar and Kesharwani (2019) examined the intensity of intra-industry trade (IIT) between India and China using the A-Index over a period of two decades (1999–2018). Using 99 commodity data of 10 years, the study also investigates trade trends of commodities moved between countries and how they have changed over time.
Several studies have investigated the impact of COVID-19 on international trade of counties Gruszczynski (2020), Kerr (2020), Barichello (2020), Vidya and Prabheesh (2020), Baldwin and Tomiura (2020), and Sharma and Shrivastava (2021) have studied the negative impact of COVID-19 on international demand of tradable goods and services and future of trade in G7 plus China. Mandal and Mandal (2020) compared the COVID-19 data from India with China and rest of the world. Alon (2020) studied the impact of COVID-19 on international business and globalization. Gereffi (2020) investigated the requirement for change in the global medical supply value chains and the impact of current pandemic on the same. Recently, Nag and Puniani (2021) analysed the trend of export and import between India and China during post-COVID era. Their study focusses on the global value chain participation of India and China.
From the conclusive summary of related literature, A large gap can be seen in the final synthesis of connected literature to provide a scope for the study on the presented issue, which is the comparison of India and China’s international commerce with the rest of the globe. The gap can be used to create dynamic autoregressive models of merchandise and service imports and exports of both the countries. Therefore, the present study intends to make some conclusive contribution to the trade performance comparison of both the countries in the current COVID-19 context.
Descriptive Data and Analytical Framework
To compare the performance (deviation of actual from estimated during COVID-19) of international trade of India and China with the rest of the world, data pertaining to the merchandise trade and commercial service exports and imports of both the countries have been obtained. The data have been taken on a monthly basis starting from January 2013 to December 2020. The data pertaining to commercial service exports and imports of China could be obtained from January 2015; hence, the study extrapolates China’s commercial service imports and exports on the basis of available data. The data have been sourced from the official website of WTO. The data from the period ranging from 2013 to 2019 have been used for developing the predictive model using autoregressive integrated moving average (ARIMA) model, and the data pertaining to the remaining 12 months (January 2020 to December 2020) have been used to compare the performance of the countries by calculation of deviation between estimated and actual trade.
The Variables
The following data have been collected from the official website of WTO:
Econometric Model Building
When the time series forecast is to be done on the basis of its own previous values, lags, and lagged forecast errors, the Box-Jenkins method or ARIMA are popular models. The econometric modelling through ARIMA includes the following steps:
Step 1: Identification of a Suitable Model
Model identification (to find the order p, d, q) is the first step in constructing the ARIMA model.
p denotes the number of autoregressive terms;
d denotes the number of differencing done to make series stationary; and
q denotes the number of lagged forecast errors in the prediction equation.
According to George P. Box and Gwilym Jenkins, these models work on both stationary and non-stationary (made stationary after differencing) time series. Hence, the first stage in ARIMA model building involves checking the stationarity of times series.
There are a number of tests available to check the stationarity of time series data, but the current study uses augmented Dickey–Fuller (ADF) and Philips–Perron (PP) test to check the stationarity of series. Both ADF and PP are sometimes unable to reject the null hypothesis about non-stationarity; hence to confirm stationarity of the results, the study also employs the Kwiatkowski–Philips–Schmidt–Shin (KPSS) unit root test. This practice of combined use of unit root (ADF and PP) and stationarity (KPSS) tests is known as confirmatory data analysis (Brooks, 2002). Here, it is to be noted that the first two tests have null hypothesis about non-stationarity, but KPSS test has null hypothesis about stationarity of the series. Trend plots of trade series (export and import data of merchandise and service trade) also have been created to check the stationarity in the series. The number of series’ differencing necessary to make the series stationary is used to determine the value of d.
Step 2: Estimation Through Model
The second stage in identification involves finding suitable values of p in AR and q in MA terms. To find the lags of AR and MA, the plots of correlogram (Autocorrelation function [ACF]) and partial correlogram (Partial autocorrelation function [PACF]) of stationary series have been created. The plots show the values of p and q that were used to create prediction models for trade data (export and import series).
Step 3: Diagnostic Checking of Models
For diagnostic checking of models, forecast errors (residuals) have been plotted; to investigate the correlation between successive forecast errors (residuals), correlogram (ACF) and partial correlogram (PACF) have been created; and to check whether the residuals are white noise or not, Box–Jung test has been conducted.
Empirical Results
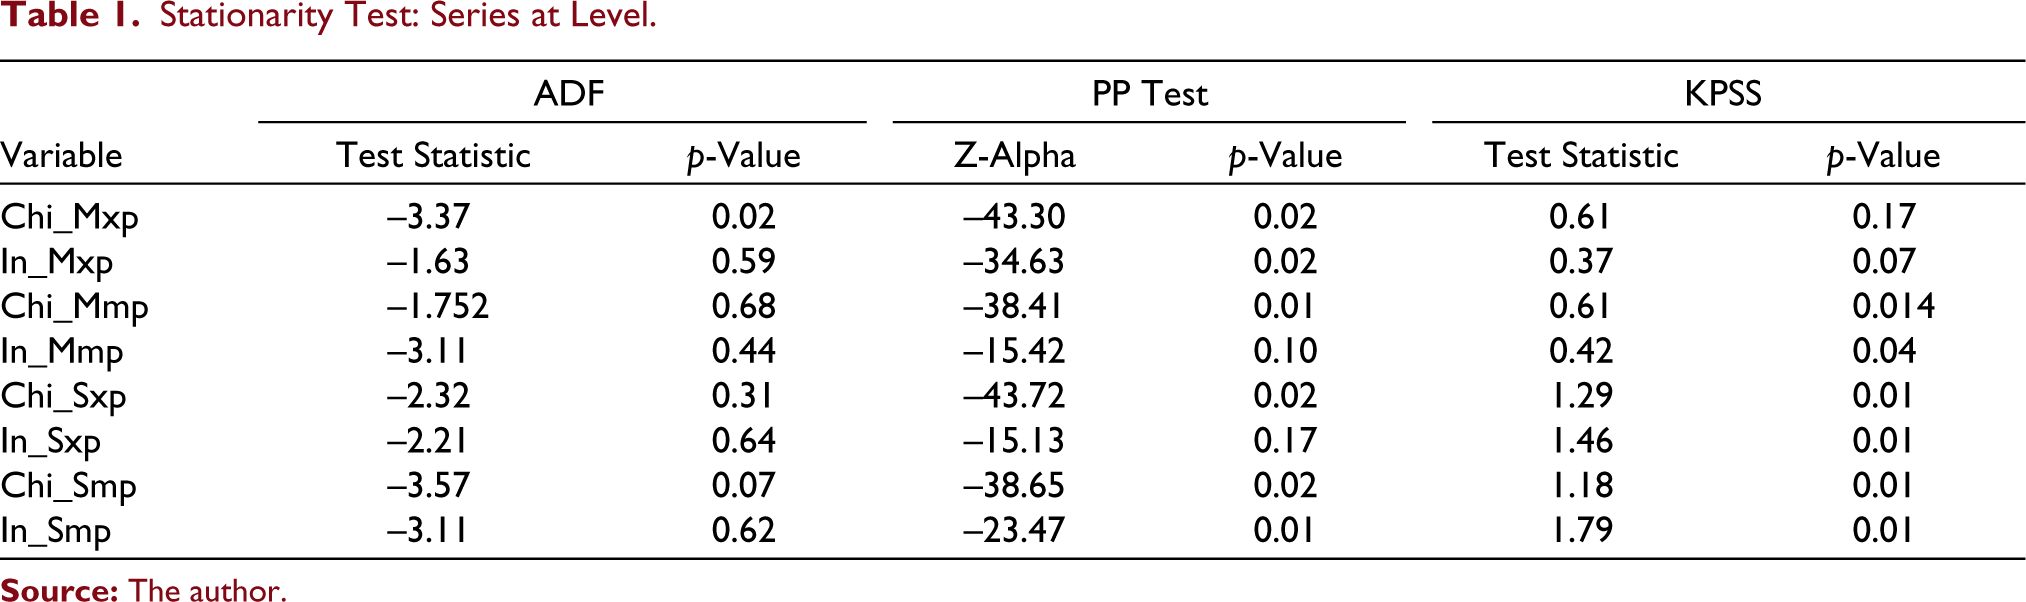
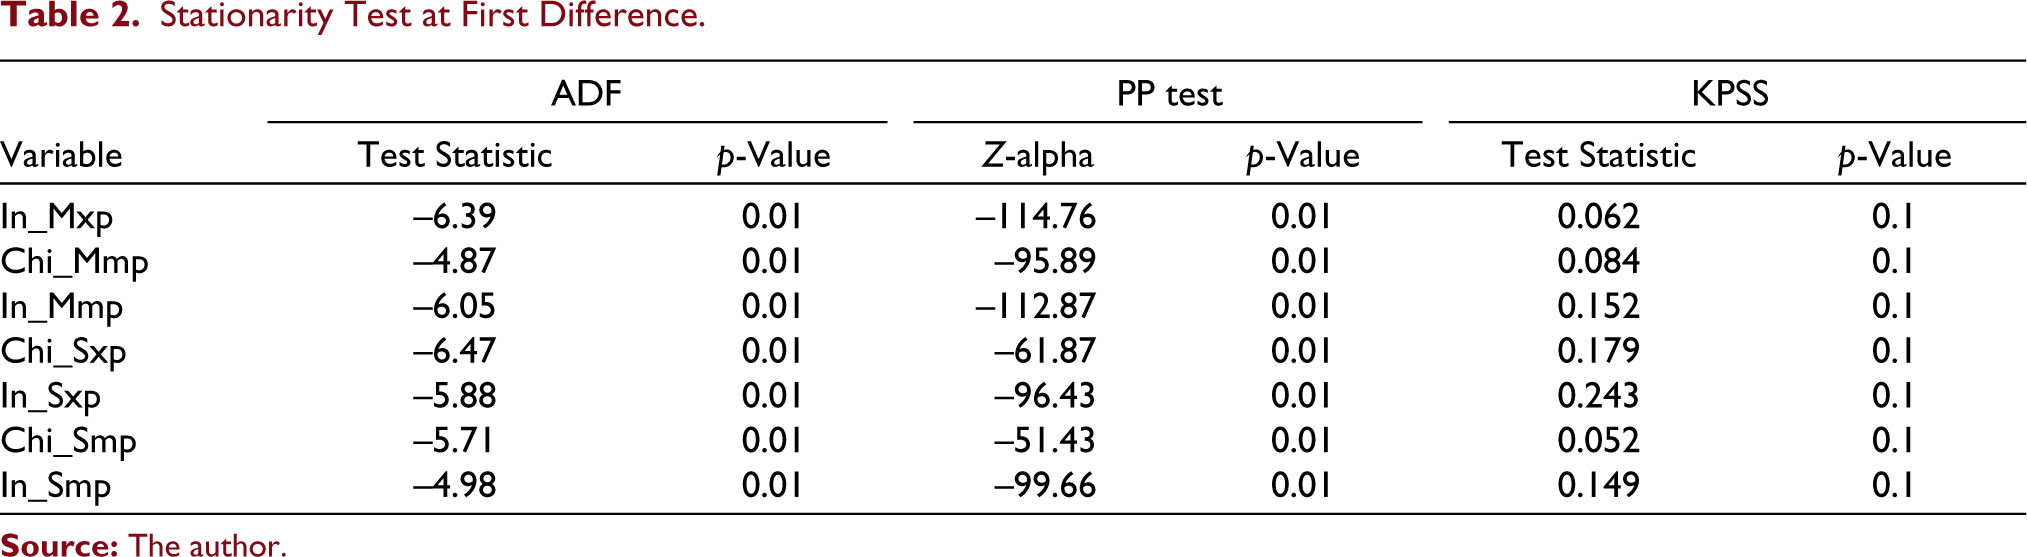
Tables 1 and 2 show the results of ADF unit root test, PP test and KPSS unit root test. Table 1 presents the unit root test results at level, while Table 2 shows the results at first differencing. Both the figures and tables confirm the non-stationarity of our seven series at level and stationarity at first differencing. Only the time series of China’s merchandise exports is stationary at level (As per test values). Hence, order (d = 0) can be accepted for China’s merchandise exports. While order (d = 1) can be taken for remaining series. On observing the results of PP test, it can be noticed that the null hypothesis about non-stationarity of series is rejected even at level in case of India’s merchandise trade, China’s merchandise imports, China’s commercial service exports, China’s commercial service imports and India’s commercial service imports, but the other two tests confirm non-stationarity at level; hence the series have been differenced once to make them stationary.
Stationarity Test: Series at Level
Stationarity Test at First Difference
Figures 1–16 present the correlogram (ACF) and partial correlogram (PACF) plots of differenced times series for lags 1 to 20. As per the results of ACF and PACF plots, the p and q orders for ARIMA models have been selected.
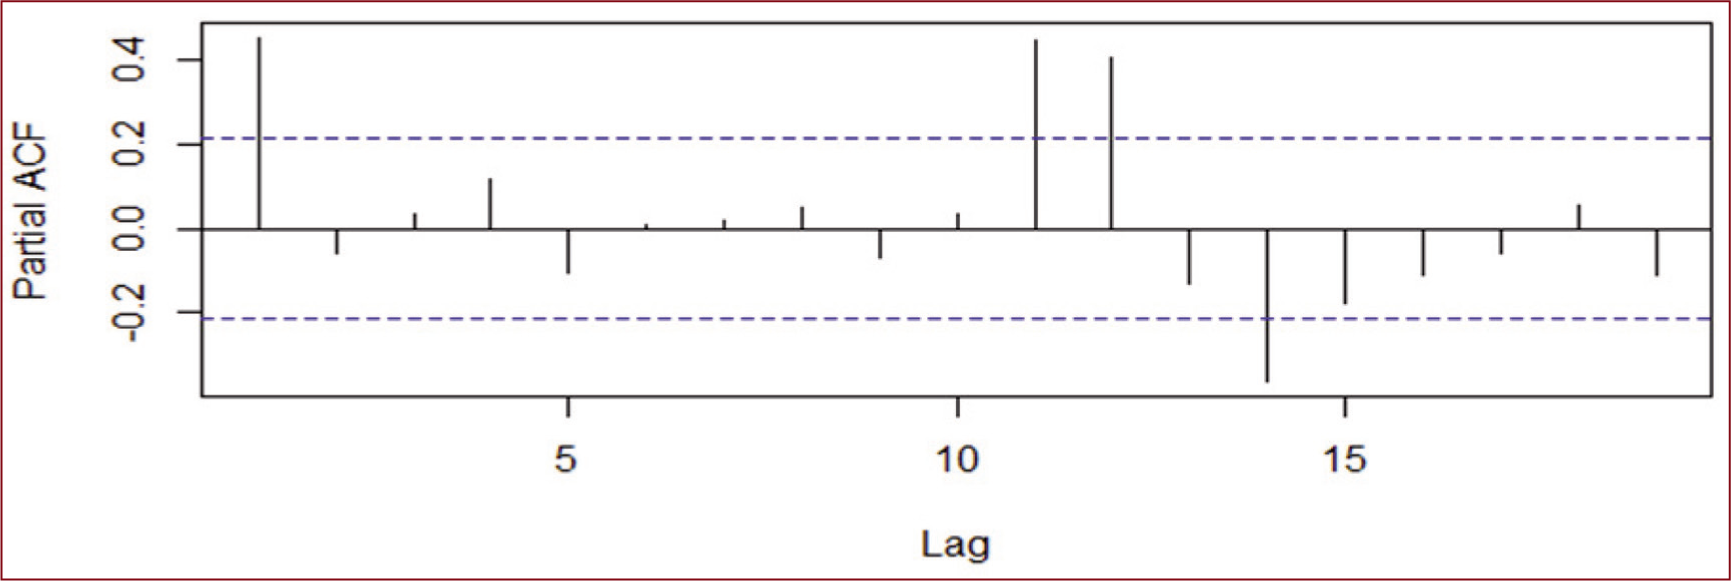
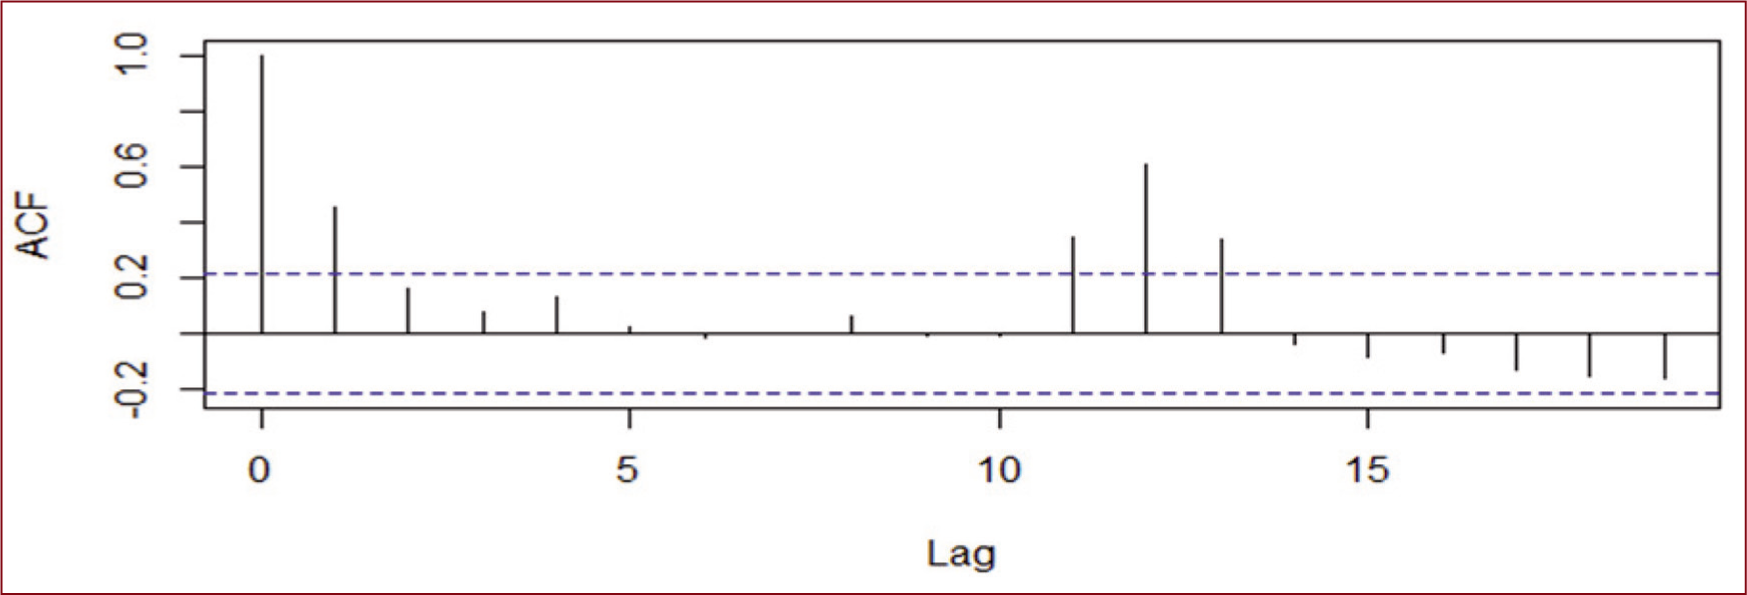
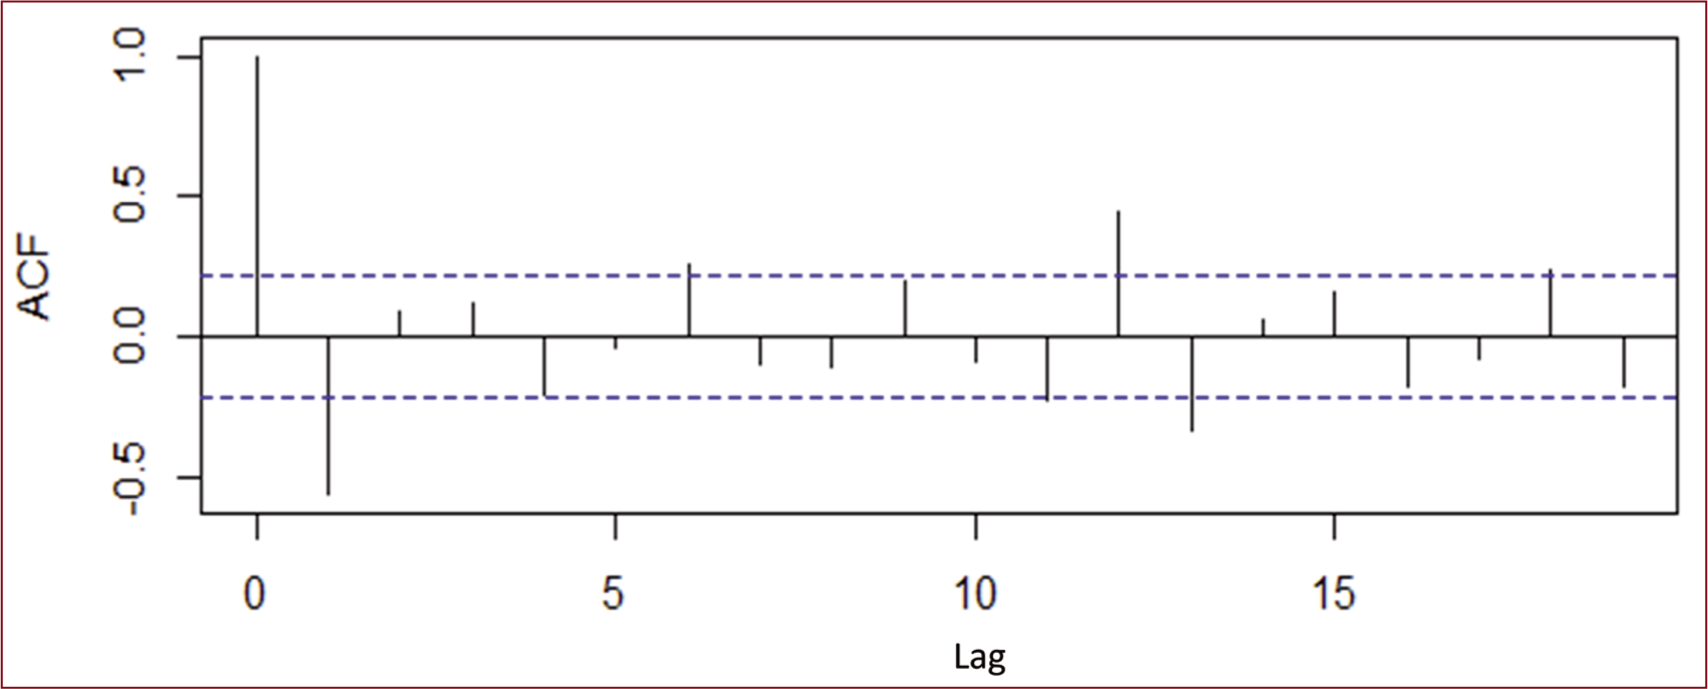
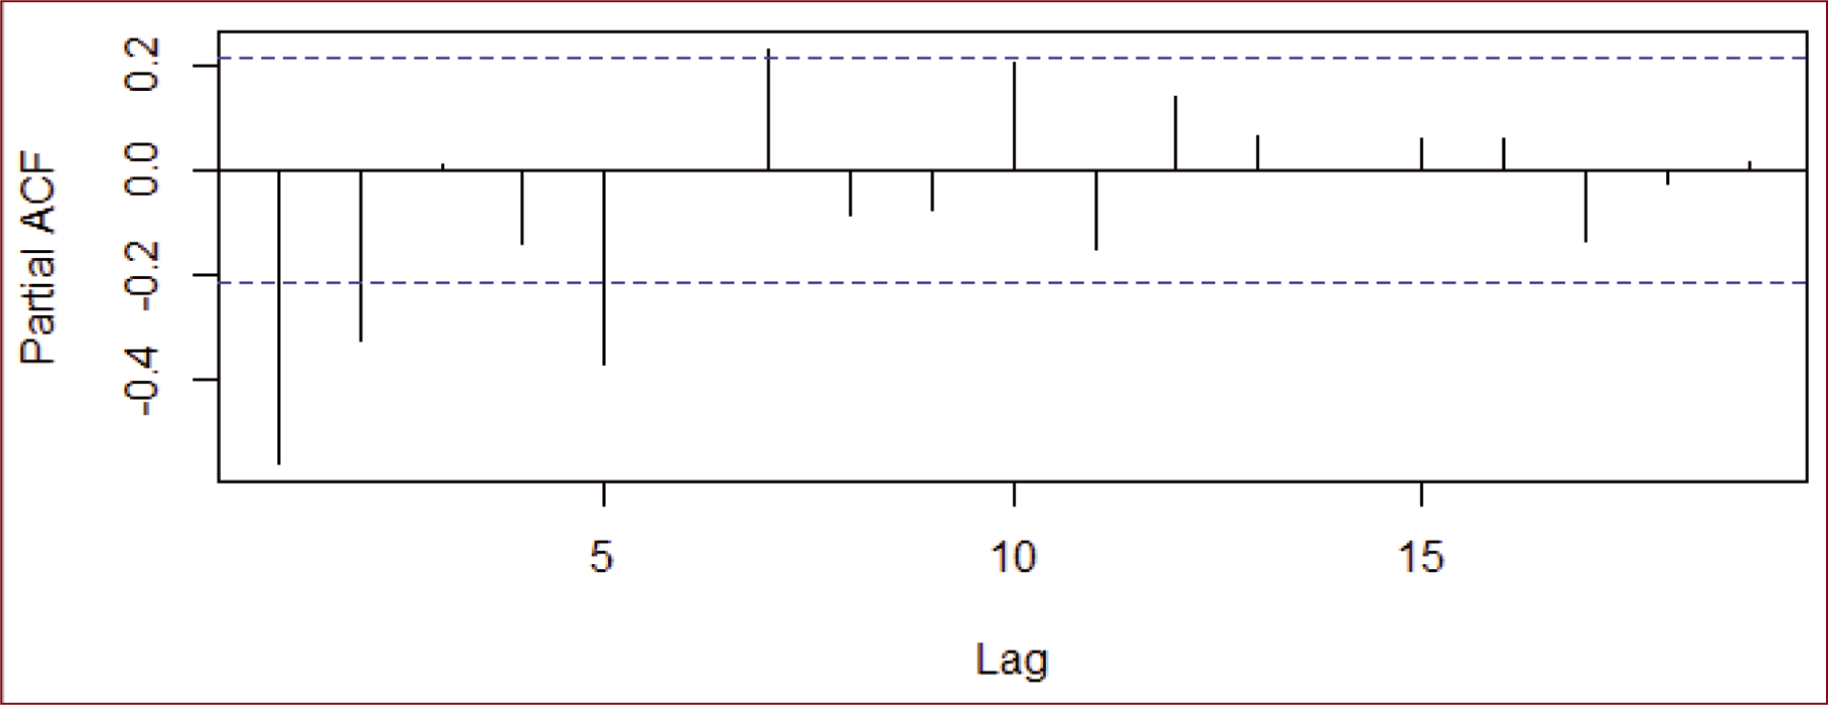
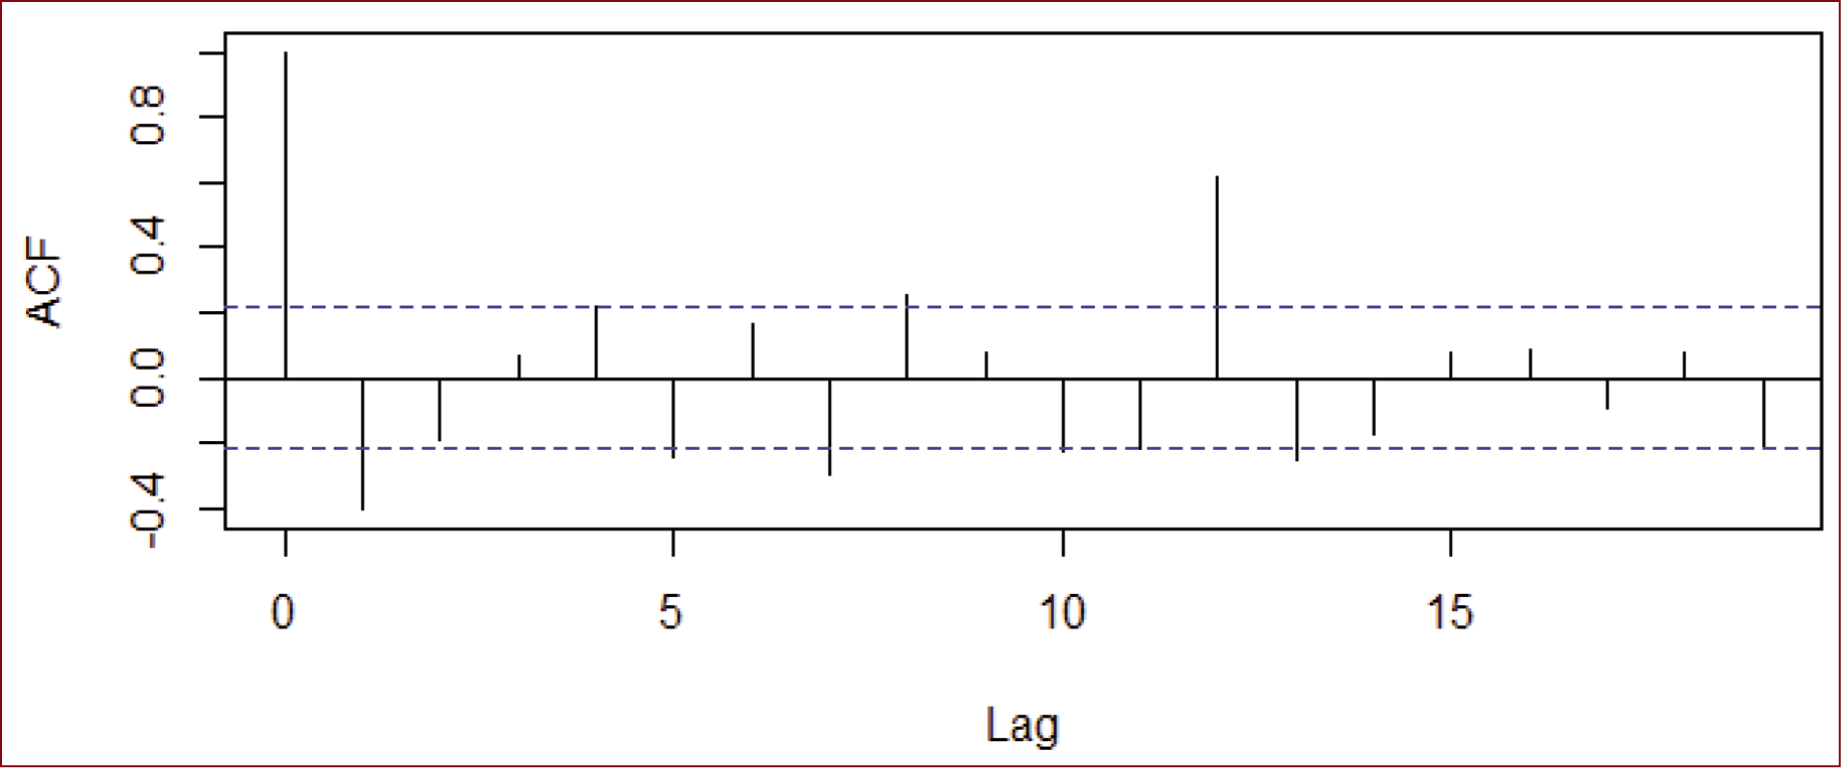
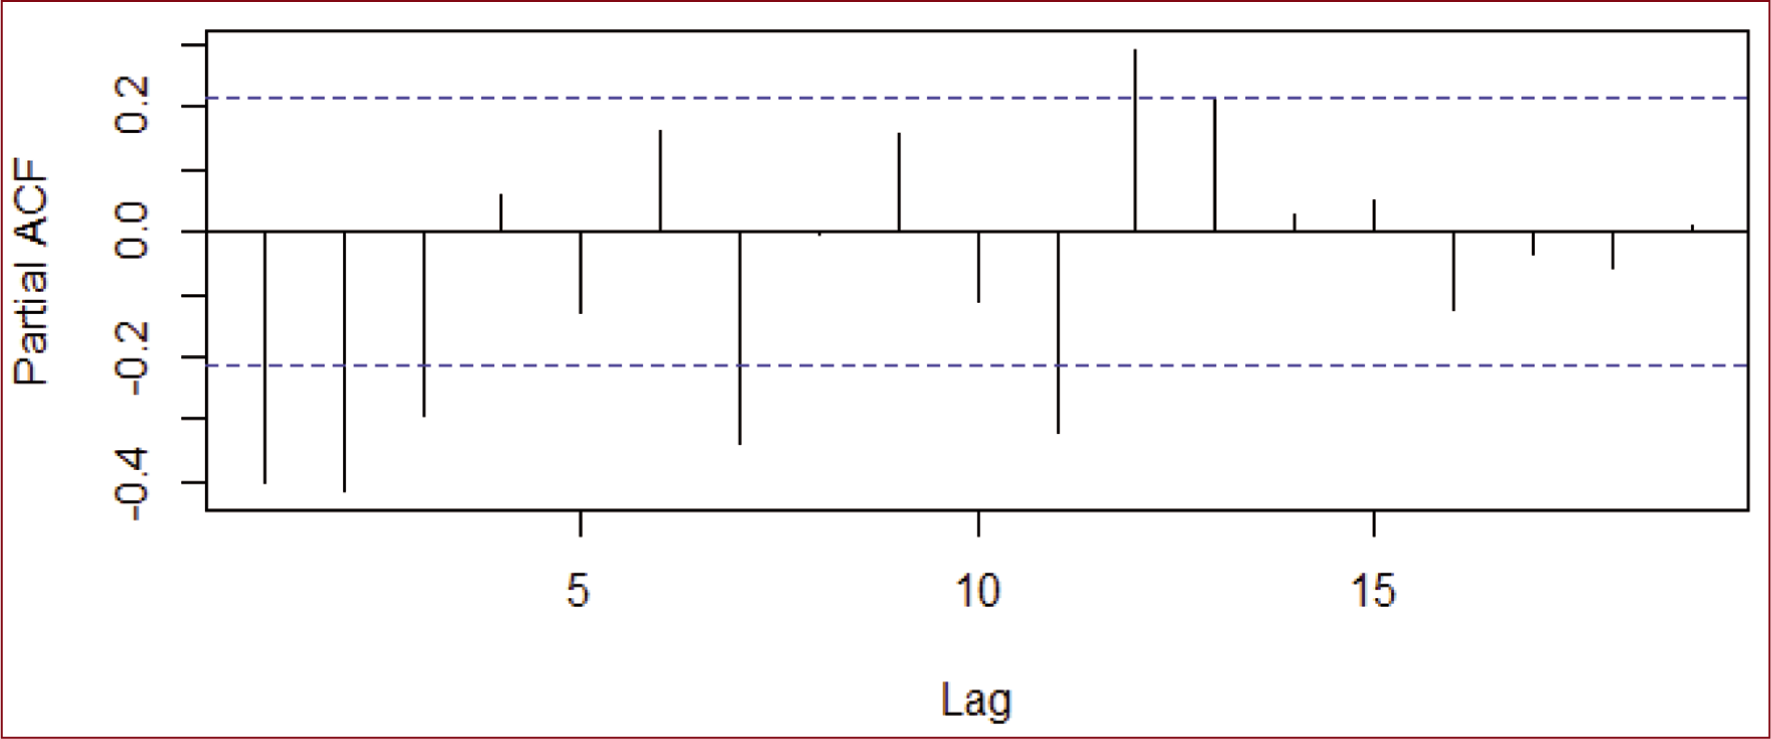
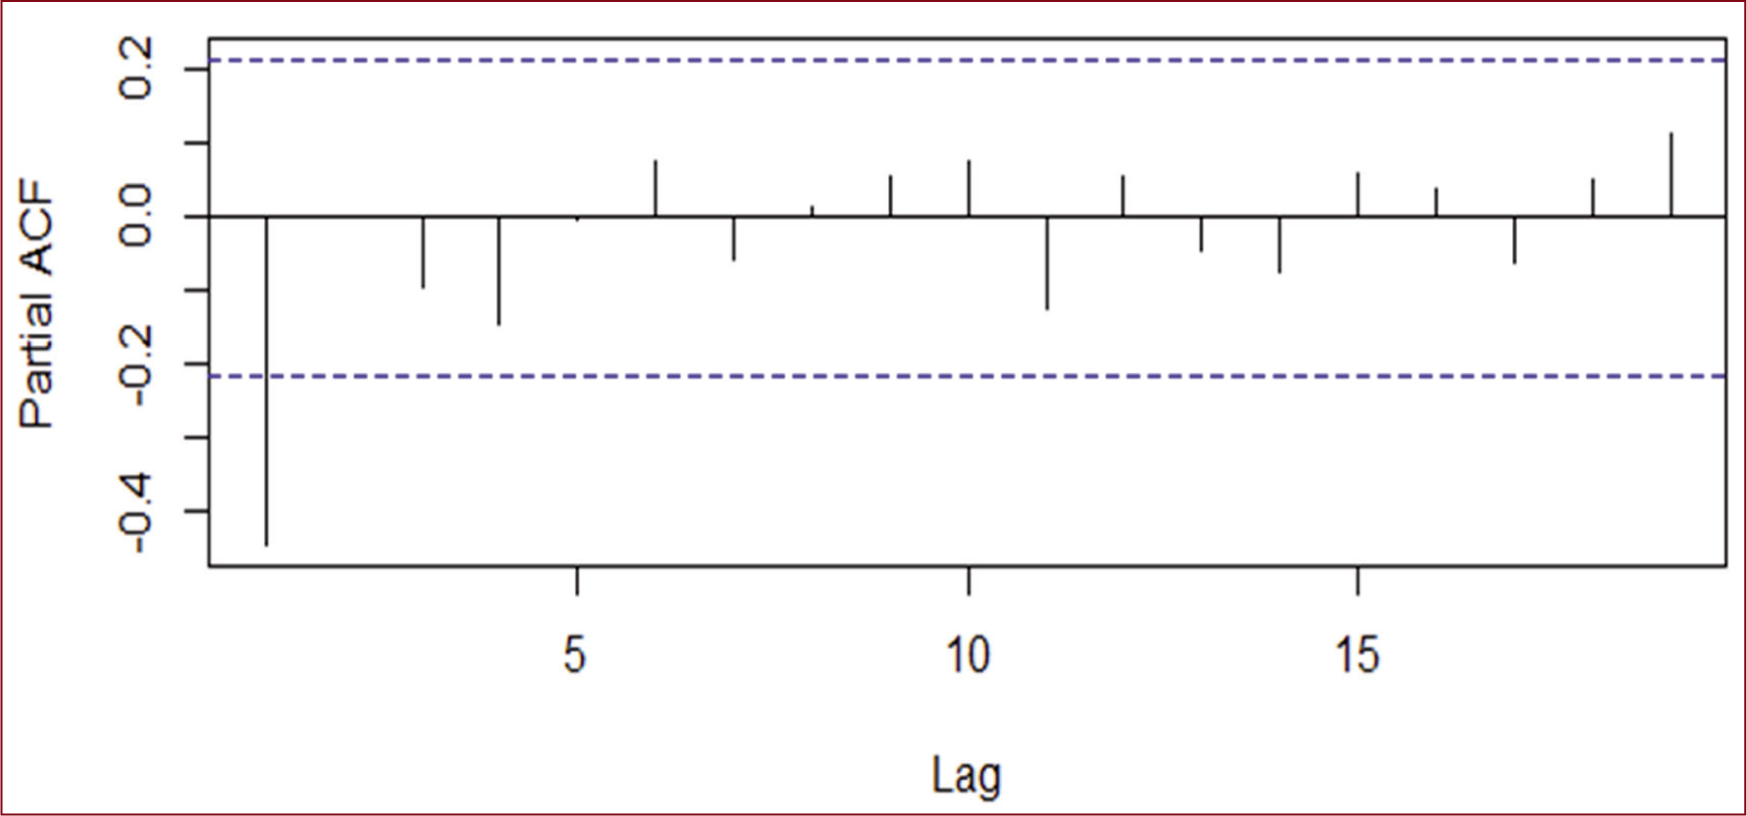
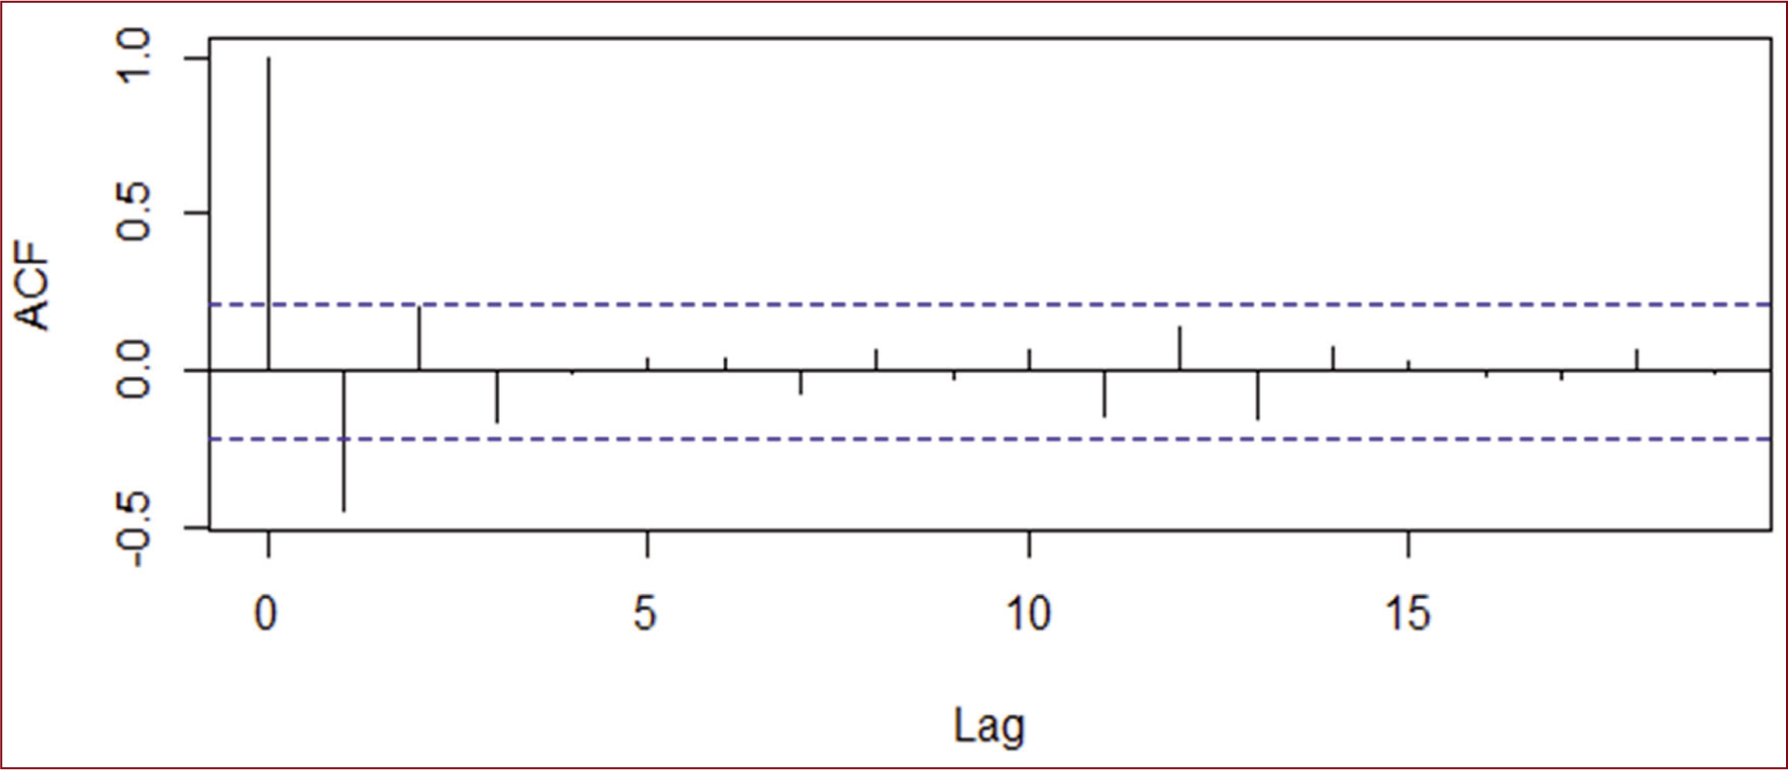
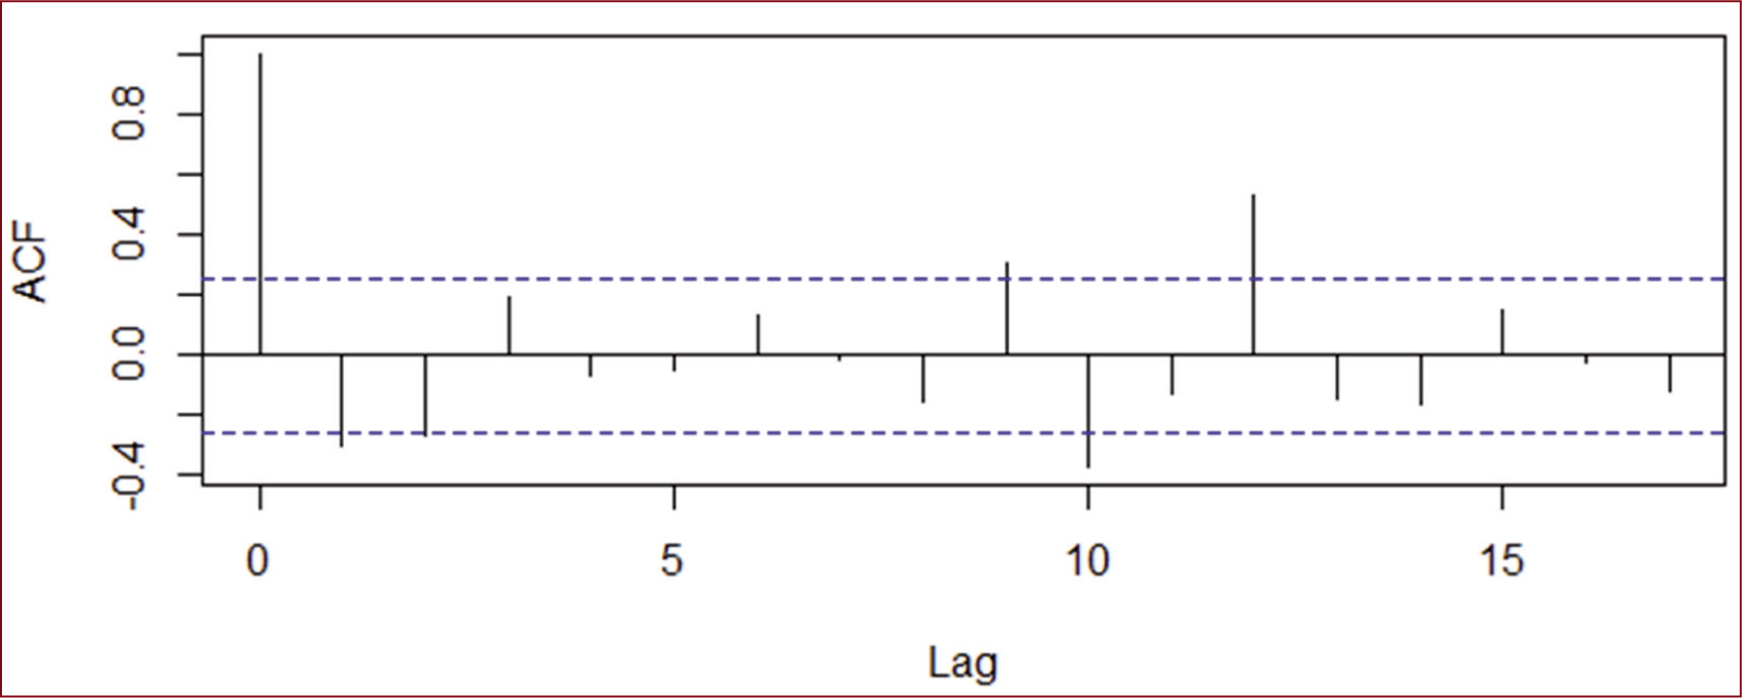
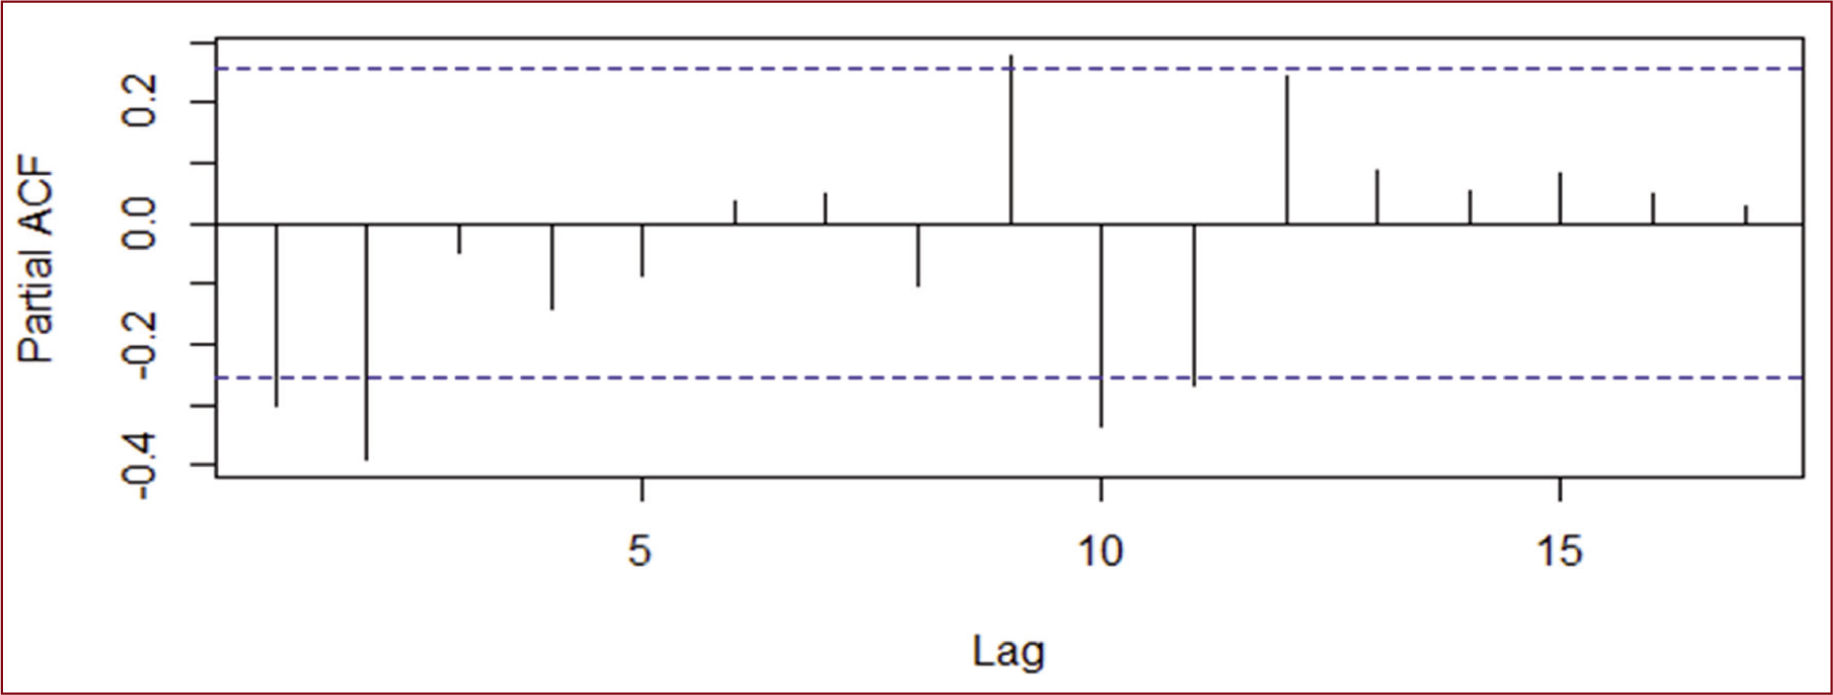
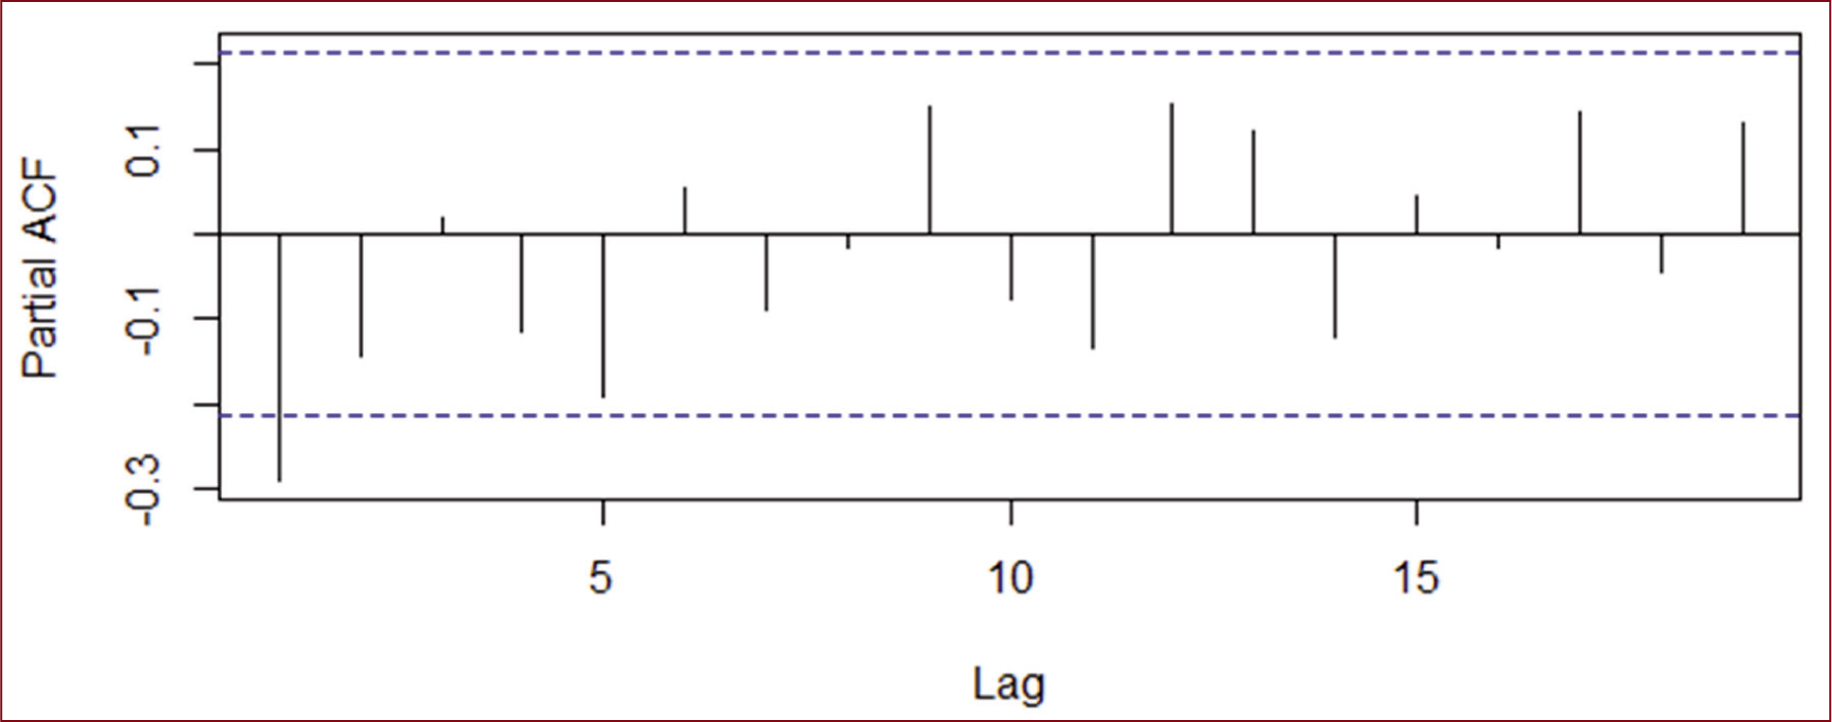
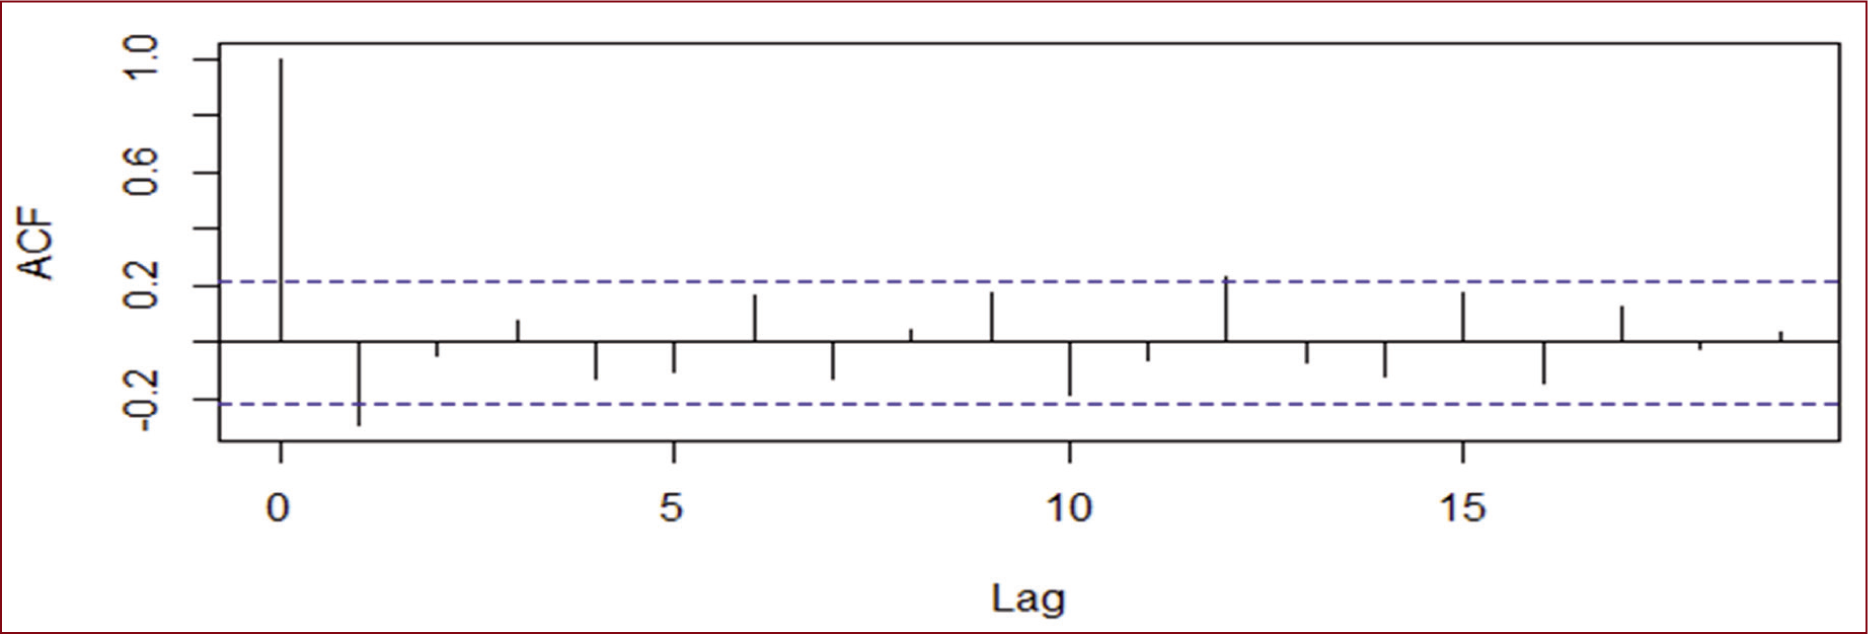
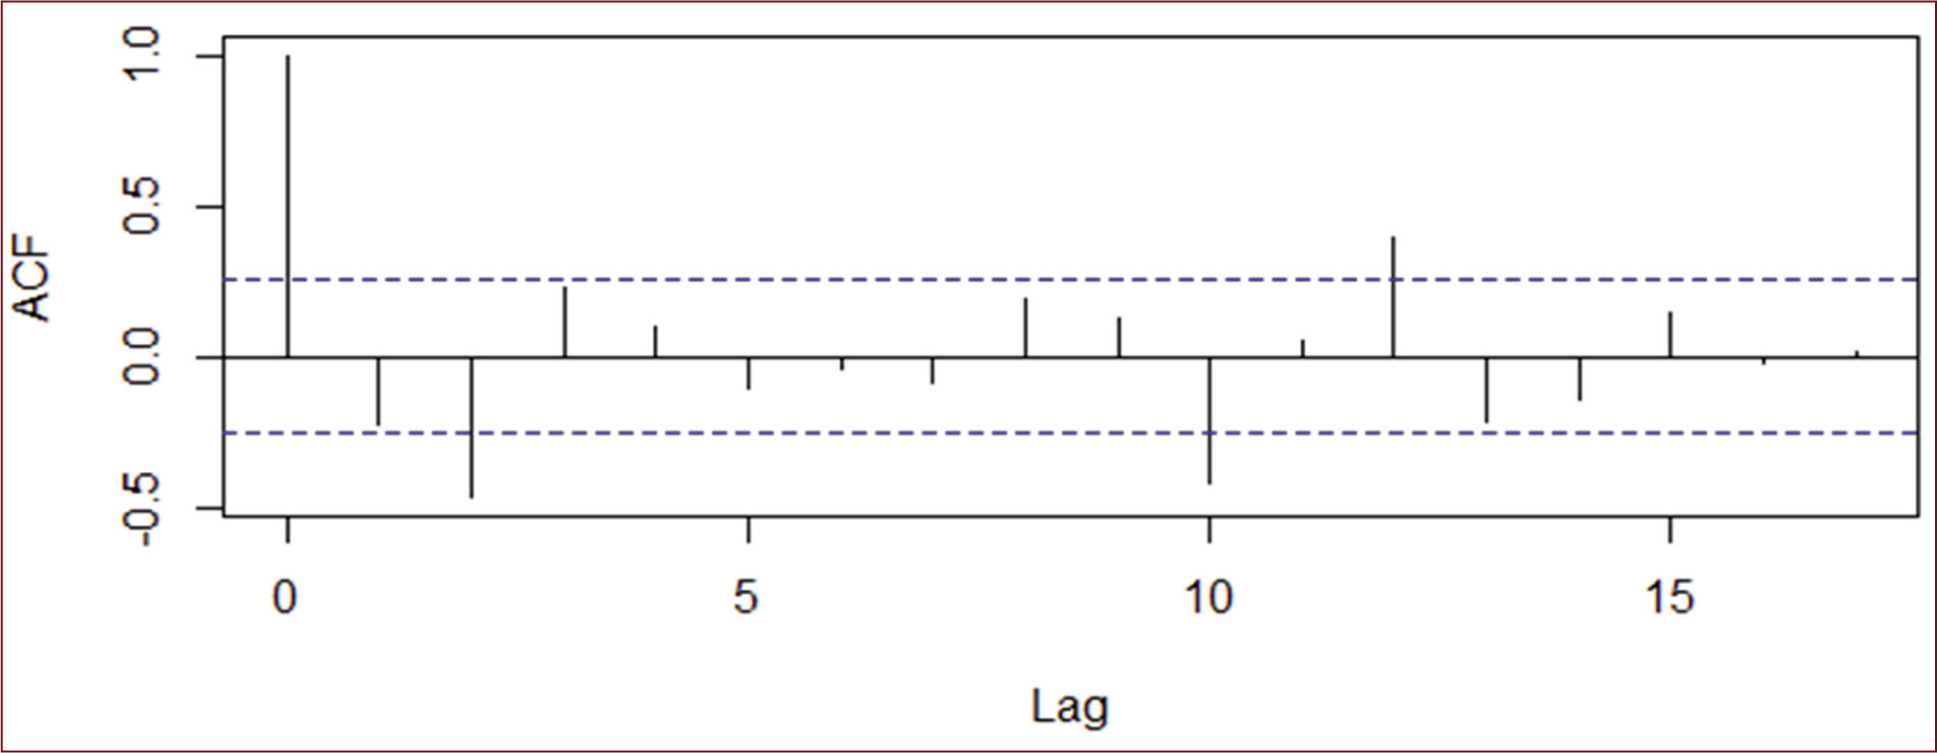
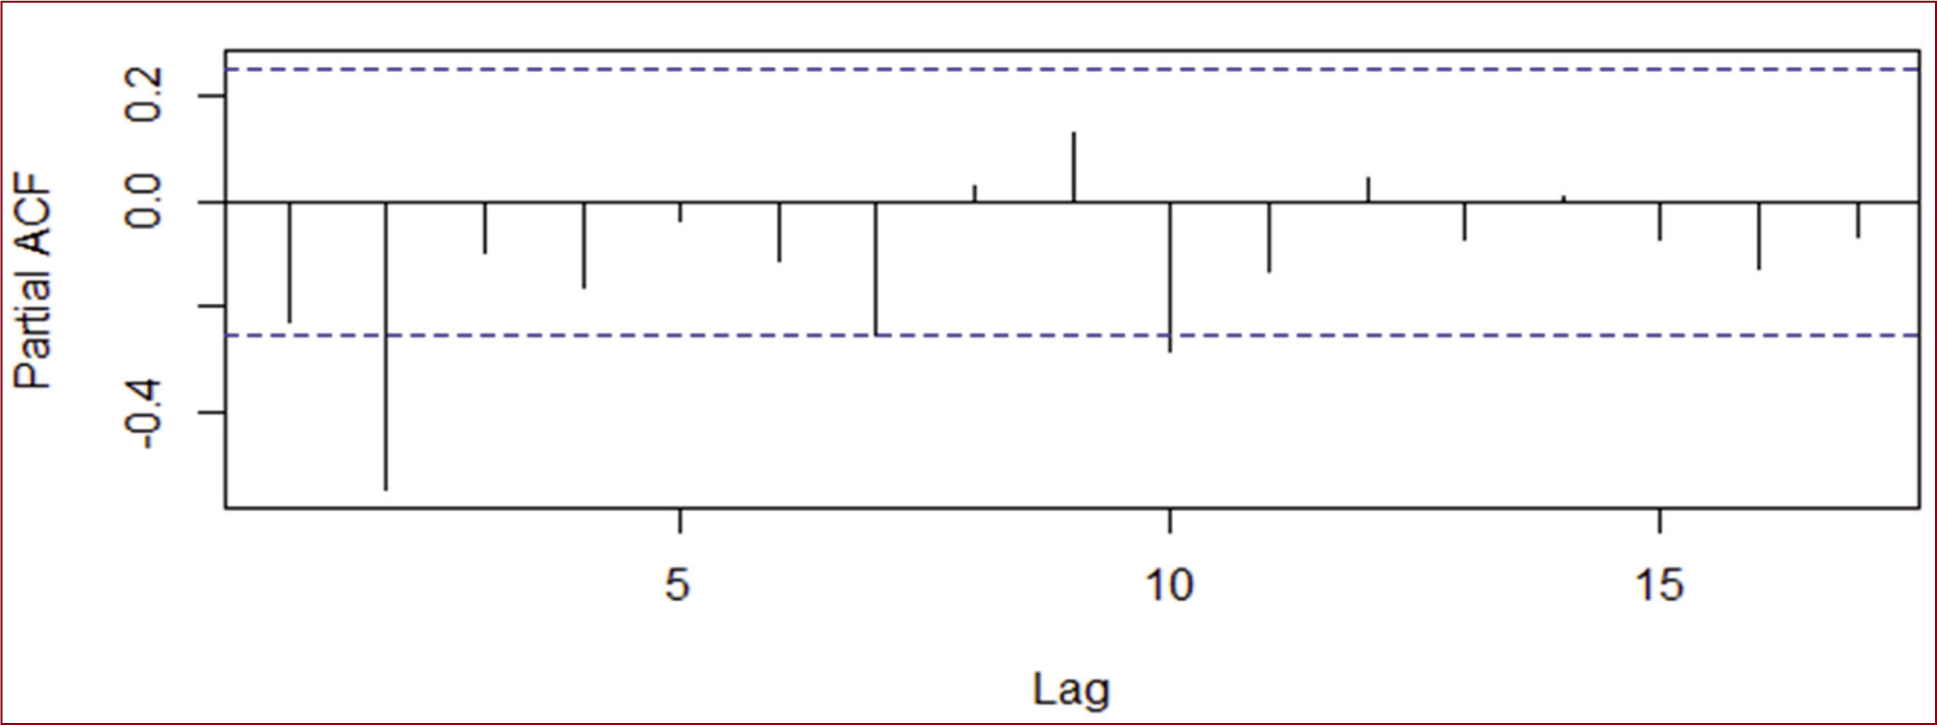
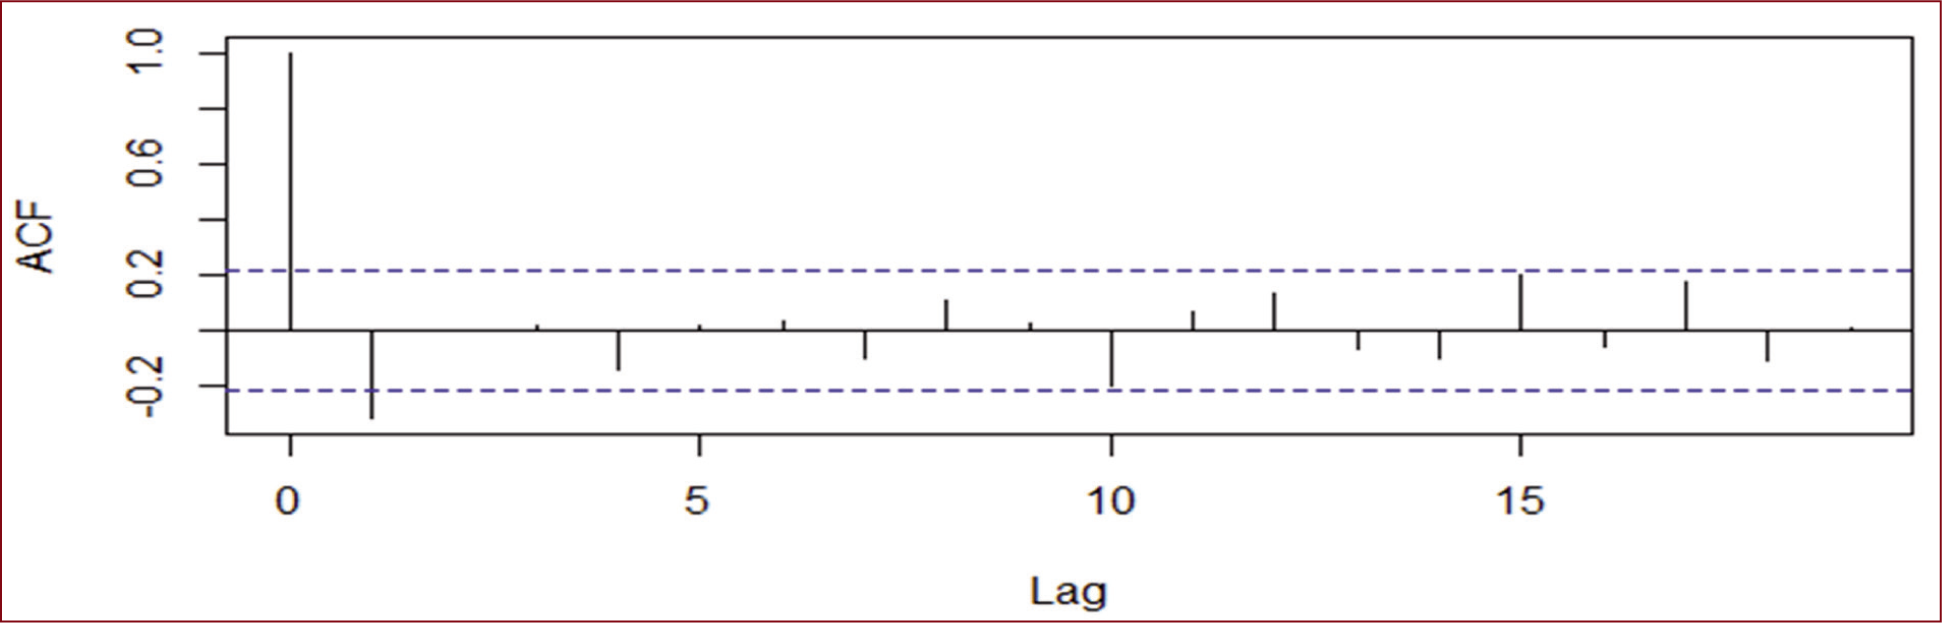
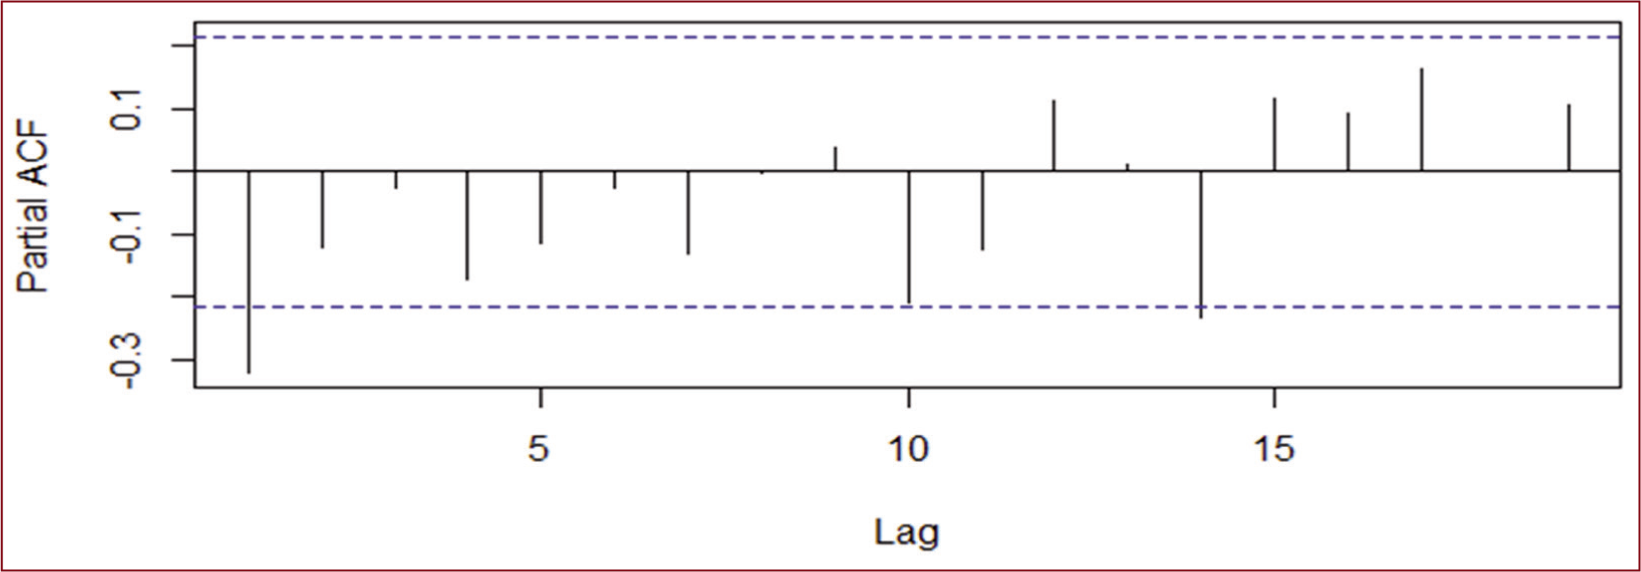
Table 3 shows different ARIMA models selected for different time series. Hence, after identifying different models, the estimation has been conducted to find the coefficient of ARIMA models.
ARIMA Models for Different Time Series
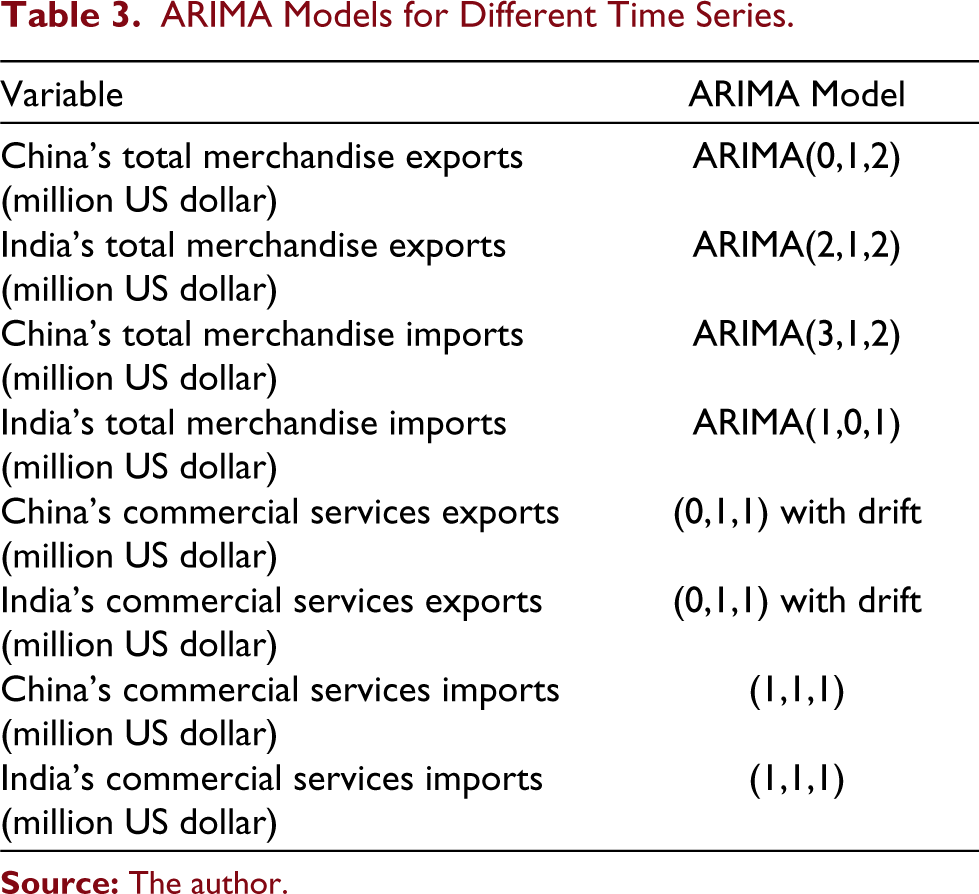
Table 4 presents the coefficients of ARIMA models applied after identification of models. All the coefficients are significant at 1% level of confidence except China’s merchandise imports (significant at 5% level).
Coefficients of AR and MA Terms (ARIMA models)
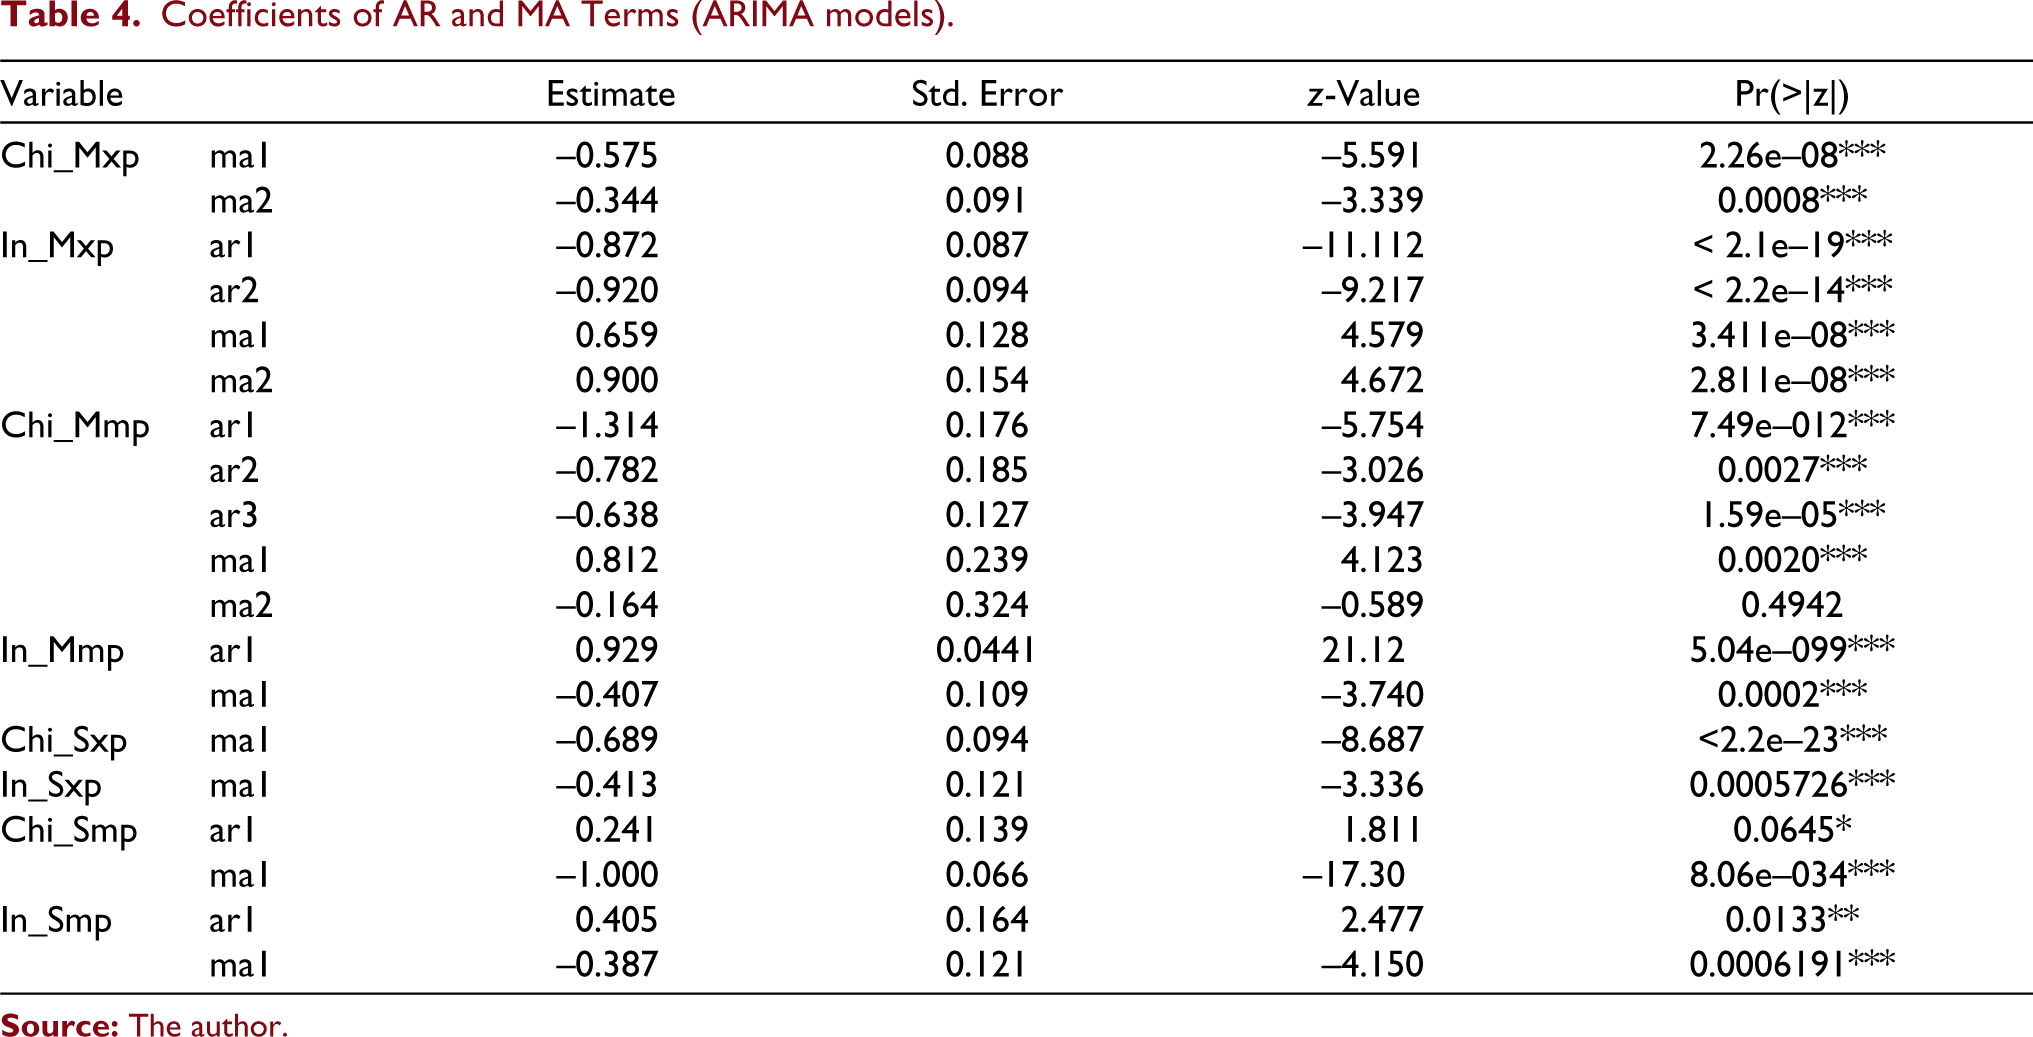
Table 5 shows the results of Ljung–Box test statistic for examining the null hypothesis of independence in a given time series, which is accepted in case of all time series. Hence, we can conclude that ARIMA models of time series are best fit.
Box-Ljung Test (diagnostic checking)
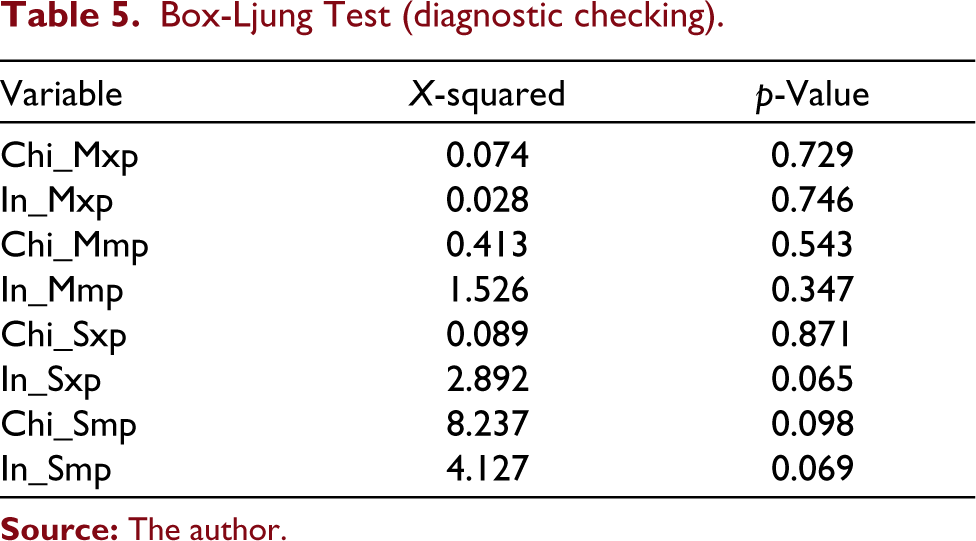
Table 6 presents the actual and predicted merchandise exports of India and China. Figures 17 and 18 show the estimated and actual merchandise exports of China and India, respectively. The figures clearly show that China has been able to perform better than India in case of merchandise exports. The table also presents the percentage deviation of actual merchandise exports from the projected merchandise exports separately for each nation. The negative deviation shows that the actual performance of exports is better than estimated, and positive values show that the counties could not achieve the estimated level of trade performance. We can observe from the results that India’s merchandise exports are weaker than China’s. After June 2020, China’s merchandise exports seem to be more stable, although we can observe that India’s exports are still in an adverse condition. China’s export performance is improving, and it can be observed from the table that China has outperformed India in the month of November and December 2020. The negative impact on China can be observed only for 4 months (March, April, May and June), while India is affected more. The actual values for China’s merchandise exports were not available for the month of January 2020. Hence, the comparison for the month of January has been omitted. The maximum impact on India is observed in the month of April; the reason attributed to this can be complete lockdown in India in the month of April. India has achieved satisfactory export performance in the month of December.
Estimated Versus Actual (merchandise exports)
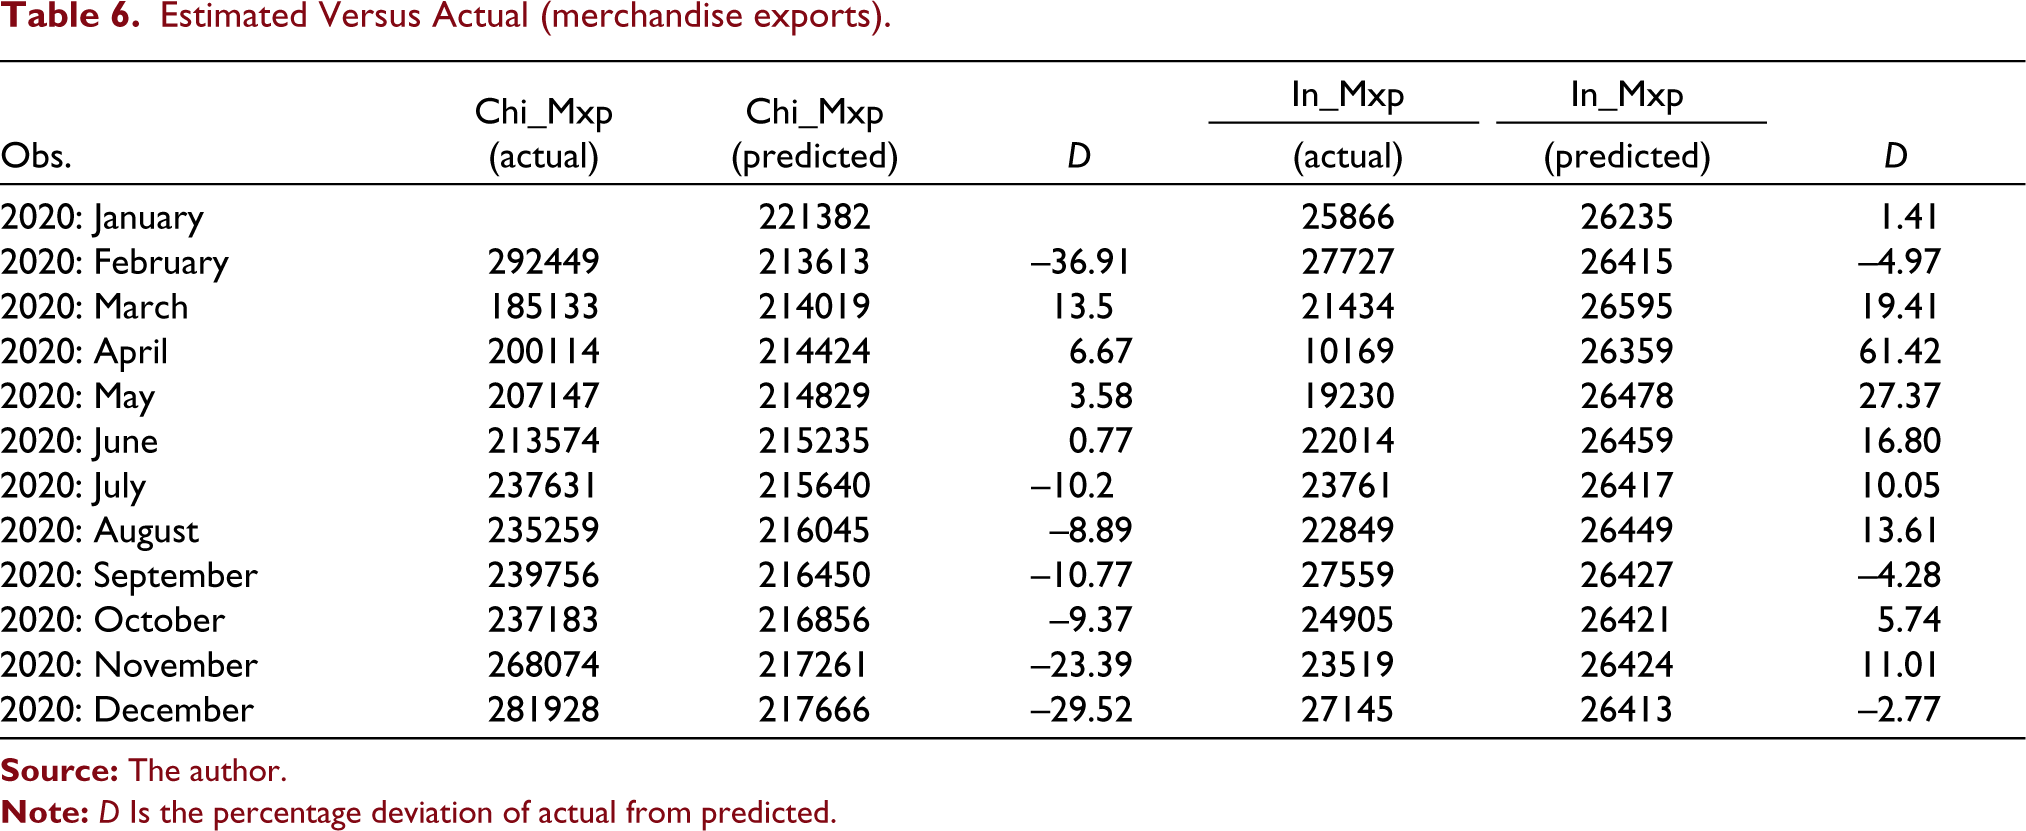
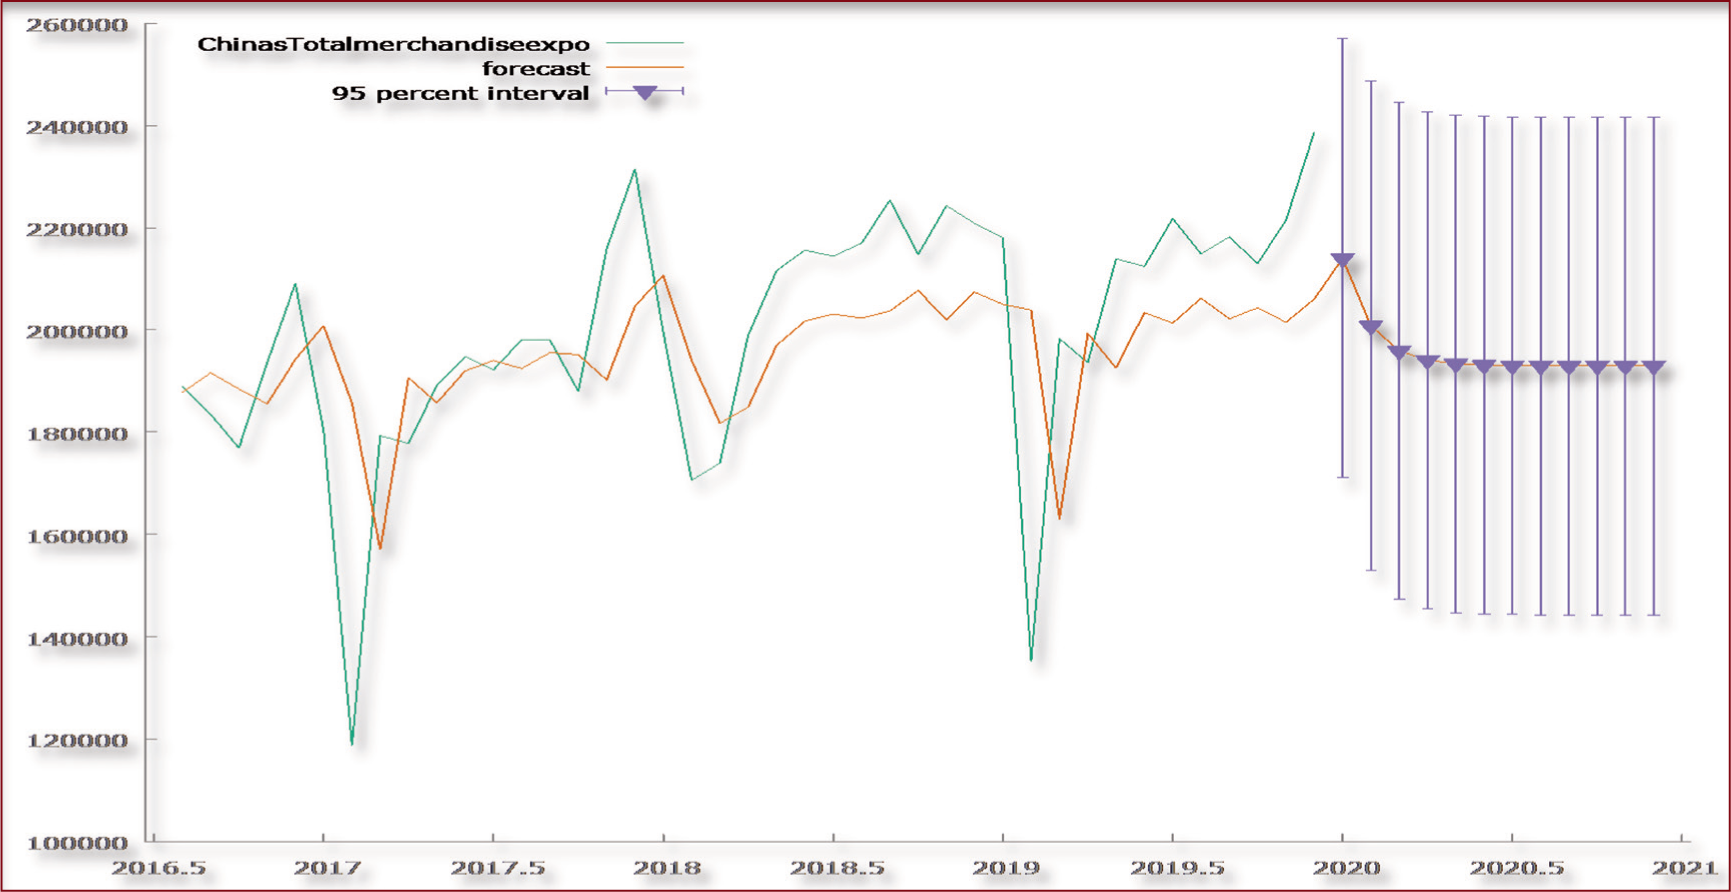
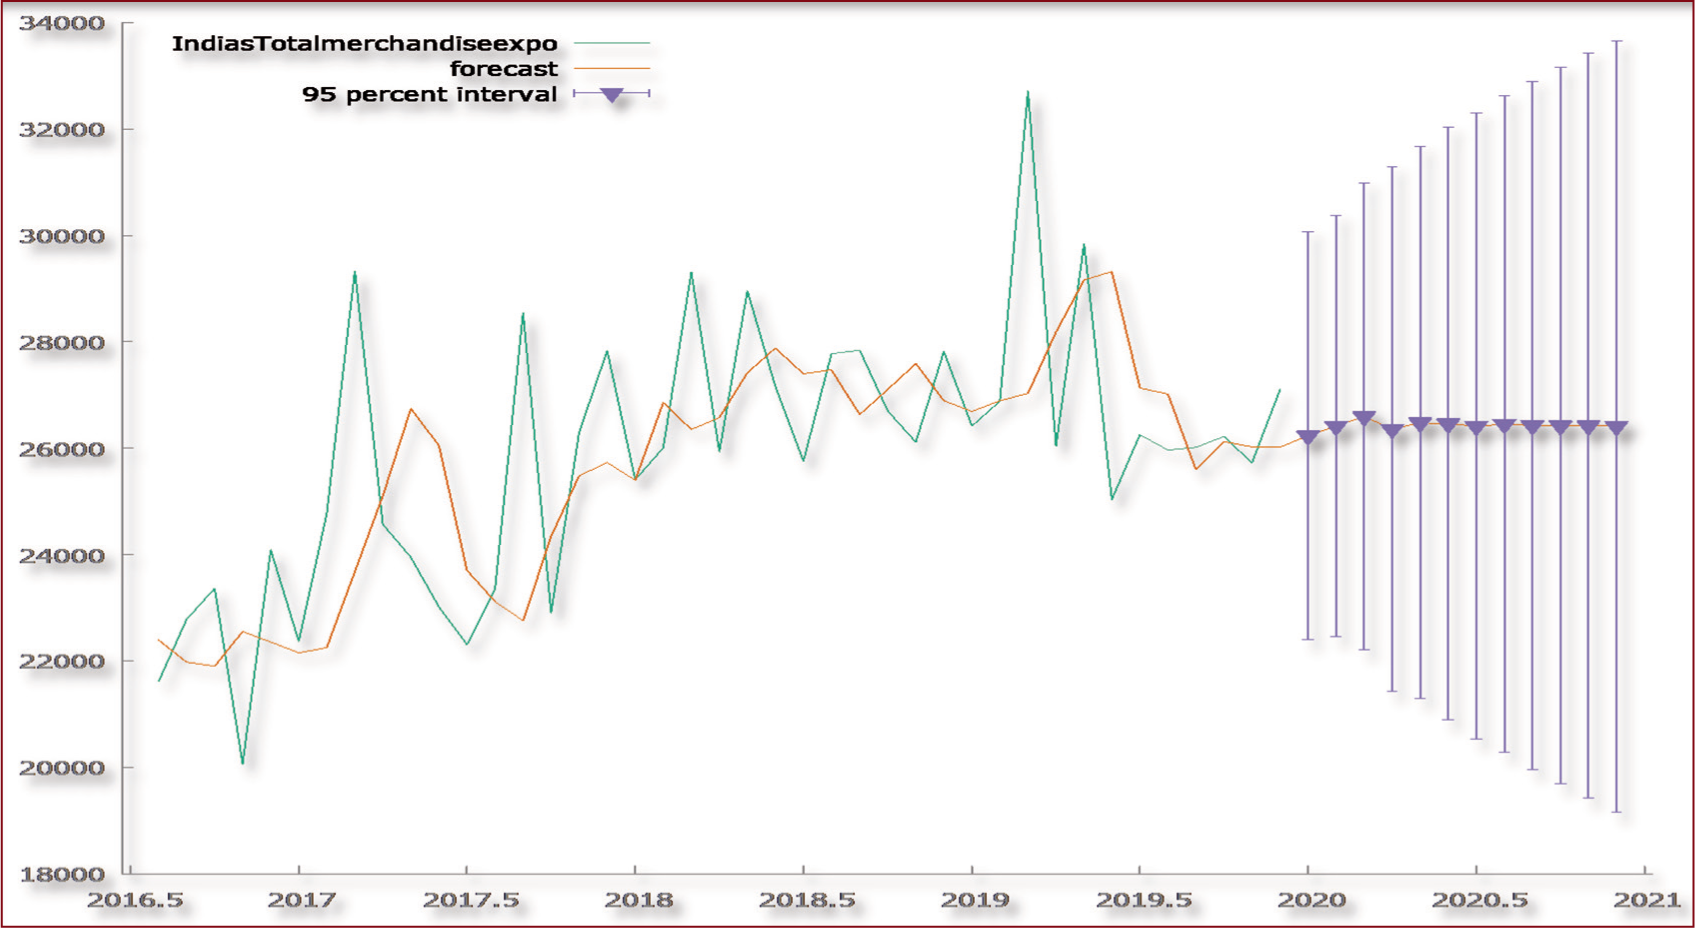
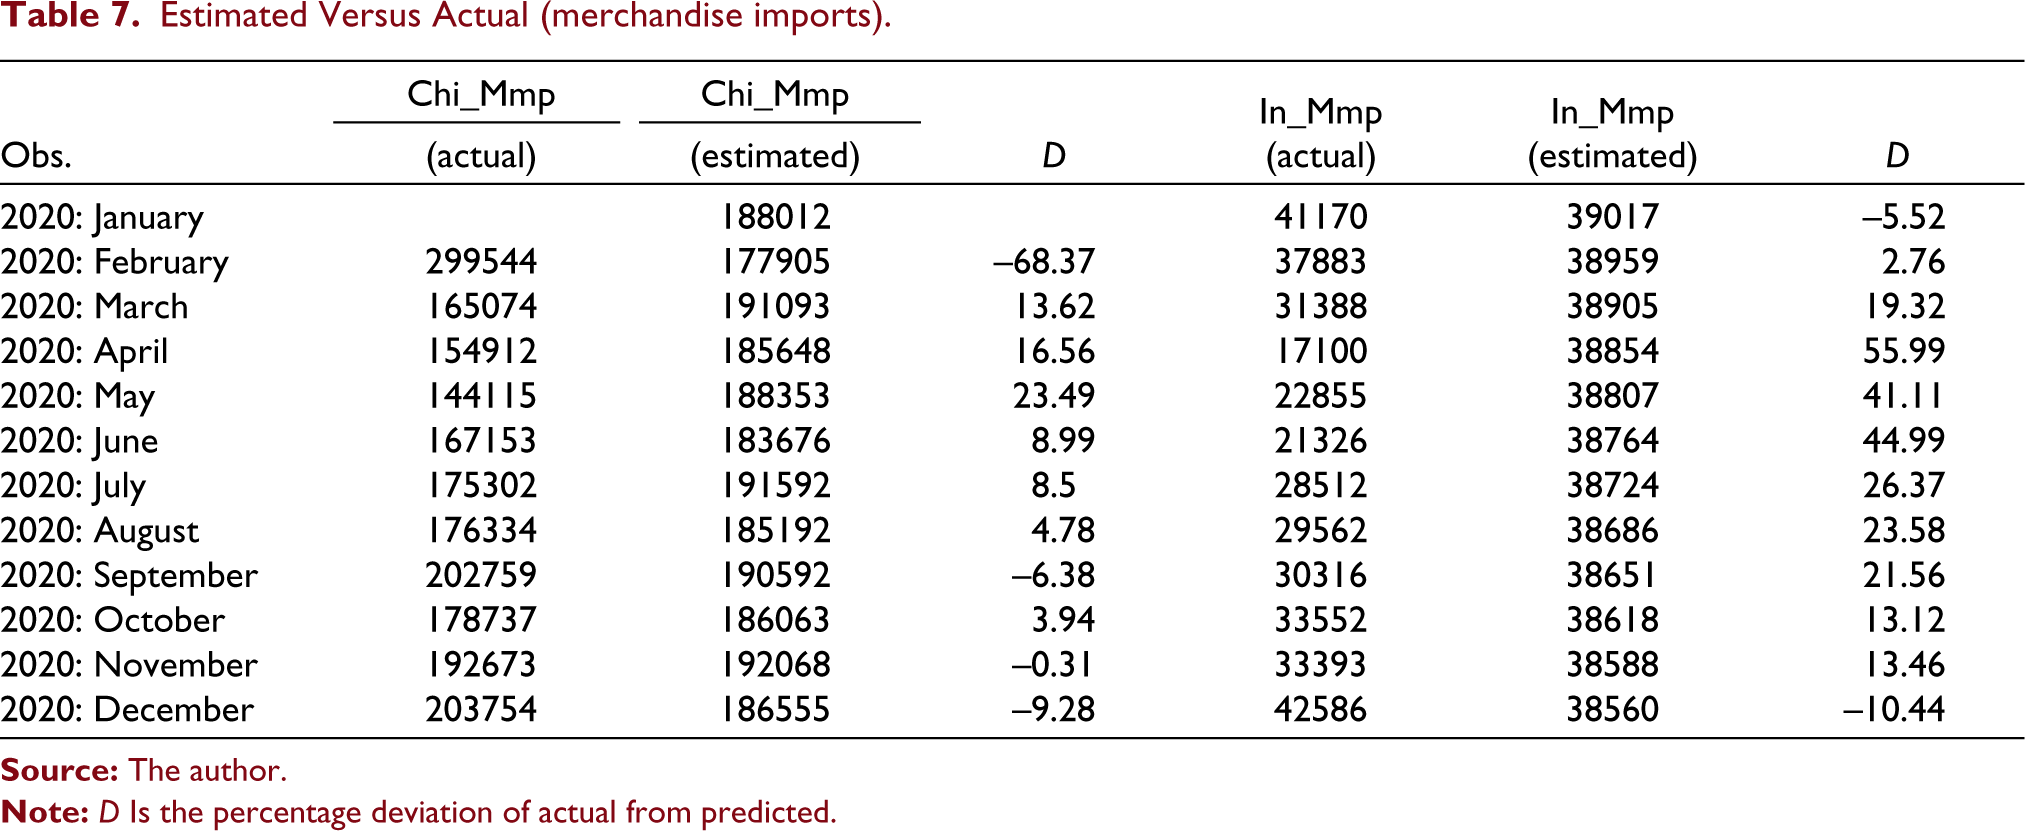
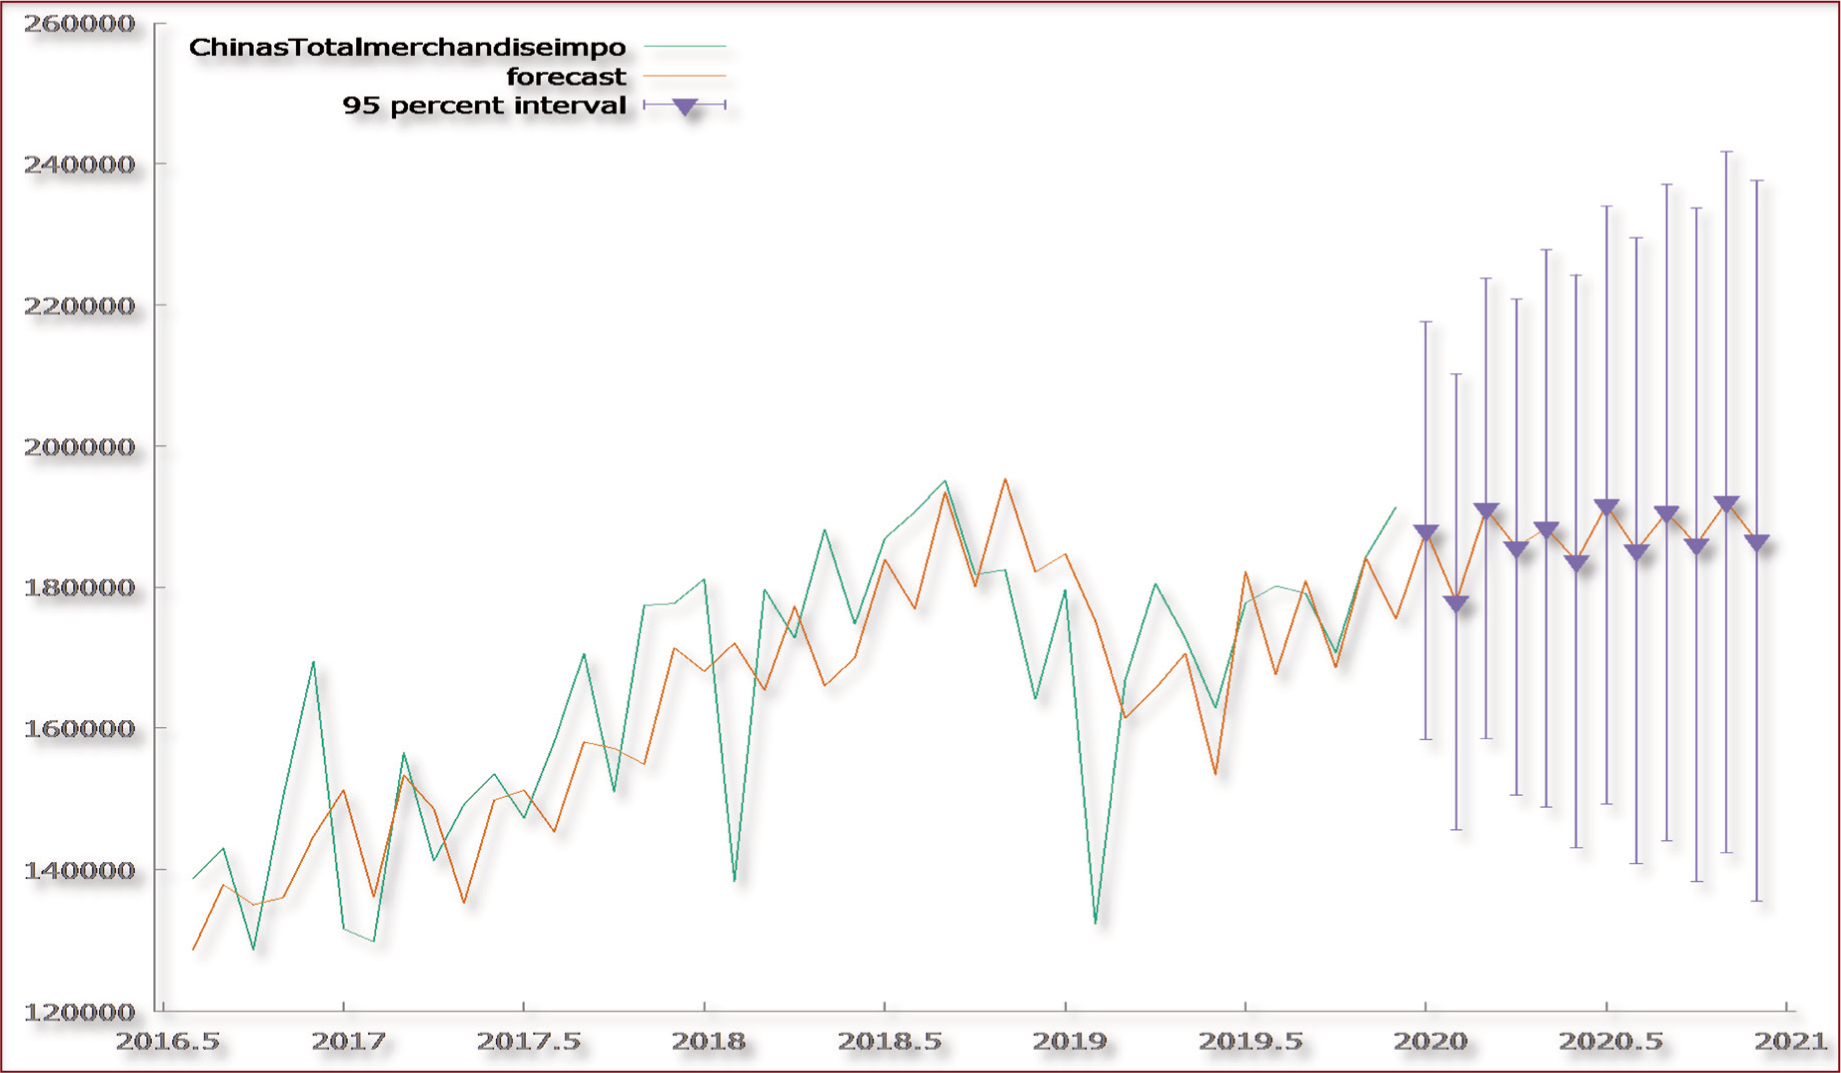
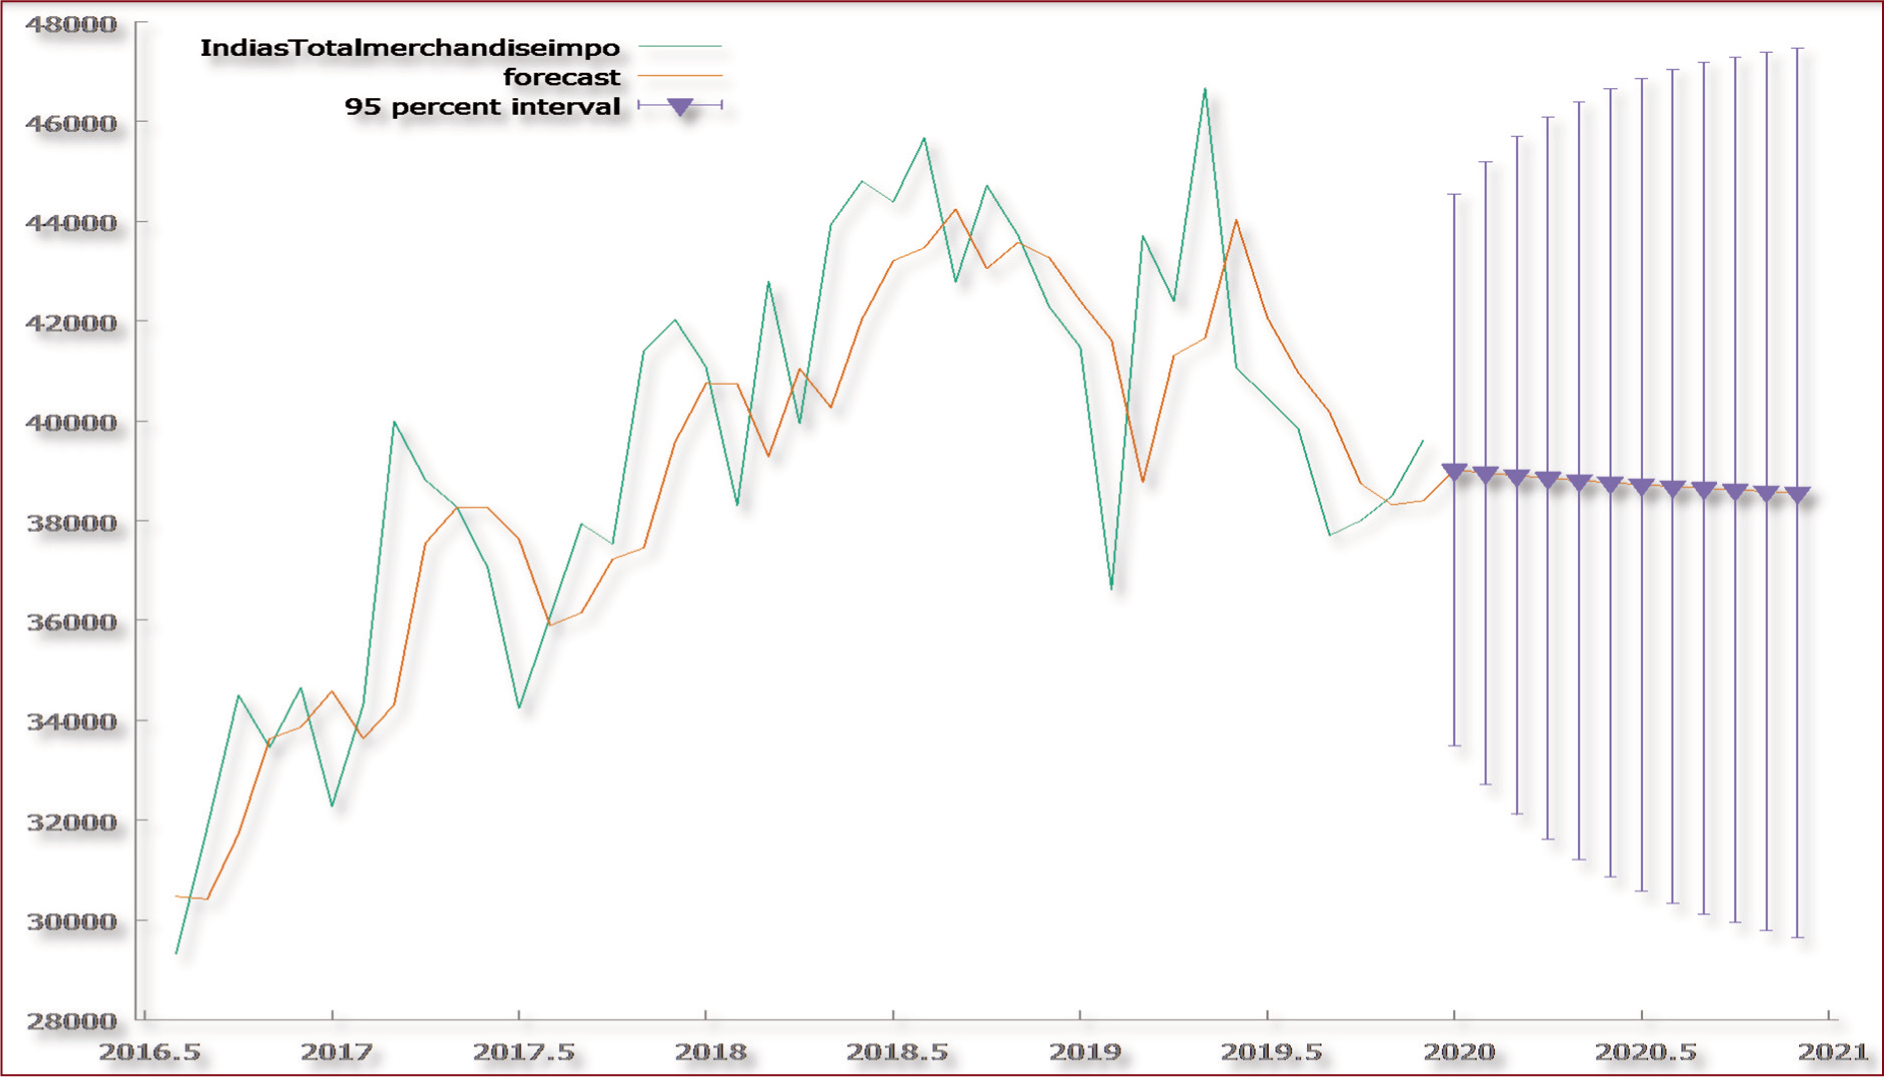
Table 7 reflects the actual and expected prices of merchandise imports from the rest of the world in both countries. Figures 19 and 20 show the estimated and actual merchandise imports of China and India, respectively. On comparing the figures, we notice that China’s imports are stable, while India’s imports are falling from 2019 onwards. In Table 7, we have measured the percentage deviation of actual imports from the estimate. The negative deviation indicates better actual performance of imports, and positive values show that the counties could not achieve the estimated level of imports. We note more deviation in India than in China in the case of imports as well. Again, after June 2020, China’s imports are stable, but India is still at the height of fluctuations. Again, we can note that China has been able to perform well, as predicted in the month of December 2020. If we compare the deviation of exports and imports of China with that of India, we can observe that imports are more impacted than exports for both the countries. Due to unavailability of the values of merchandise imports of China for the month of January 2020, we have omitted the calculation of deviation for that month.
Estimated Versus Actual (merchandise imports)
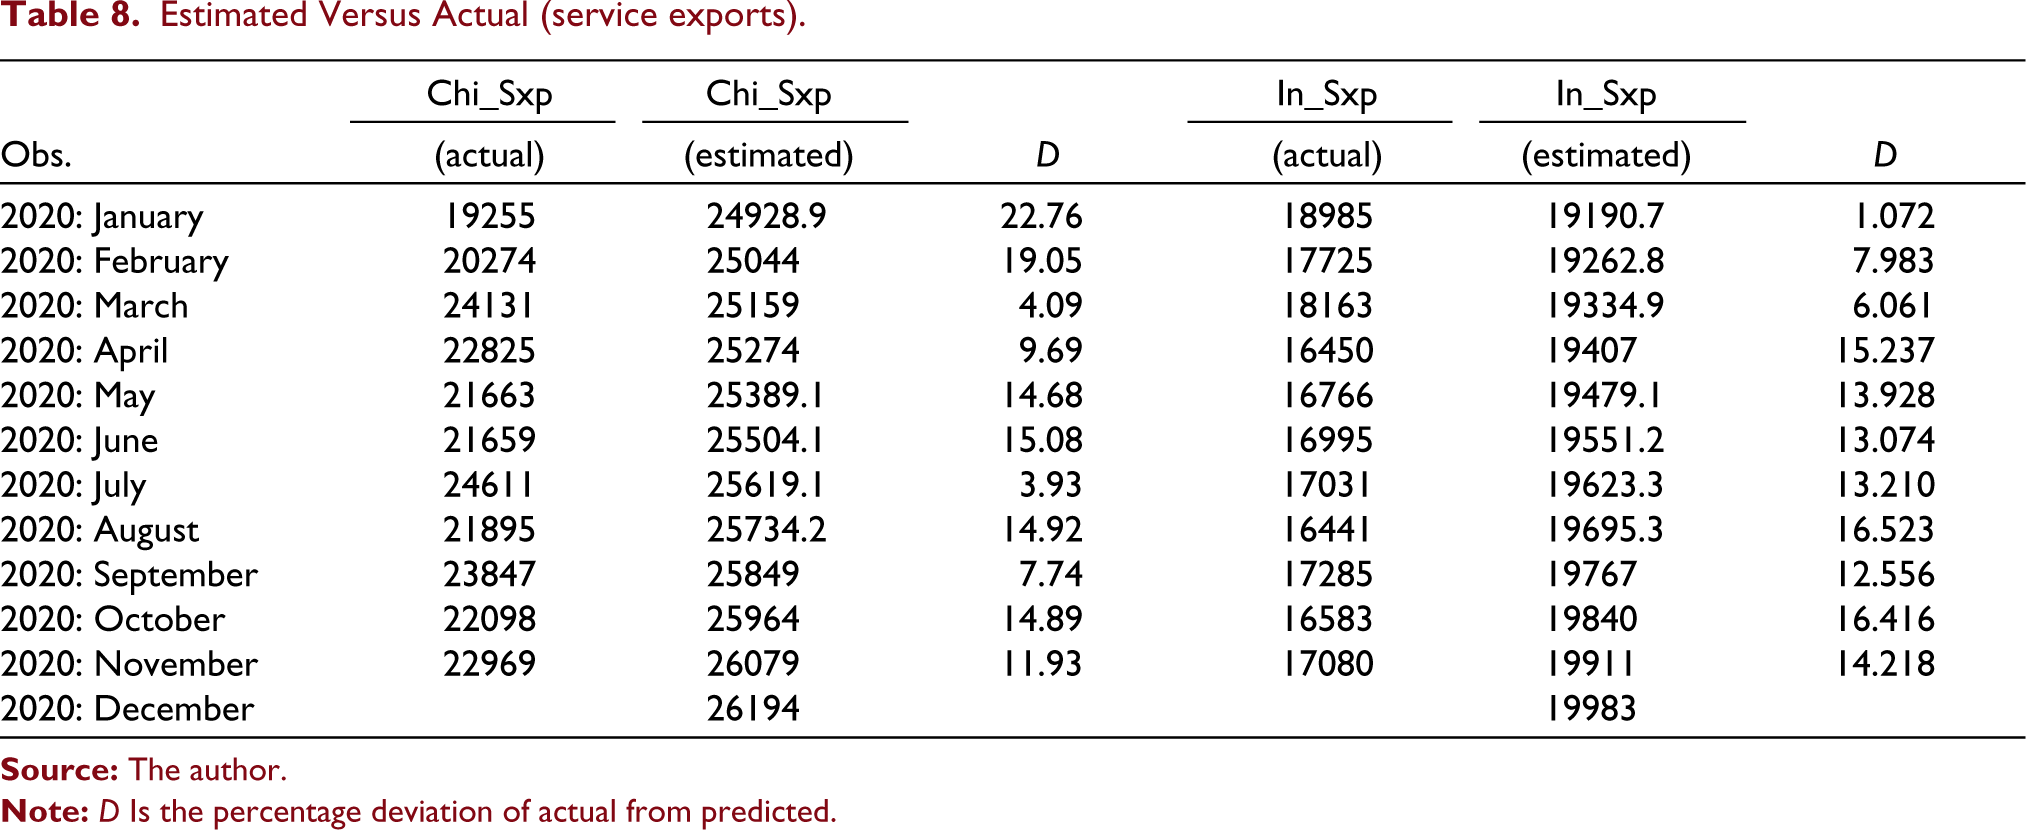
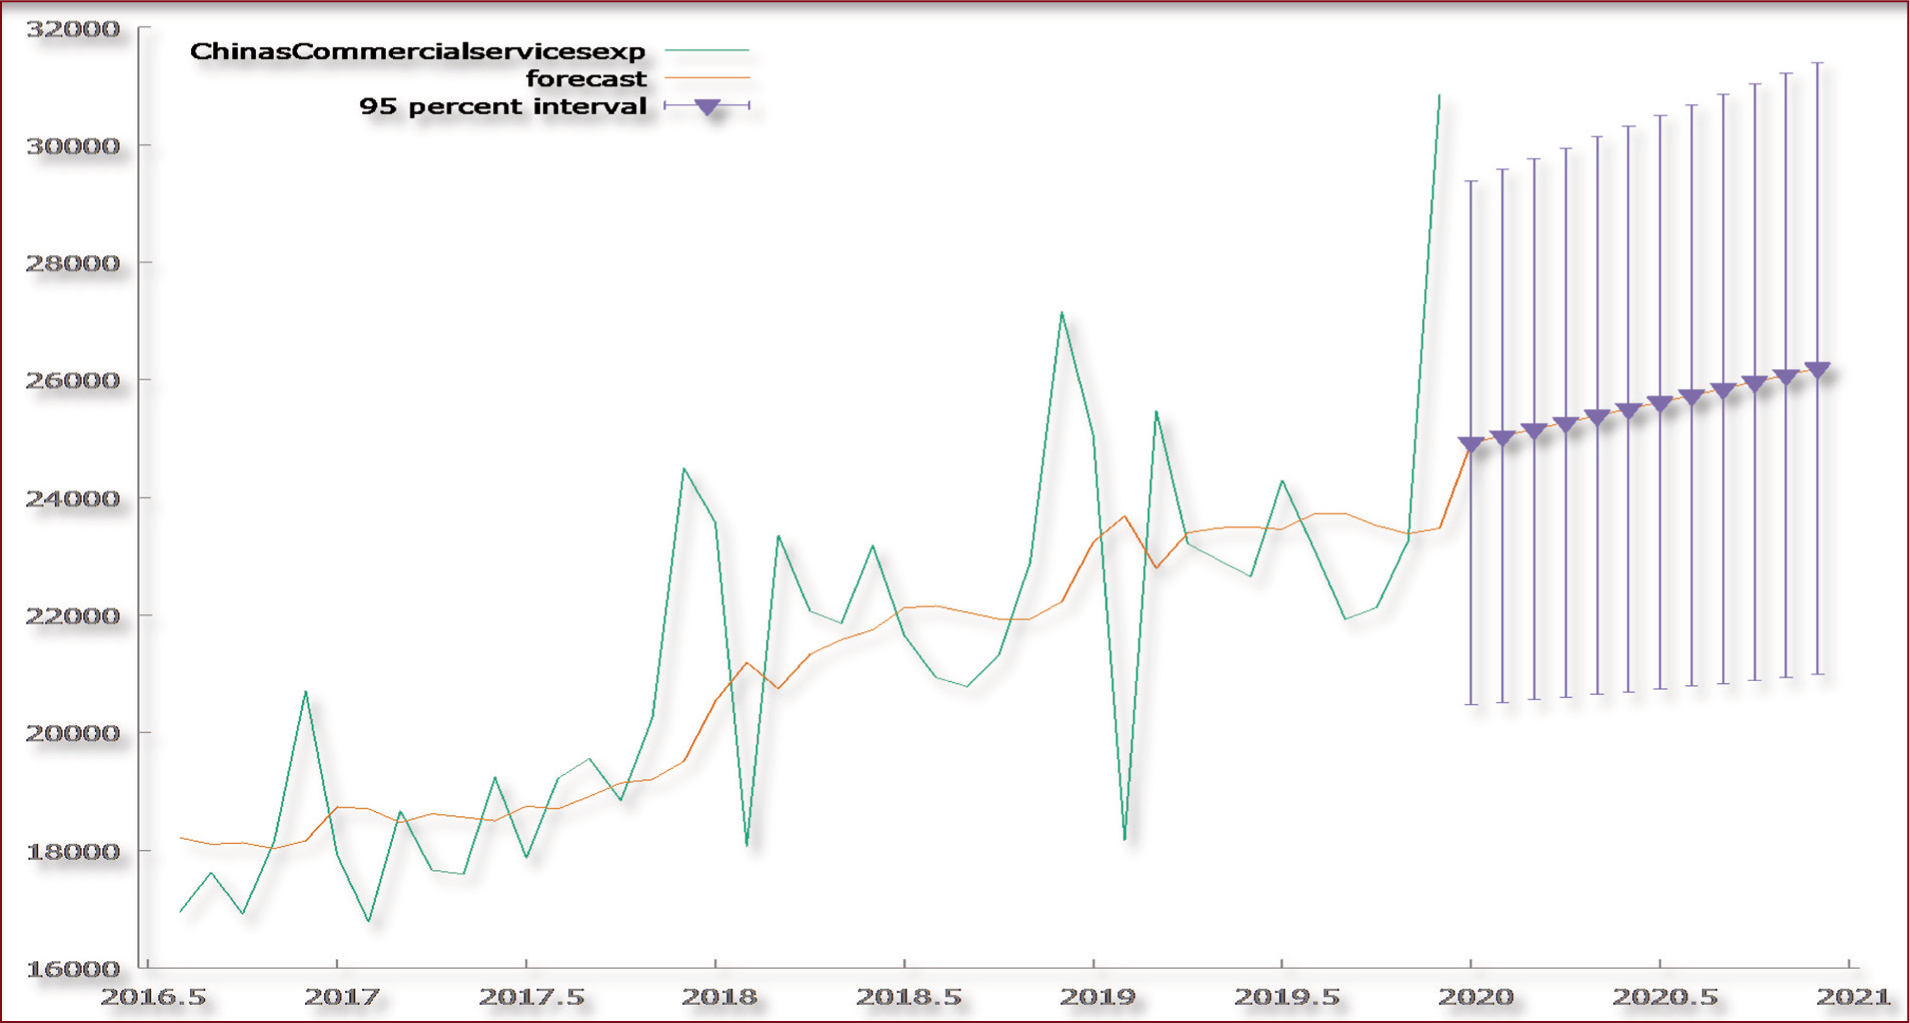
In Table 8, we can observe the comparison between the deviations of actual from estimated service exports of India and China. Figures 21 and 22 show the estimated and actual service exports of China and India, respectively. Again, we have omitted calculation for China’s service exports for the month of January 2020 due to non-availability of data. The negative deviation shows that the actual performance of exports is better than estimated, and positive values show that the counties could not achieve the estimated level of trade performance. As per the results, we have compared the average deviation of China with that of India. The average deviation in case of China is 12.61%, while average deviation in case of India is 11.84%. We can observe that China’s service exports are more impacted from COVID-19 in comparison to India’s service exports (though the difference is not much). We can also conclude from the figures as well as the tables that both India’s and China are observed to have a similar impact due to COVID-19 in case of service exports, since the positive values indicate that actual service exports have been less than the estimated service exports.
Estimated Versus Actual (service exports)
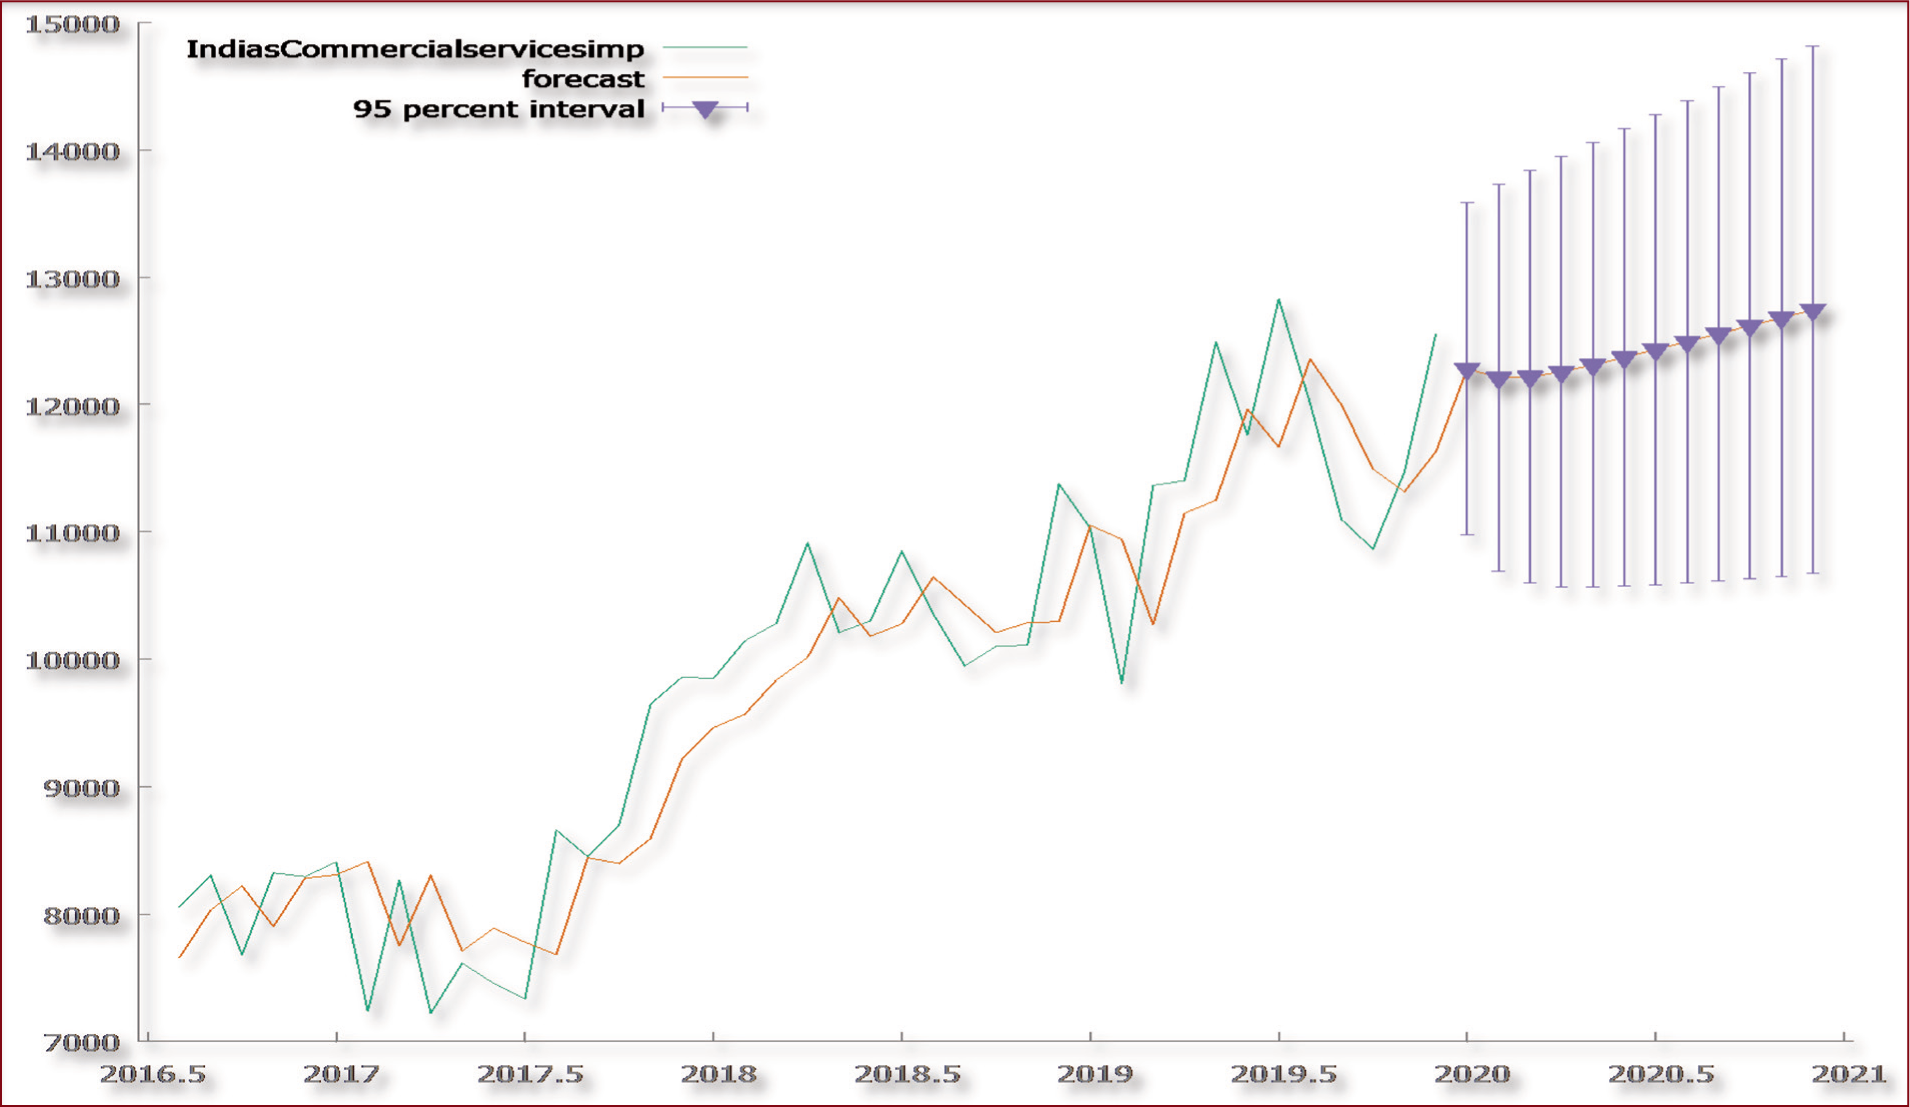
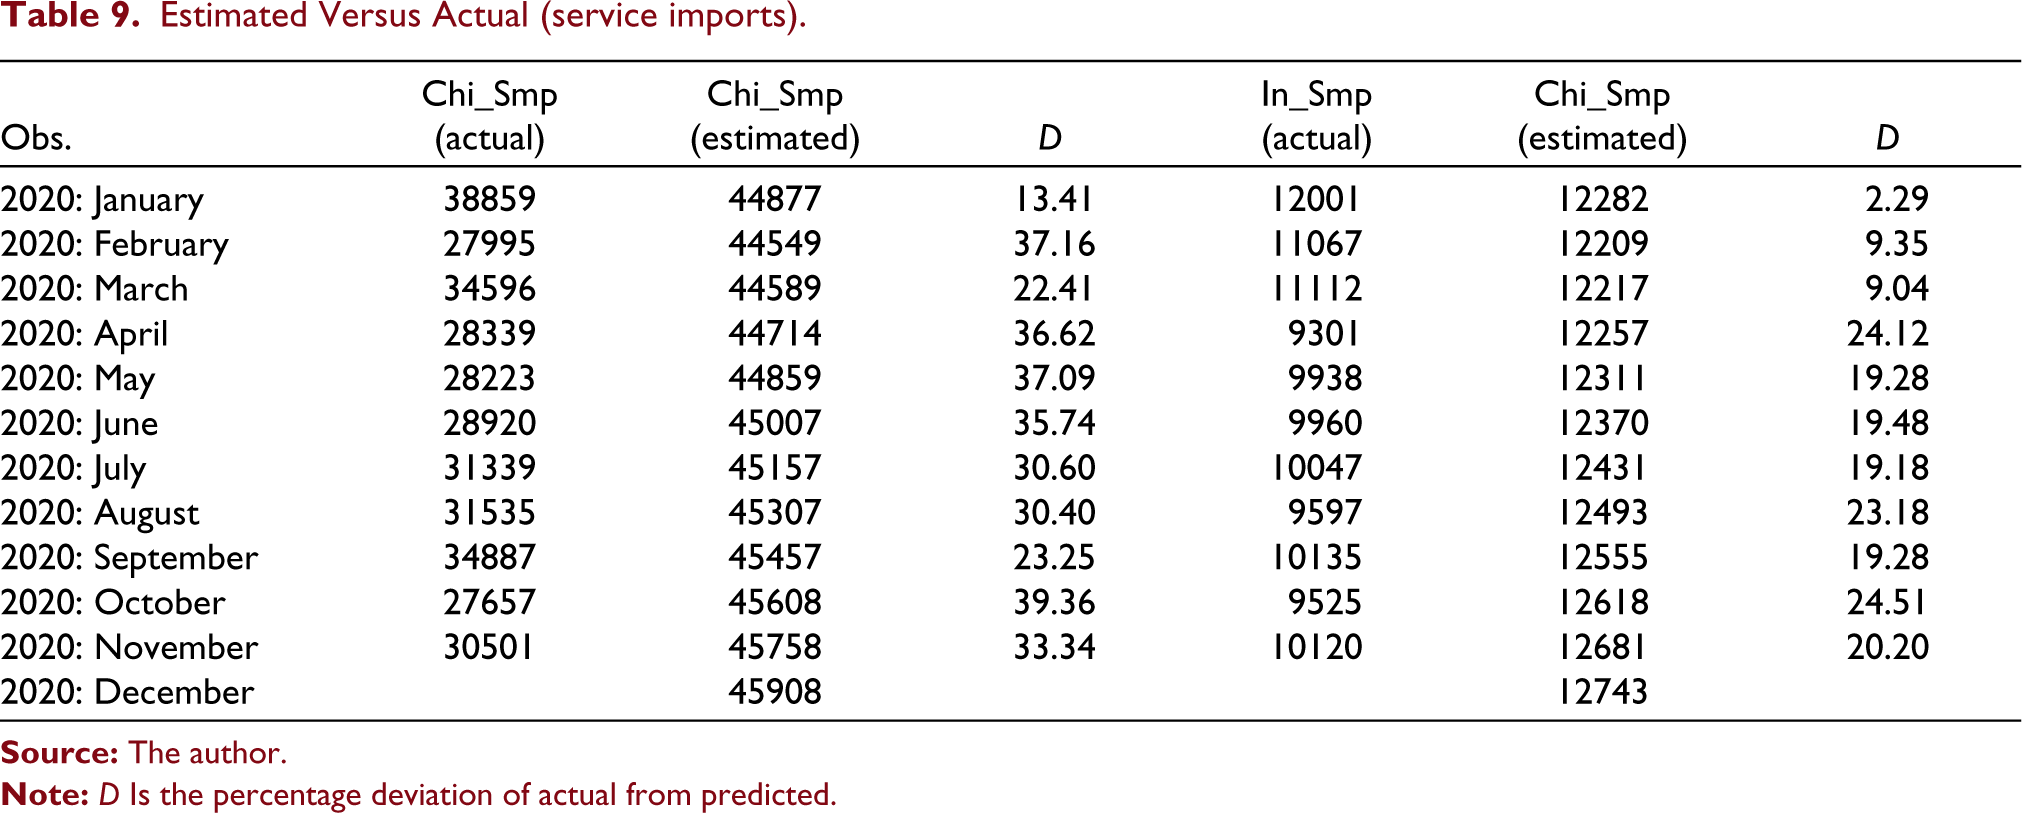
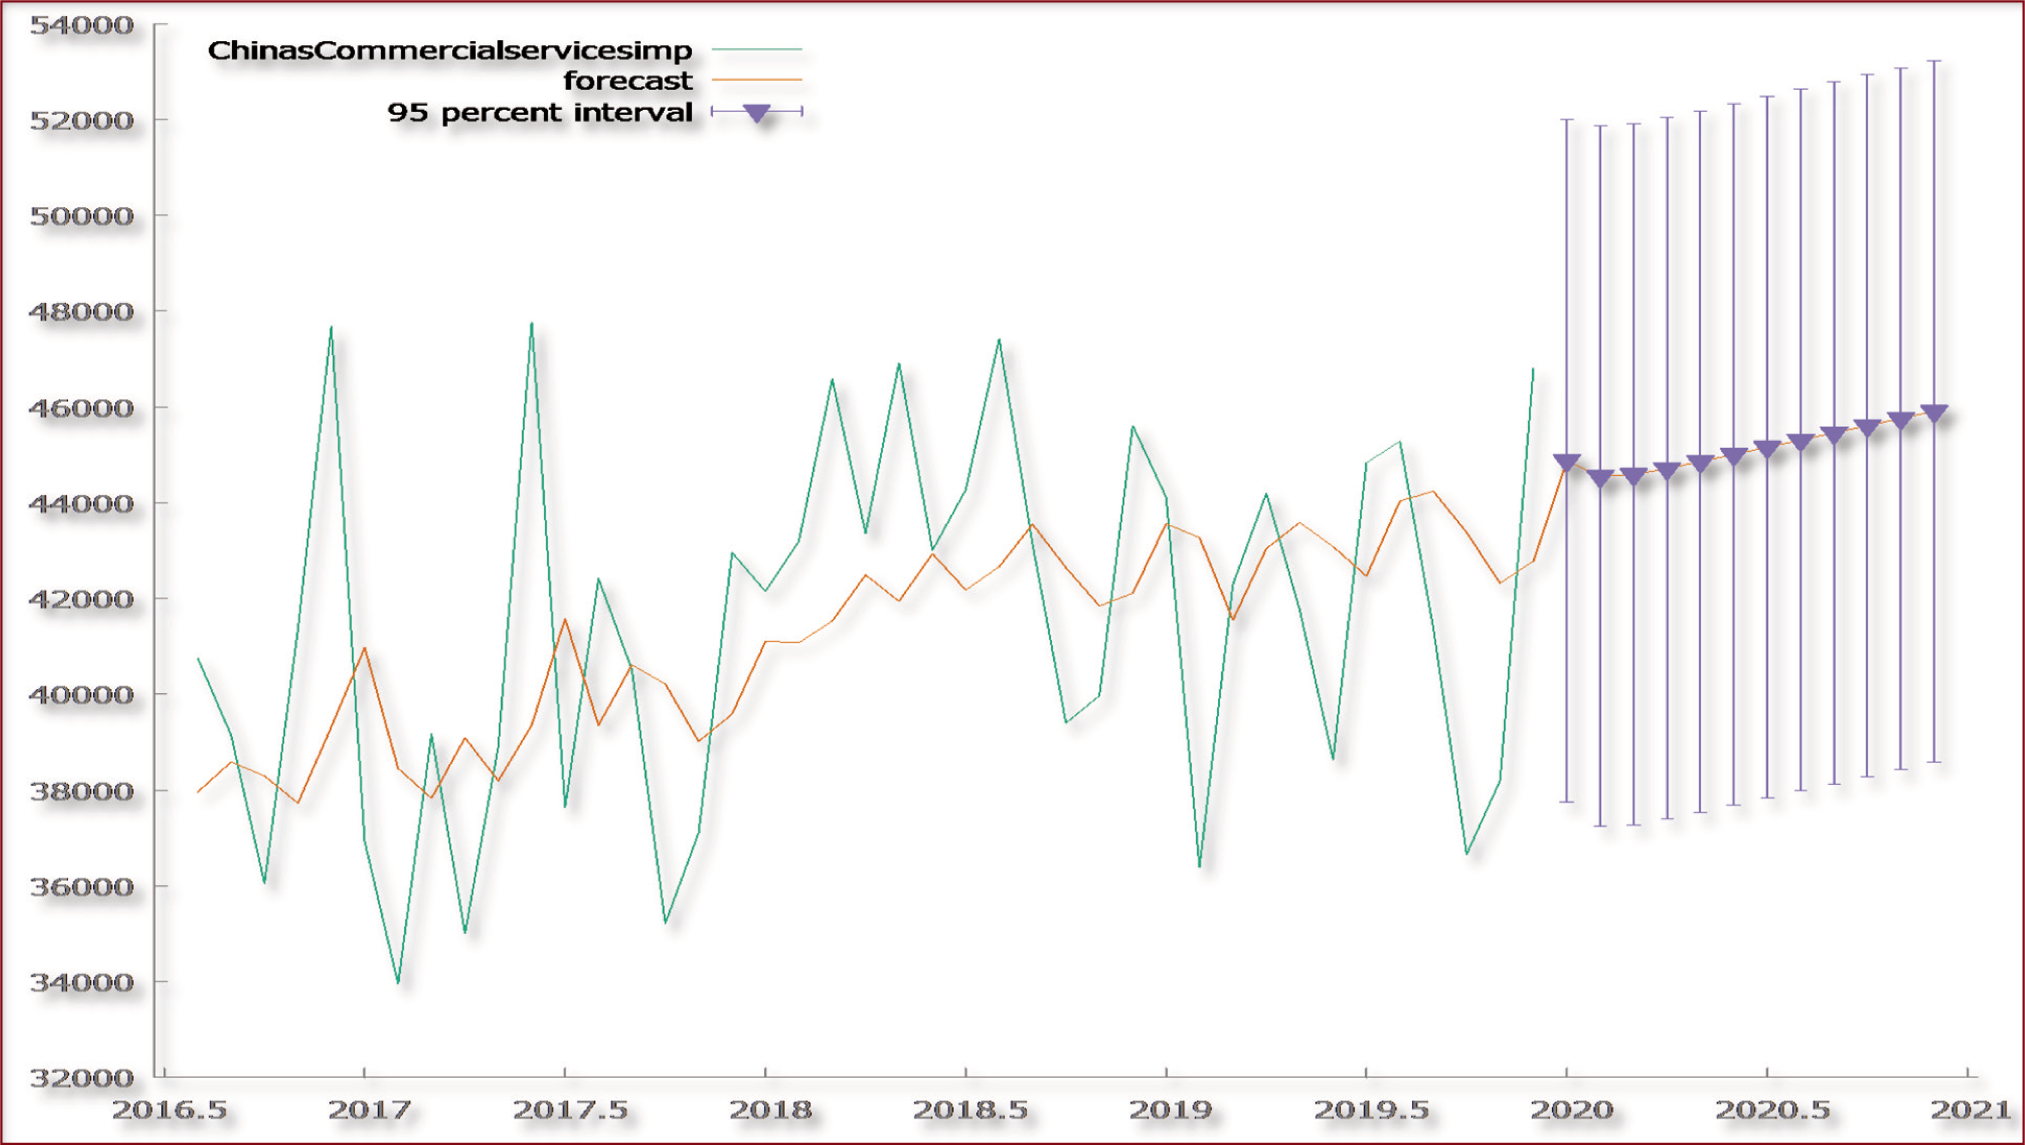
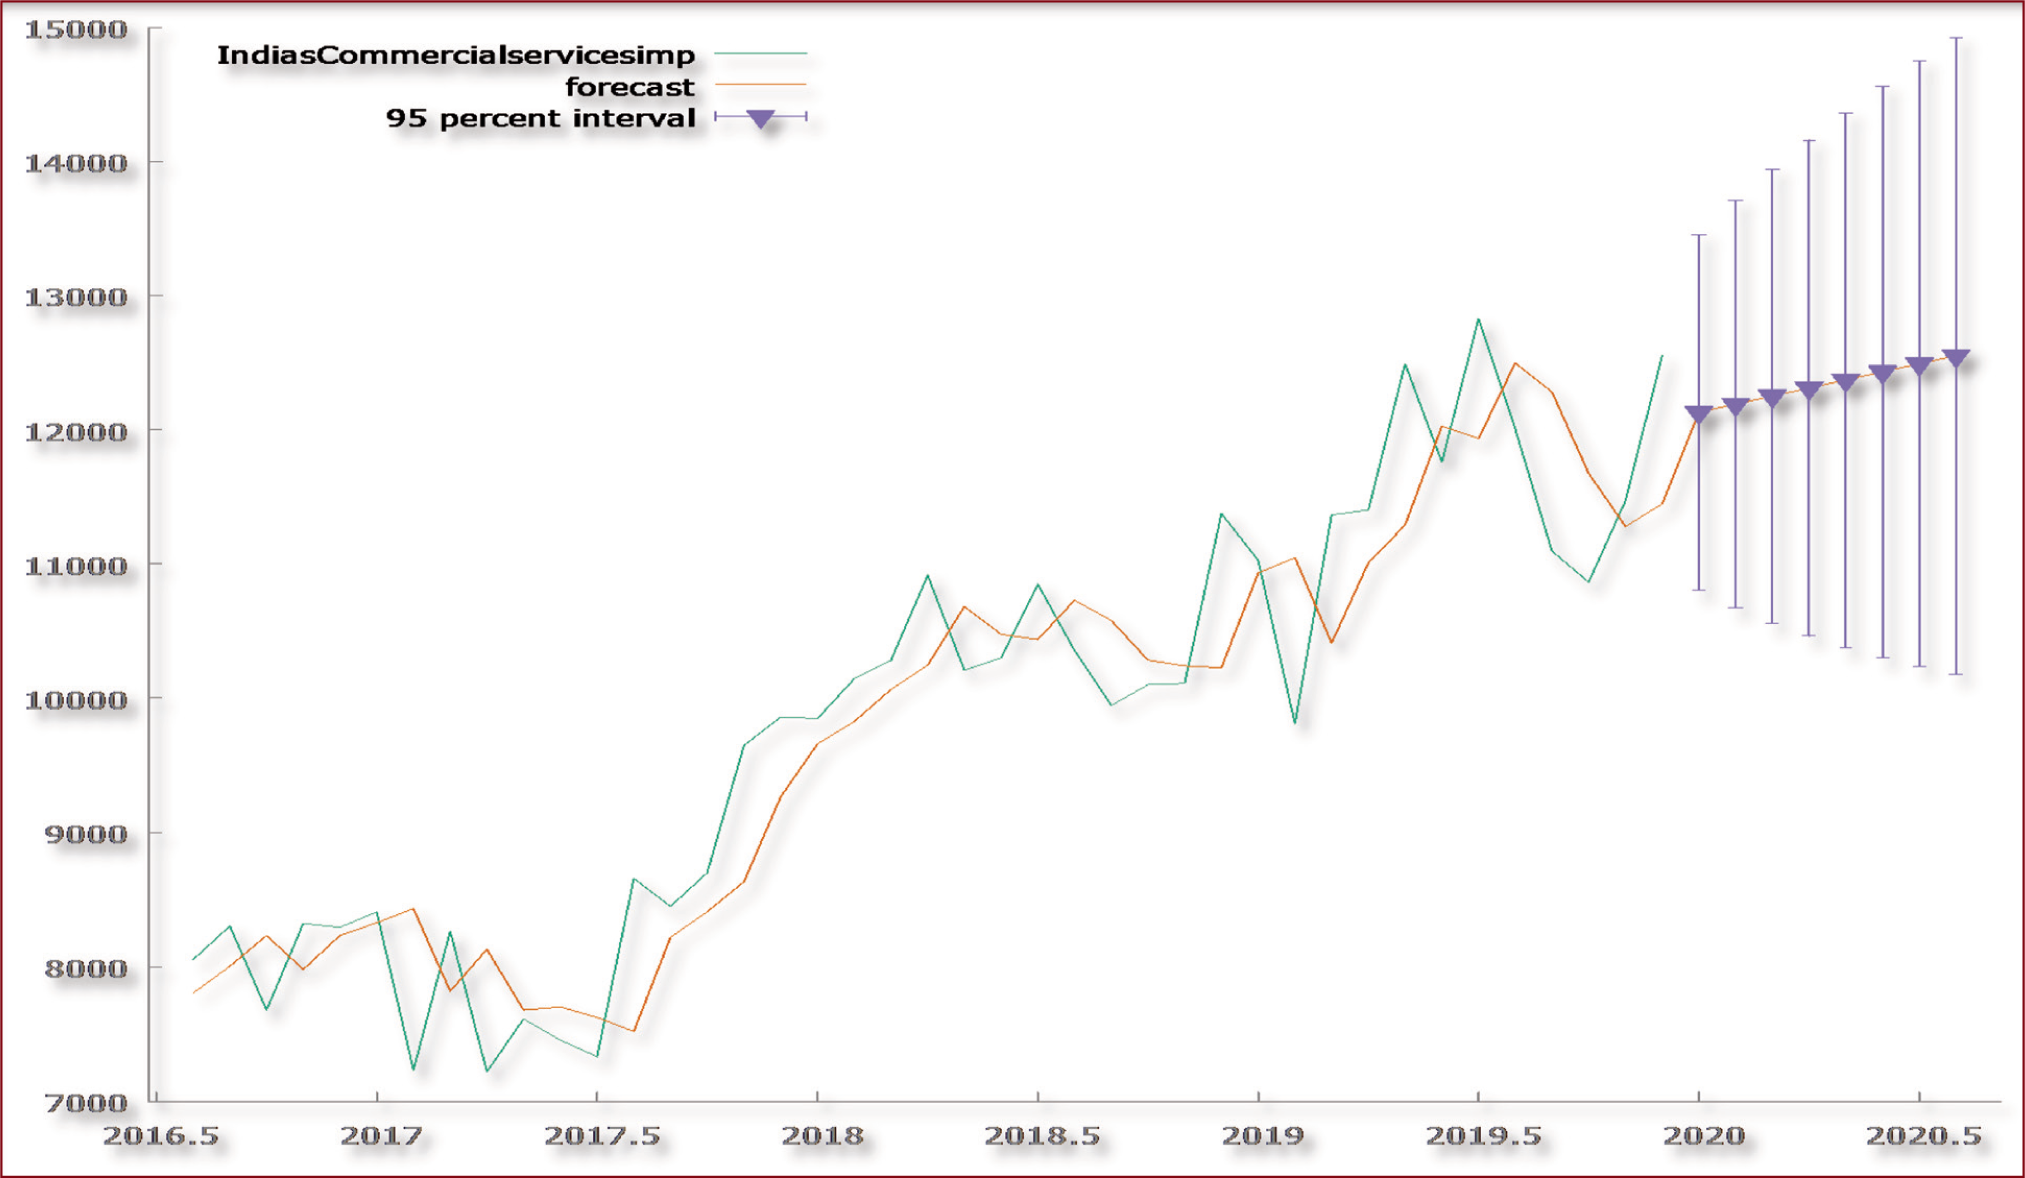
In Table 9, we have made a comparison between the deviations of actual from estimated service imports of India and China. Figures 23 and 24 present the estimated and actual service imports of China and India, respectively. Here also, we have omitted calculation for China’s service imports for the month of January 2020 due to non-availability of data. The negative deviation indicates that the actual performance of imports is higher than expected, and the positive values mean that the counties were unable to reach the estimated level of trade performance. As per the results from Table 9, we have calculated the average deviation of China and India for making comparison. The average deviation of China is 30.85% and that of India is 17.26%. Thus, we can observe that China’s service imports are impacted more than India’s service imports. The higher positive values in case of China indicate that China is lagging behind in case of service imports (the difference between estimated and actual is high).
Estimated Versus Actual (service imports)
Threats to Validity
It is difficult to calculate the effect in the same pandemic situation because of massive uncertainty, distinct period and length of COVID-19. The current study is limited to the comparison of merchandise and service trade of India and China (with the rest of the world). The analysis is restricted to a particular time frame, and a comparison was made only for the pandemic era. The contrast for the month of January could not be made due to the non-availability of data for that month (China’s goods and service imports and export data).
Conclusion and Future Research Direction
The current study successfully created the ARIMA models of times series. The findings of the current study suggest that India’s merchandise exports fluctuate more than China’s. China’s merchandise exports appear to be more stable after June 2020, but we can observe that there is still an unfavourable situation for India’s exports. We note more fluctuations in India than in China in the case of imports as well. Again, after June 2020, China’s imports are stable, but India is still at the height of uncertainty. In contrast to India’s service exports, China’s service exports are more affected by COVID-19. However, in the case of service exports, the effect of COVID-19 on both India and China is observed to be minimal. Given that the positive values suggest that actual exports of services were lower than expected and there are almost equal differences between actual and estimated exports of services, India’s service imports, as compared, are less affected than China’s service imports. The higher positive values for China suggest that, in the case of service imports, China is lagging behind. When we speak about the overall effect of COVID-19 on the foreign trade (merchandise and service) of both countries, we realize that India is more affected than China. In the month of April, the maximum impact of COVID-19 on India’s foreign trade can be observed (due to the complete lockdown in the country). India continues to face fluctuations in foreign trade, whereas China is now in the stage of revival. This could be due to the fact that the disease is transmitted in different countries at different times. The other reason for the same may be China is better positioned than other emerging economies to win the war against the pandemic (Liu et al., 2020). There is ample scope for researching foreign trade in various (underdeveloped, emerging and developed) world economies. A comparison spectrum can offer a more complex area for comparison during the pandemic phase and can be contrasted with its after-effects too. Studies for comparing India’s and China’s success can be extended in line with availability of data.
Managerial Implication
Evaluating the economic effect of the coronavirus pandemic (COVID-19) on the country’s foreign trade is important for policymakers but difficult because of the immense uncertainty surrounding COVID-19 and the lack of timely data. The consequences of the lockdown, supply chain disturbances and other factors are included in the current study’s trade data to demonstrate their impact on foreign trade. The outcomes of the study may be useful to policymakers. The current study provides insights for foreign trade policymakers to take advantage of the current situation in which, due to changing supply equations in the current pandemic, India can create an enormous market base for itself. The current study stimulates India to devise its future trade and investment strategy to place itself in the international trade arena.
Footnotes
Declaration of Conflicting Interests
The authors declared no potential conflicts of interest with respect to the research, authorship and/or publication of this article.
Funding
The authors received no financial support for the research, authorship and/or publication of this article.