
Abstract
The derivatives market has witnessed many positive experiences over the cash market, and it is leading to the price discovery process. It signifies that the price movements in the derivative segment strongly influence the cash market and that the cash market follows the derivative market for price determination. The price discovery happens in the derivative segment which is one of the functions of the derivative market. Both the futures and spot markets try to maintain equilibrium whenever disequilibrium occurs between the spot and futures market. Nifty IT futures and spot prices exhibit short-run relationship; whenever disequilibrium occurs in the co-integrated series, it is the futures market that makes greater adjustments in order to re-establish the equilibrium.
Introduction
Price discovery in futures trading relates unremarkably to using potential prices to see money market price expectations. Price exploration and hedging are the principal economic applications of futures contracts. Prices are determined by bid and demand, while value-influencing options differ stock by stock, why available corporate market investments are for portfolio diversification, inflation hedging and political uncertainty, quick liquidation and safe investment and so on. In general, price discovery is the method of uncovering the full details or a permanent value of an asset. Due to lower transaction costs and leveraged trading functions, derivatives markets increasingly absorb new knowledge quickly in comparison to the money market underlying it.
Future markets have a role in supplying price information because they rely on cash markets, and the contrary is also true. Examining the temporal trajectories of their pricing responses to the shared efficient price innovation distinguishes the major and satellite (leading and lagging) markets. The relative speed with which a market’s observed price moves to the new fundamental value following a shock to the efficient price, as well as the magnitude of cumulative pricing errors in the adjustment to the new fundamental value, is used to measure a market’s contribution to price discovery in this framework. As a result, our research provides a framework for directly quantifying price discovery patterns.
Steeley (2001) found the impact of the weekend on stock prices in the UK had gone. Systemic day-of-the-week effects, however, remain evident underneath the surface, even when returns are divided by market direction.
The lead–lag relationship in returns on stock index futures and the underlying stock index for the Australian market between 1992 and 1997 is examined by Frino and West (1999). We found that future returns preceded index returns by 20–25 minutes, and some proof of input from the stock market to the futures market was present (Frino & West, 1999).
Moosa (2002) looked at whether the crude oil futures market fulfils the role of price discovery and risk transfer. The study used daily spot data from January 1985 through July 1996 and possible one-month West Texas Intermediate (WTI) crude oil prices. He found that 60% of the price discovery work is performed on the futures market.
Thenmozhi (2002) found that India’s futures market leads the spot market by at least one to two days. They also note that the futures market has more influence in the distribution of knowledge and thus the leading position in price discovery has been found in this.
Chuang (2003) examined TAISEX (Taiwan Stock Exchange Capitalisation Weighted Index Futures) and MSCI (Morgan Stanley Capital International Taiwan Index Futures) price discovery efficiency during 1998–1999 and found strong statistical evidence of market efficiency in its weak form.
Zhong et al. (2004) investigated the hypotheses that the Mexican stock index futures markets served the price discovery function effectively and that the introduction of futures trading led to volatility on the underlying spot market using a total of 799 daily observations covering the period from 15 April 1999 to 24 July 2002. By using the vector error correction model (VECM) and exponential general autoregressive conditional heteroskedastic (EGARCH) models, the empirical evidence showed that the futures price index was a useful price discovery vehicle and future trading had also been a source of instability for the spot market (Zhong et al., 2004).
Liu and Zhang (2006) examined the process of price discovery and spillovers of volatility in Chinese spot–futures markets through the co-integration of Johansen, the VECM and the EGARCH bivariate models. The empirical results indicated that the models provided evidence to support long-term equilibrium relationships and significant bidirectional information flows between spot and futures markets in China, predominating futures.
Gupta and Singh (2006) analysed the framework for price discovery in the National Stock Exchange (NSE) spot and on the future market. The research uses index future S&P CNX Nifty’s regular closing prices, from June 2002 to February 2005. Using techniques such as Johansen and VECM empirically finds bilateral causality between the Nifty index and the futures. It has also been found that there is a greater causal relationship between Nifty futures and Nifty index than vice versa.
Praveen and Sudhakara (2006) have attempted to study the comparison of price discovery between stock market and the commodity future market. They have taken Nifty future traded on National Stock Exchange (NSE) and gold future on Multi Commodity of India (MCX). It was found that the stock market has well developed spot market due to its presence of national wide stock exchange, which provides the stock market a perfect platform for price discovery while the spot commodity market is far away from this platform because spot gold is not confined to one place.
Hoque et al. (2007) studied the market effectiveness of eight separate emerging Asian markets (Hong Kong, Indonesia, Malaysia, Korea, Singapore, the Philippines, Taiwan and Thailand). From April 1990 to February 2004, they took weekly closing rates. The basic findings were that five markets (Indonesia, Malaysia, Philippines, Singapore and Thailand) exhibit unique reversal and predictive behaviour of stock prices while two markets (Taiwan and Korea) exhibit certain mean reversal and unpredictable trends in time series.
Reddy and Sebastin (2008) studied the temporal relationship between the equities market and the derivatives market segments of the stock market. They tried to identify the lead-lag relationship between the value of a representative index of the equities market and the price of a corresponding index futures contract in the derivatives market. The study observed that price innovations appeared first in the derivatives market and were then transmitted to the equities market.
Debashish and Mishra (2008) examined the lead–lag relationships between the NSE Nifty stock market index and its related futures and options contracts, and also the interrelation between the derivatives markets. The study finds that both the index futures and index options contracts lead the cash index.
Zhang et al. (2010) tested the stochastic process hypothesis and weak market power in the VIX futures market using some sort of testing. A unit root within the aggregate value series suggests an economical exchange for the VIX futures. For the individual VIX futures value sequence, 51 of 54 futures contracts fulfil the appropriate condition for an effective associate market: The prices are found to follow a random walk either as a result of a unit root or as a result of the increases are not correlative.
Theissen (2012) discussed the issue of value discovery in spot and futures markets. He used a model for threshold error correction to allow arbitrage opportunities to have a sway on the dynamics of return. The futures market has been found to lead in the price discovery process.
Choudhary and Bajaj (2013) investigated the role of price discovery within the Indian exchange by considering 41 individual and Nifty securities. This study finds that each market, that is, futures and spot, plays a crucial role in price discovery, meaning that futures (past) prices may contain useful past (future) price information.
Agarwalla et al. (2015) looked at the 2010 National Exchange of India presentation of the distance decision auction. The results cause the auctions to attract little interest, the intraday pattern of interest and volatility within the continuous market remains unchanged, and an outsized fraction of price discovery, determined by the weighted price contribution, still exists within the initial 15 minutes of the continuous market.
Sridhar et al. (2016) conducted an empirical study on the silver market to examine price discovery in the commodities market. The Granger causality test reveals that futures and spot prices do not have a bi-causal relationship. The Error Correction Estimates reveal that while the spot price does not cause the future price, it does impact it in one lag. Future price, on the other hand, neither causes nor influences the spot price in two lags. As a result, the spot price does not cause the future price in the same way as the future price does not cause the spot price. It indicates that information is not being disseminated in a reliable manner between future and spot prices.
Chen and Tsai (2017) used Hasbrouck’s (1995) and Gonzalo and Granger’s (1995) respective information-share and common factor variable weight approaches. The empirical results also show that news announcements about macroeconomic issues in the United States are increasing the dominant role of VIX futures in the overall price discovery process. Compared with VIX exchange-mutual securities and the volatility indexes on non-US stock mutual funds, this dominant position remains unchanged.
Lin et al. (2018) explored the role of investor sentiment in spot and futures market price dynamics. Empirical evidence shows that investor sentiment has a positive effect on price volatility and the spread of bid–ask on both the spot and futures markets, which causes a higher risk of arbitration and cost of trading during high sentiment. Our results endorse the principle of limits to arbitration.
Kapar and Olmo (2019) studied the period from December 2017 to May 2018 and noted that deviations from the state of equilibrium equating the futures and spot log price have predictive potential to return on the spot price of Bitcoin but not on the price of the future.
The existing literature analysis provides ample evidence that the stock futures market is an efficient price discovery vehicle. Futures and spot markets were found to have a substantial causal link in studies conducted even in India. Although earlier literature indicates that futures pricing derives fair value from spot market prices, empirical study shows that futures prices lead spot prices. Furthermore, empirical studies on the Indian capital market’s price discovery role are limited, and most of the studies evaluate the price discovery role using the CNX Nifty index or a few stocks. This study aims to analyse the role of price discovery in the Indian capital market by exploring the causal relationship between futures and spot prices. However, it is important to note that each index has its own unique characteristics.
Objectives of the Study
To investigate the price discovery and causal link between the spot and futures market through empirical observation.
To check empirically if the future market or spot market is responding faster to the deviation from the equilibrium value.
Hypotheses
H01: Futures price does not cause the spot price.
H02: Spot price does not cause the futures price.
H03: There is no long-run association between futures and spot prices.
H04: There is no short-run association between futures and spot prices.
Data and Methodology
The analysis used mainly secondary data. The secondary data were taken from NSE, India’s official website (
Causality Effects Between Futures and Spot Market of the Indices
There are many methods available for conducting the co-integration test, the most commonly used method includes the residual Engle–Granger (1987) and Johansen–Juselius (1990) tests. Then the Engle–Granger co-integration test is a two-pronged operation. In the first stage, the residual error will be checked on stationarity. Variables Y and X may not be stationary independently but Y and X are said to be co-integrated if their residual error estimate is stationary.
Augmented Dickey–Fuller test was initially used to examine the price linkage between the futures market and the spot market. Using the Johansen co-integration test, co-integration analysis was carried out to calculate the degree to which two markets reached long-term equilibrium. The Granger causality test was used to verify the causality. Error correction dynamics describe the mechanism of price discovery, whereby markets strive to find balance.
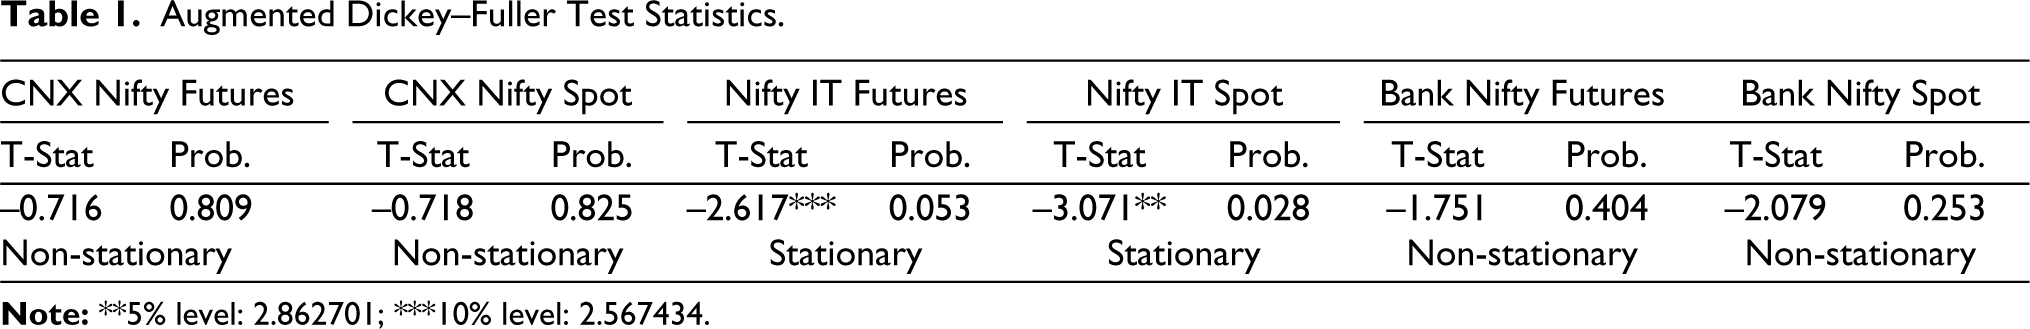
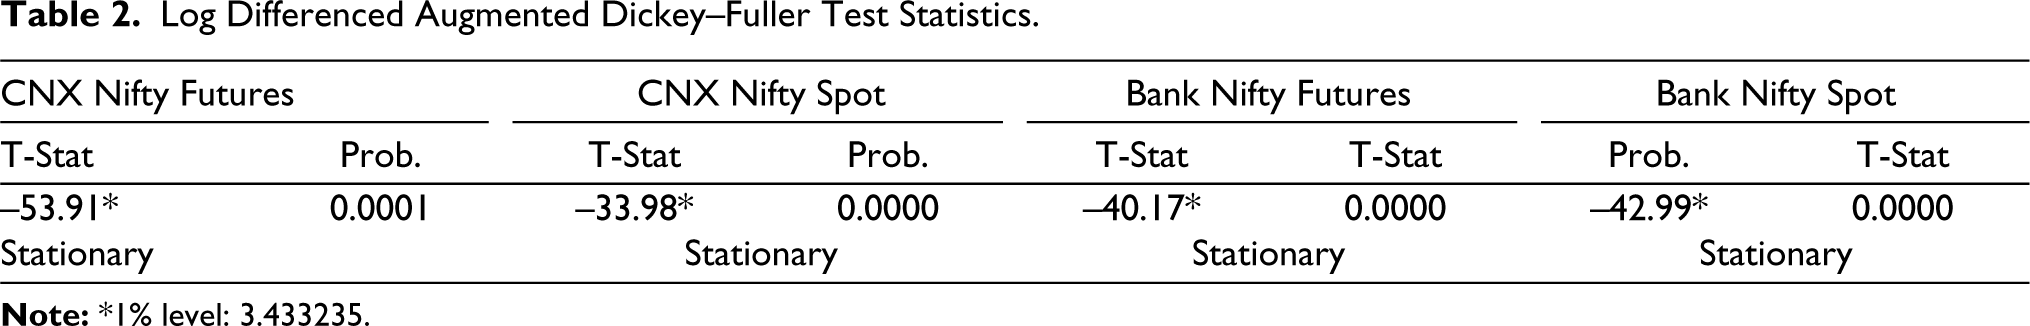
The following hypothesis is believed to be null hypothesis H0: There is a unit root in the series (non-stationary); alternative hypothesis H1: There are no unit roots in the series (stationary). The value of the index values observed for CNX Nifty is non-stationary, and the Nifty Futures and Spot Values also imply the non-stationary value. Thus, in CNX Nifty Futures and Spot after applying the value differentiated log transform log is necessary to know the value movements, the result observed with the value of and for futures and spot coefficient respectively. Bank Nifty futures and spot log differences ADF test and T-Stat show values of 40.17 and –42.99, respectively. Nifty IT futures and spot have meaningful value without converting the log difference. The stationary outcome indicates that, at a confidence level of 5%, the significance of the T-test is lower than the appropriate value (1.96). Hence, the null hypothesis is rejected and the alternative hypothesis is accepted. Thus, it can be argued that the spot price data are stationary (Tables 1 and 2).
Johansen Co-integration
The number of independent linear combinations (k) is related to the assumed number of common non-stationary underlying processes (p) as p = m − k. The three plausible outcomes are: (i) k = 0, p = m. In this case, time-series variables are not co-integrated. (ii) 0 < k < m, 0 < p < m. In this case, the time-series variables are co-integrated. (iii) K = m, p = 0. All time-series variables are stationary I(0) to start with. Co-integration is not relevant here.
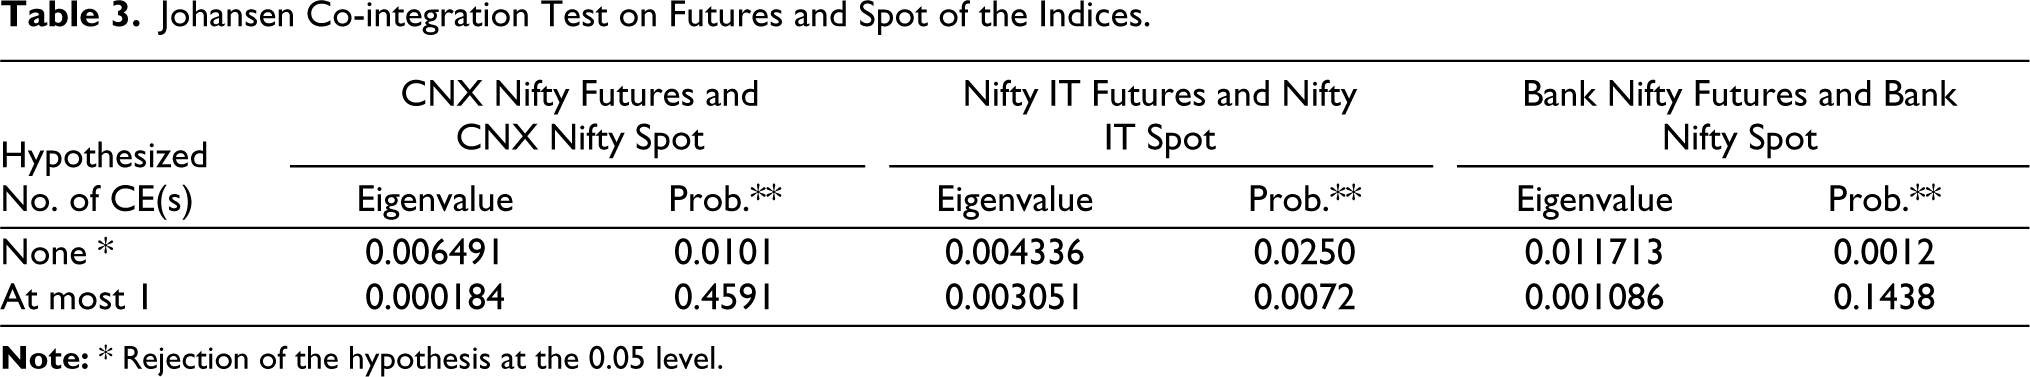
The test results of co-integration of three indices, after using the Trace statistics and maximum eigenvalues statistics, identified that there exists one co-integrating equation between the futures and spot prices. The first hypothesis is that there was no co-integration, the observed p value is less than 5%, so we can conclude that the null hypothesis can be rejected. The second hypothesis is at most one co-integration exists between futures and spot markets, since the observed p value is more than 5% in all the indices. So we cannot reject the null hypothesis. It can be concluded that among all three indices, a relationship that exists between futures and spot prices. The co-integration shows that spot and futures prices of three indices are co-integrated, and there exists at most one co-integrating relationship between them. In other words, spot and futures prices share common long-run information (Table 3).
Granger (1986) and Engle and Granger (1987) provide a more comprehensive test of causality, which specifically allows for a causal linkage between two variables stemming from a common trend or equilibrium relationship.
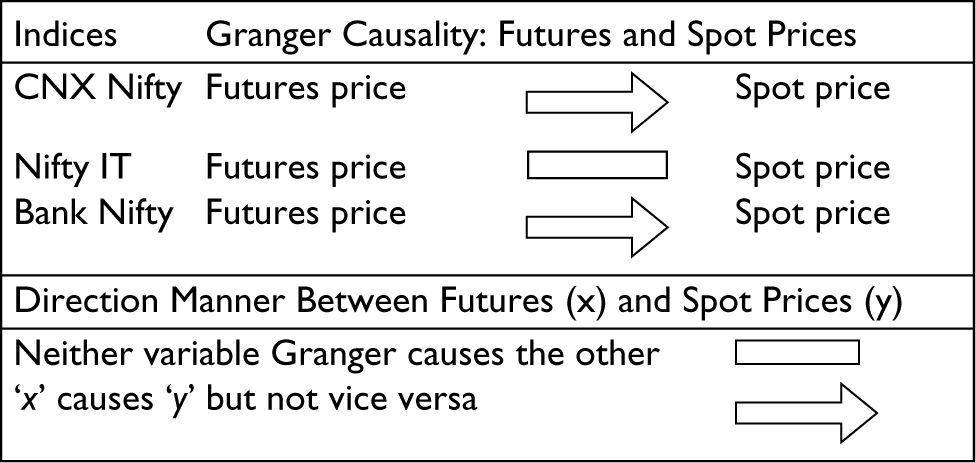
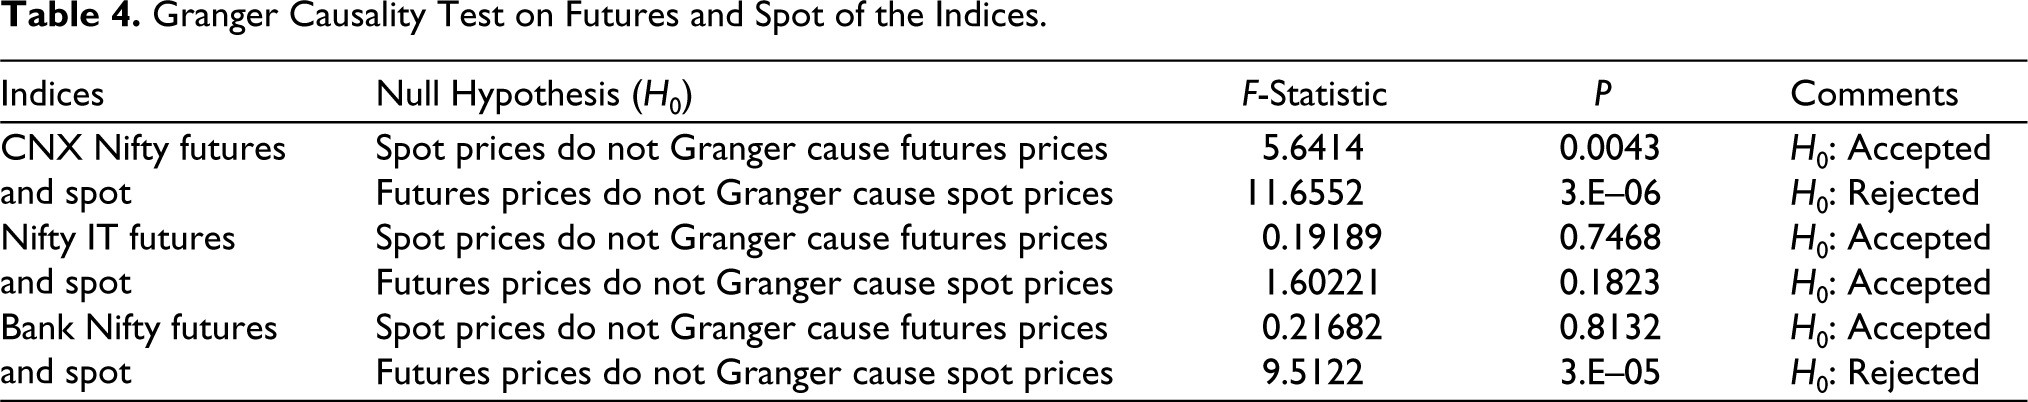
The Granger causality test is between Nifty futures and spot (Figure 1), where Nifty futures significantly granger on spot at a meaning level of 5%. The same is followed by Bank Nifty futures and the spot market. Spot prices do not affect the future price, while the spot prices are induced by the Bank Nifty futures price. Similarly, the magnitude of F coefficients implies that cash markets are strongly induced by the Indian equity futures market. On Nifty IT futures, the Granger causality test result is seen and spot has not found any causal and impact relationship, meaning the futures price does not affect the spot price; similarly, the future price is not affected by the spot price. There is no long-run relationship between Nifty IT futures and spot markets, though there might be a strong relationship to market discovery in the short run (Table 4)
Granger Causality Test Result Direction Between Futures and Spot Prices.
The process of price discovery is analysed through a VECM. It introduces error correction features like a vector autoregression model to a multi-factor model. Protection prices on the same underlying asset price in a frictionless market should be perfectly correlated; therefore, there will be no lead–lag relationship.
In the vector error correction estimates given above, the probability value is highly significant at the 1% level. Also, the co-integrating equation value is less than 1 for the futures market. It signifies that the spot market is dominant in the price discovery process. It is a clear indication that the spot market of gold is information efficient in India. This could be attributed to the efficient transmission of information among traders in the spot market as they tend to trade more frequently. The coefficients (DS and DF) of the error correction terms provide some insight into the adjustment process of spot and futures prices towards equilibrium in all types of contracts, which means that the error correction terms represent a mean-reverting price process.
Augmented Dickey–Fuller Test Statistics.
Log Differenced Augmented Dickey–Fuller Test Statistics.
Johansen Co-integration Test on Futures and Spot of the Indices.
Granger Causality Test on Futures and Spot of the Indices.
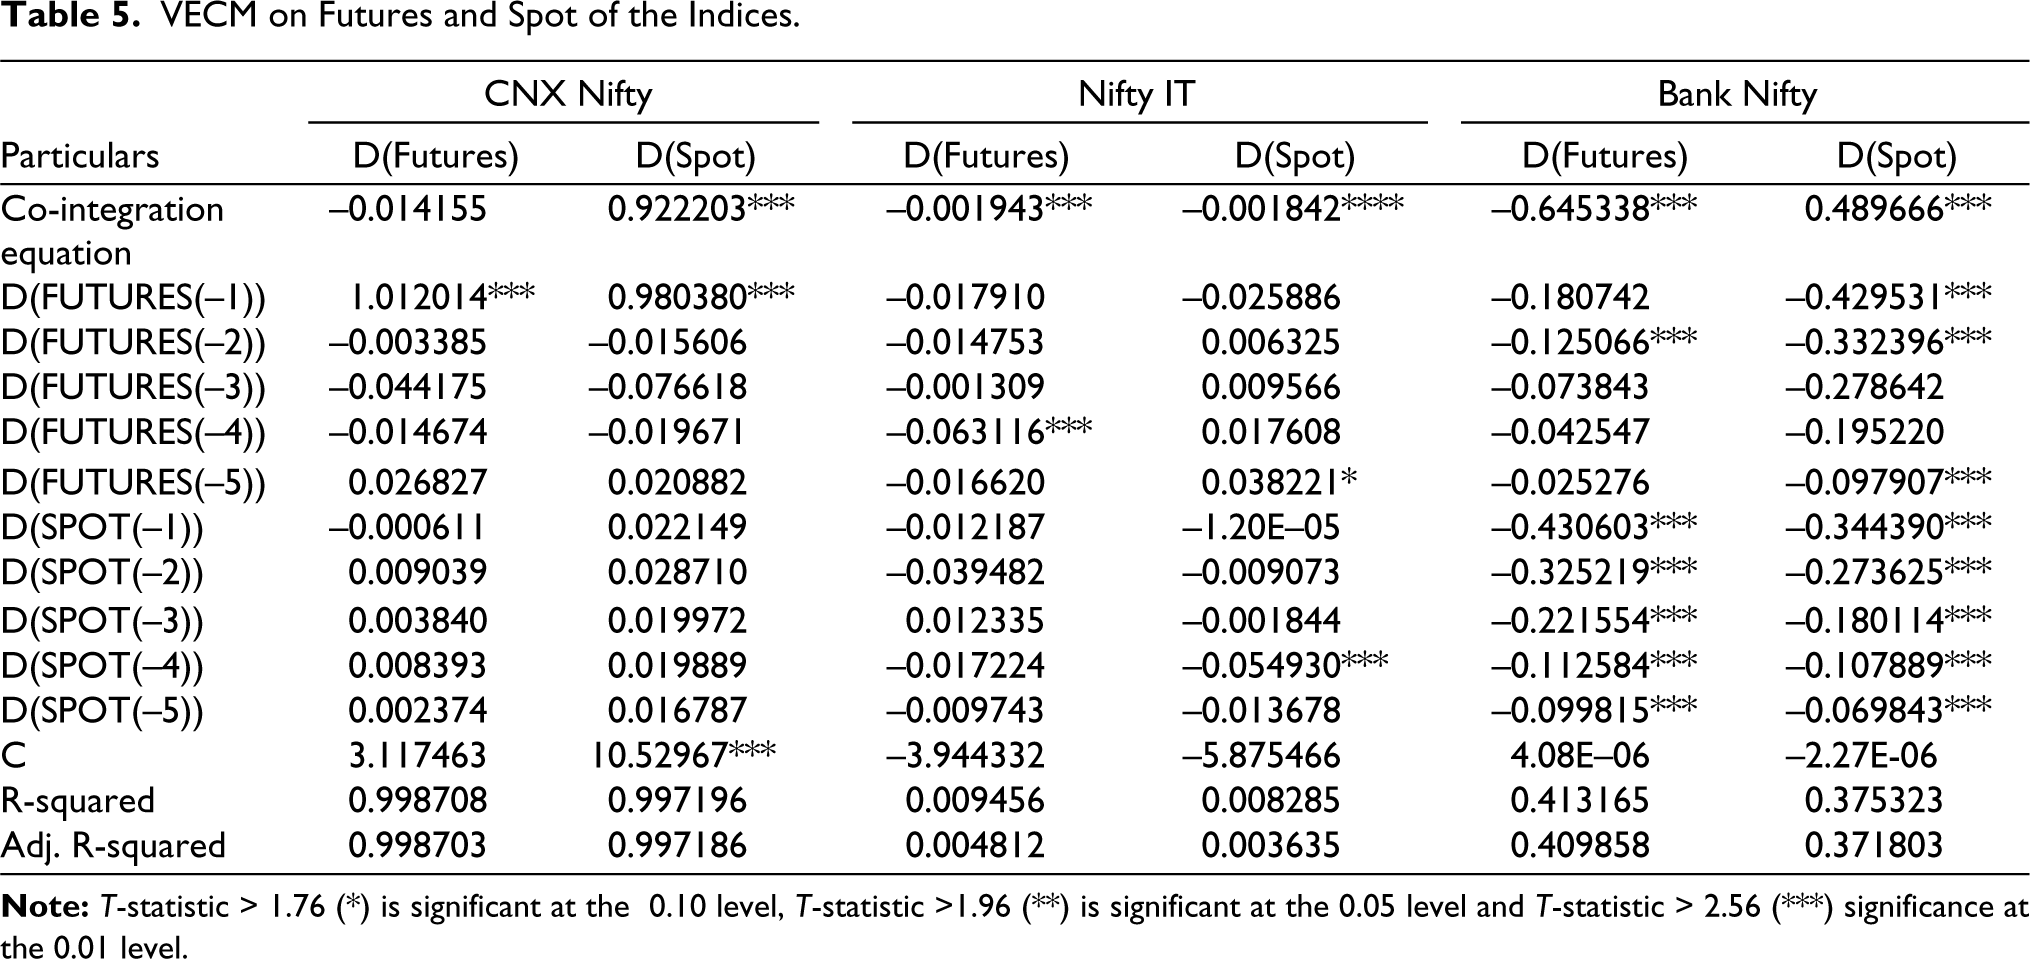
The error correction forecasts of CNX Nifty futures and spots have shown that future prices will cause themselves (significant 1%) and affect future market lags at 1 (significant 1%) as well. On the other hand, spot prices alone do not cause potential price lags nor they do not affect them. Nifty IT futures are causing significant by themselves at a fourth lag at a substantial level of 1%, and it is found that the fifth lag order has its effect on futures’ spot price (10% significant). The spot prices of Nifty IT cause their impact to lag by itself at 4 (significant 1%). Bank Nifty futures have shown cause on their own in the first 3 lags order, but it substantially influences spot prices in all 5 lags at a substantial 1% level.
Bank Nifty spot has a significant effect on both its own and future prices at a significant level of 1% in all 5 lag orders. It seems that the relationship between the Bank Nifty spot and the prices of Bank Nifty futures is long run. It implies that improvements have been made by both the future market and the spot market to sustain a long-term relationship if there is an imbalance. The term for correction of CNX Nifty errors has been deemed significant in both equations. It means that every time a spot-to-future market imbalance occurs, both the future and the spot market strive to maintain equilibrium. The short-run relationship is seen by Nifty IT futures and spot prices, while the co-integrated disequilibrium series occurs. It is the market for futures that allows for further adjustment to restore equilibrium (Table 5). Continuous activity should be taken to raise investor awareness so that they can park their money in the capital market with proper knowledge of the risk and return involved in the business. As a result, the heterogeneous group participating in the market may establish an efficient and good market. At the same time, this cannot be done without offering products that allow market participants to profit. In terms of volume traded in developed nations, Indian stock derivative markets are quite modest. It is necessary to conduct research in order to comprehend how developed markets designed their regulations and risk models. It is assisting our Indian markets in developing in a structured manner while avoiding big financial difficulties.
VECM on Futures and Spot of the Indices.
Note: T-statistic > 1.76 (*) is significant at the 0.10 level, T-statistic >1.96 (**) is significant at the 0.05 level and T-statistic > 2.56 (***) significance at the 0.01 level.
A long-term strategy for developing the derivative market sector could be devised in order to expand its scope in the future. When it comes to establishing new derivative products and operations, regulators must evaluate both micro and macroeconomic issues.
In the process of price discovery, information technology has played a critical role. Technology also connects many markets all around the world, allowing markets to access real-time data and information without delay. As a result, effective technology becomes critical in instilling investor confidence.
There is a perceived need for a single regulator to ensure efficient and effective market functioning. Forming such a body and revising relevant laws should be done in the future. Operational issues must be thoroughly addressed by exchanges on a regular and effective basis.
Conclusion
The derivatives market has had a lot of good experiences compared to the cash market, and this is leading to the price discovery process. It means that the derivative market’s price fluctuations have a significant impact on the cash market and that the cash market follows the derivative market in determining price. The derivative segment, which is one of the functions of the derivative market, is where price discovery takes place. It leads to price stabilisation and a reduction in price volatility. As a result, the prices of futures and spot markets will have complete positive contemporaneous co-movement.
The Bank Nifty spot and Bank Nifty futures prices appear to have a long-term link. If there existed disequilibrium, it shows that both the future market and the spot market made changes to maintain a long-term relationship. If there is a difference in the co-integrated chain, the short-run relationship shows Nifty IT futures and spot pricing. It may be concluded from the impacts of Granger causality that the spot price fluctuations indices lead or influence futures prices. If a present-to-future market imbalance exists, both the future and current markets seek to maintain equilibrium. When disequilibrium emerges in the co-integrated series, the futures market makes more adjustments to re-establish the equilibrium.
Footnotes
Declaration of Conflicting Interests
The author declared no potential conflicts of interest with respect to the research, authorship and/or publication of this article.
Funding
The author received no financial support for the research, authorship and/or publication of this article.