
Abstract
Background
The availability of non-invasive means to evaluate and monitor tendon-bone healing processes in-vivo is limited. Micro Positron-Emission-Tomography (µPET) using 18F-Fluoride is a minimally invasive imaging modality, with which osteoblast activity and bone turnover can be assessed. The aim of this study was to investigate the use of serial in-vivo µPET/CT scans to evaluate bone turnover along the graft-tunnel interface in a rat ACL (anterior cruciate ligament) reconstruction model.
Methods
Unilateral autograft ACL reconstruction was performed in six rats. µPET/CT-scans using 18F-Fluoride were performed 7, 14, 21, and 28 days postoperatively. Standard uptake values (SUV) were calculated for three tunnel regions (intraarticular aperture (IAA), mid-tunnel, and extraarticular aperture (EAA)) of the proximal tibia. Animals were sacrificed at 28 days and evaluated with µCT and histological analysis.
Results
SUVs in both bone tunnels showed an increased 18F-Fluoride uptake at 7 days when compared to 14, 21, and 28 days. SUVs showed a gradient on the tibial side, with most bone turnover in the IAA and least in the EAA. At 7, 14, 21, and 28 days, there were significantly higher SUV values in the IAA compared to the EAA (p = .01, < .01, < .01, < .01). SUVs positively correlated with new bone volumetric density obtained with μCT (r = 0.449, p = .013). Volumetric density of newly formed bone detected on μCT correlated with osteoblast numbers observed along the tunnels in histological sections (r = 0.452, p < .016).
Conclusions
Serial in-vivo µPET/CT-scanning has the potential to provide insight into bone turnover and therefore osteoblastic activity during the healing process. As a result, it allows us to directly measure the effect of interventional strategies in tendon-bone healing.
Keywords
Introduction
Reconstructive surgical procedures, such as anterior cruciate ligament (ACL) reconstruction, require healing of a tendon graft inside a bone tunnel. The healing process proceeds by formation of a fibrovascular scar tissue interface between tendon and bone, followed by bone ingrowth into this interface tissue. 1 Our previous work showed that bone formation at the tendon-bone interface represents the critical healing factor. 2 However, the spatial and temporal progression of bone ingrowth is poorly understood. This lack of knowledge derives in part from computerized tomography being the only means to investigate in vivo enthesis healing, as well as from the limited number of studies monitoring the healing process over time in vivo. Until now, biologic factors that control new bone formation over time could not be investigated in vivo.
Micro Positron Emission Tomography (μPET) is a minimally invasive imaging modality that permits quantification of biochemical processes in vivo by measuring distribution of tracers labeled with positron emitting radionuclides. 18F-Fluoride has proved to be an excellent bone imaging radiotracer that correlates with osteoblastic activity similar to the 99mTc-diphosphonate tracer used in SPECT imaging.3,4 18F-Fluoride diffuses from capillaries into bone extracellular fluid where it exchanges ions with the hydroxyl groups in hydroxyapatite to form fluoroapatite at sites of bone remodeling and high turnover.3,5 Several studies have demonstrated that 18F-Fluoride is more accurate than technetium-99m-diphosphonate SPECT for the evaluation of bone activity. 6 A study using 18F-Fluoride PET scan to measure bone turnover in human patients following ACL reconstruction demonstrated the feasibility and utility of this means to evaluate bone metabolic processes in a tendon-bone tunnel healing model. 7
Micro-Computed Tomography imaging (μCT) is a high-resolution imaging modality, with which bony changes can be evaluated over time. It has become a standard tool for preclinical assessment of bone architecture. However, in contrast to PET imaging, CT scan does not evaluate bone metabolism. Combining PET with CT scan provides the possibility to assess bone metabolism while maintaining a high resolution of the tissue. This may contribute towards better understanding of the above-mentioned biologic factors that control new bone formation and therefore the bone healing process.
The aim of this study was to evaluate the use of combined serial 18F-Fluoride PET (μPET/CT) and μCT scans to assess bone metabolism during tendon-to-bone healing in vivo in an established rat model of ACL reconstruction. 8 We hypothesized that serial weekly μPET/CT scans would be feasible in rats. Additionally, we investigated whether this method could capture differences in bone turnover along the graft tunnels and demonstrate the sequence of events occurring during the healing process.
Materials and methods
This study was approved by the Institutional Animal Care and Use Committee of our institution (IACUC protocol #05-12-03R).
Surgical procedure
Six male Sprague-Dawley rats (12 weeks old; weight 250–300 g; Harlan Laboratories, Indianapolis, Indiana, USA) were used for this study. All animals were housed in individual cages and allowed free cage activity for one week before undergoing ACL reconstruction on the right lower limb. 9 In surgery, a flexor digitorum longus autograft was harvested from the right lower limb, followed by a medial parapatellar arthrotomy. The knee was then flexed to approximately 60° and the ACL was sectioned. A 1.4 mm Kirschner-wire (MicroAire, Charlottesville, VA, USA) was used to drill the tibial and femoral tunnels. After placement of a 3-0 Ethibond suture (Ethicon, Somerville, New Jersey, USA) in each end of the tendon graft, it was shuttled through the drill tunnels in order to replace the native ACL. The graft was then pre-tensioned to 5N and secured to the femur and tibia using a 3–0 surgical steel suture (Ethicon, Ethicon Inc., Johnson & Johnson, Brussels, Belgium) which was placed through a drill hole adjacent to each tunnel exit. Animals were allowed free cage activity with rat chow and water ad libitum post-surgery.
Control of post-operative knee motion and graft loading was done using an external fixator. Two parallel 0.9 mm threaded pins (MicroAire) were placed from lateral approximately 5 mm apart into the proximal part of the tibia and the distal part of the femur. The external fixator was then secured to the femoral and tibial pins (Figure 1). The rats were randomly assigned to immobilization (n = 3) or daily loading (n = 3) groups. In the daily loading group, the external fixator was removed once per day with the animal under light general anesthesia (1.5–2.5% isoflurane) and the knee was loaded for 50 cycles in a range of 0–90° of flexion using a custom designed, computer-controlled knee motion device. All animals were euthanized by CO2 asphyxiation after 28 days. Post-operative knee motion and graft loading were controlled with an external fixator. In the daily loading group, the external fixator was removed once per day and the knee was loaded for 50 cycles from 0–90° of flexion.
Micro-positron emission tomography
At 7, 14, 21, and 28 days after ACL reconstruction, 18F-Fluoride was injected in each animal, followed by μPET/CT using an Inveon μPET/CT system (resolution 98 μm, Siemens Medical Solutions, Knoxville, TN, USA). 18F-Fluoride was prepared according to the method described by Satyamurthy et al. 10 and injected in the tail vein under general anesthesia (1.5–2.5% isoflurane). The mean administered 18F-Fluoride activity was 1.3 mCi. CT scans were performed immediately prior to the μPET scans for anatomical localization and attenuation compensation for the μPET reconstruction. The projections were acquired at 80 kvp and 0.5 mA with a pixel size of 98 μm and then reconstructed into 480 × 480 × 667 matrix with a voxel size of 196 μm. μPET scans were started 40 minutes post injection, with a 20 minute scanning time. The images were reconstructed using the OS-EM3D/MAP (2 Iteration and 16 subsets), with a voxel size of 0.78 × 0.78 × 0.80 mm in 128 × 128 × 159 matrix.
Reconstructed CT and μPET images were fused using the image software Inveon Research Workplace (Siemens Medical Solutions), while the process was subsequently visually confirmed. For analysis, each bone tunnel and its surrounding bone were divided perpendicularly into three equal cylindrical regions of interest (ROI) on CT scans: intra-articular aperture (IAA), mid-tunnel (MT), and extra-articular aperture (EAA) (Figure 2). The visual tunnel sectioning was performed due to previously demonstrated differences in bone remodeling along the tunnel.
2
Each bone-tunnel/surrounding bone was divided into three equal regions of interest (ROI). For each ROI, 18F-Fluoride tracer uptake values were calculated and normalized to the total injected dose and the uptake value of the gluteal muscles of the opposite side to derive a standard uptake value (SUV).
18F-Fluoride tracer uptake values in the PET scans were calculated for each ROI.
Normalization of the tracer activity in the PET scans
In our study, the tracer activity in the bone tunnel was normalized to that of the total injected dose by the following calculation: SUV = [Regional Activity Concentration (MBq/ml) * Body Weight (g)]/Total Injected dose (MBq). This SUV is a semi-quantitative value and is used in clinical PET studies as well. 11
To then further allow comparison between different animals at the same time point and between different time points in one animal, the SUV in the bone was normalized to the SUV in gluteal muscle of the contralateral side. Muscle was chosen as a reference tissue because it does not take up 18F-Fluoride and allows background estimation of activity in each animal. A standardized normalization to the opposite, non-operated knee was not possible since the native ACL does not attach inside a bone tunnel; hence, the delineation of the ROIs would have been inaccurate. This approach allowed comparison between different time points within each animal and between different animals at the same time point.
Tissue Evaluation with Micro-CT scan and Histology
After sacrifice, the operated proximal tibia and distal femur of each rat were harvested. The graft was cut in order to separate the tibia and the femur. To evaluate trabecular bone mineral density and bone volume, specimens were analyzed after dissection using µCT with Scanco µCT 35 (resolution of 15 μm, Scanco Medical, Brüttisellen, Switzerland). The following scanning parameters were used: 15 μm voxel size, 55KVp, 0.36° rotation step (180° angular range) and a 400 ms exposure per view, which were performed in DPBS 1X. The Scanco µCT software (HP, DECwindows Motif 1.6) was used for 3D reconstruction and viewing of images. After 3D reconstruction, cubic VOIs (voxel of interest, width 1.5 mm, depth 1.5 mm, height 0.8 mm) at the IAA, MT, and EAA of each tunnel were segmented using a global threshold of 0.4 g/cc. Tissue mineral density (TMD) and directly measured bone volume/total volume fraction (BV/TV) were calculated for each ROI along the femoral and tibial bone tunnel. ROIs identical to the μPET/CT scans were analyzed. Finally, μCT scans were matched to the μPET/CT images.
After μCT, all specimens were fixed in 10% neutral buffered formalin for 3 days, decalcified in Immunocal (Decal Chemical Corporation, Tallman, NY, USA) for 5 days and washed in a phosphate buffered solution. Finally, they were dehydrated and embedded in paraffin. The tibia and femur were cut in 5 μm thick serial sections longitudinally along the tunnel so that the entire bone tunnel would be visible. Immunohistochemistry was used to localize osteoblasts on the tissue sections using anti-procollagen type I antibodies (Developmental Studies Hybridoma Bank, Iowa City, IA, USA). Re-hydrated serial sections were treated with 3% H2O2 to quench endogenous peroxidase activity. Non-specific antibody binding was blocked with serum-free protein block (Dako, Carpinteria, CA, USA). The sections were incubated with antibodies against rat type-I procollagen at room temperature overnight. Bound antibodies were visualized by employing a goat avidin–biotin peroxidase system with 3,3-diaminobenzidine (DAB; Dako) as a chromagen. Tartrate-resistant acid phosphatase (TRAP) staining (Acid Phosphatase, Leukocyte (TRAP) Kit, Sigma Aldrich, St. Louis, MO, USA) was used to visualize osteoclasts.
Microscope images were captured using a light microscope (Eclipse E800; Nikon, Melville, NY, USA) and a CCD camera (Diagnostic Instruments, Sterling Heights, MI, USA). Similar to the evaluation of the μPET/CT scans, histological sections were divided into three ROI: IAA, MT, and EAA. In each zone, the number of osteoblasts and osteoclasts at the tendon-bone junction were counted on the procollagen and TRAP-stained sections, respectively, by two blinded viewers (M.O.S, M.S.).
Statistical analyses
Results are presented as median and minimum (min) and maximum (max). Statistical analysis was performed using Graph Pad Prism 7.0 (GraphPad Software, Inc., San Diego, CA, USA) with a Friedmann non-parametric test and Dunn’s correction for multiple comparisons to compare SUV values in different tunnel regions (ROIs) with each other. The same test was used to compare total bone volume, newly formed bone volume, and mean osteoclast- and osteoblast values in the different tunnel regions. Spearman’s rho correlations were used to assess the correlation between μPET value at 28 days and bone μCT measurements. Statistical significance was set at p-value < .05.
Results
All animals tolerated the µCT/PET scan procedures without complications. The high-resolution μPET/CT imaging provided quantitative information on the localization and magnitude of bone turnover in both tibial and femoral bone tunnels. A representative set of μPET images are shown in Figure 3. The axial (Figure 3(a)), sagittal (Figure 3(b)) and coronal (Figure 3(c)) views of the femoral tunnel and its surrounding bone allowed for visualization and quantitative assessment. A 3D reconstructed μPET/CT scan image (Figure 3(d)) allowed for precise placement of ROI within the two tunnels. PET scan image showing axial (a) and sagittal (b) views of the femoral tunnel (arrow) and the surrounding bone at day 7. The bone tunnel (arrow) is cut in the coronal plane (c). Colors represent the amount of 18F-Fluoride uptake, (yellow = highest SUV). A 3D reconstructed PET/CT scan sample is shown (d).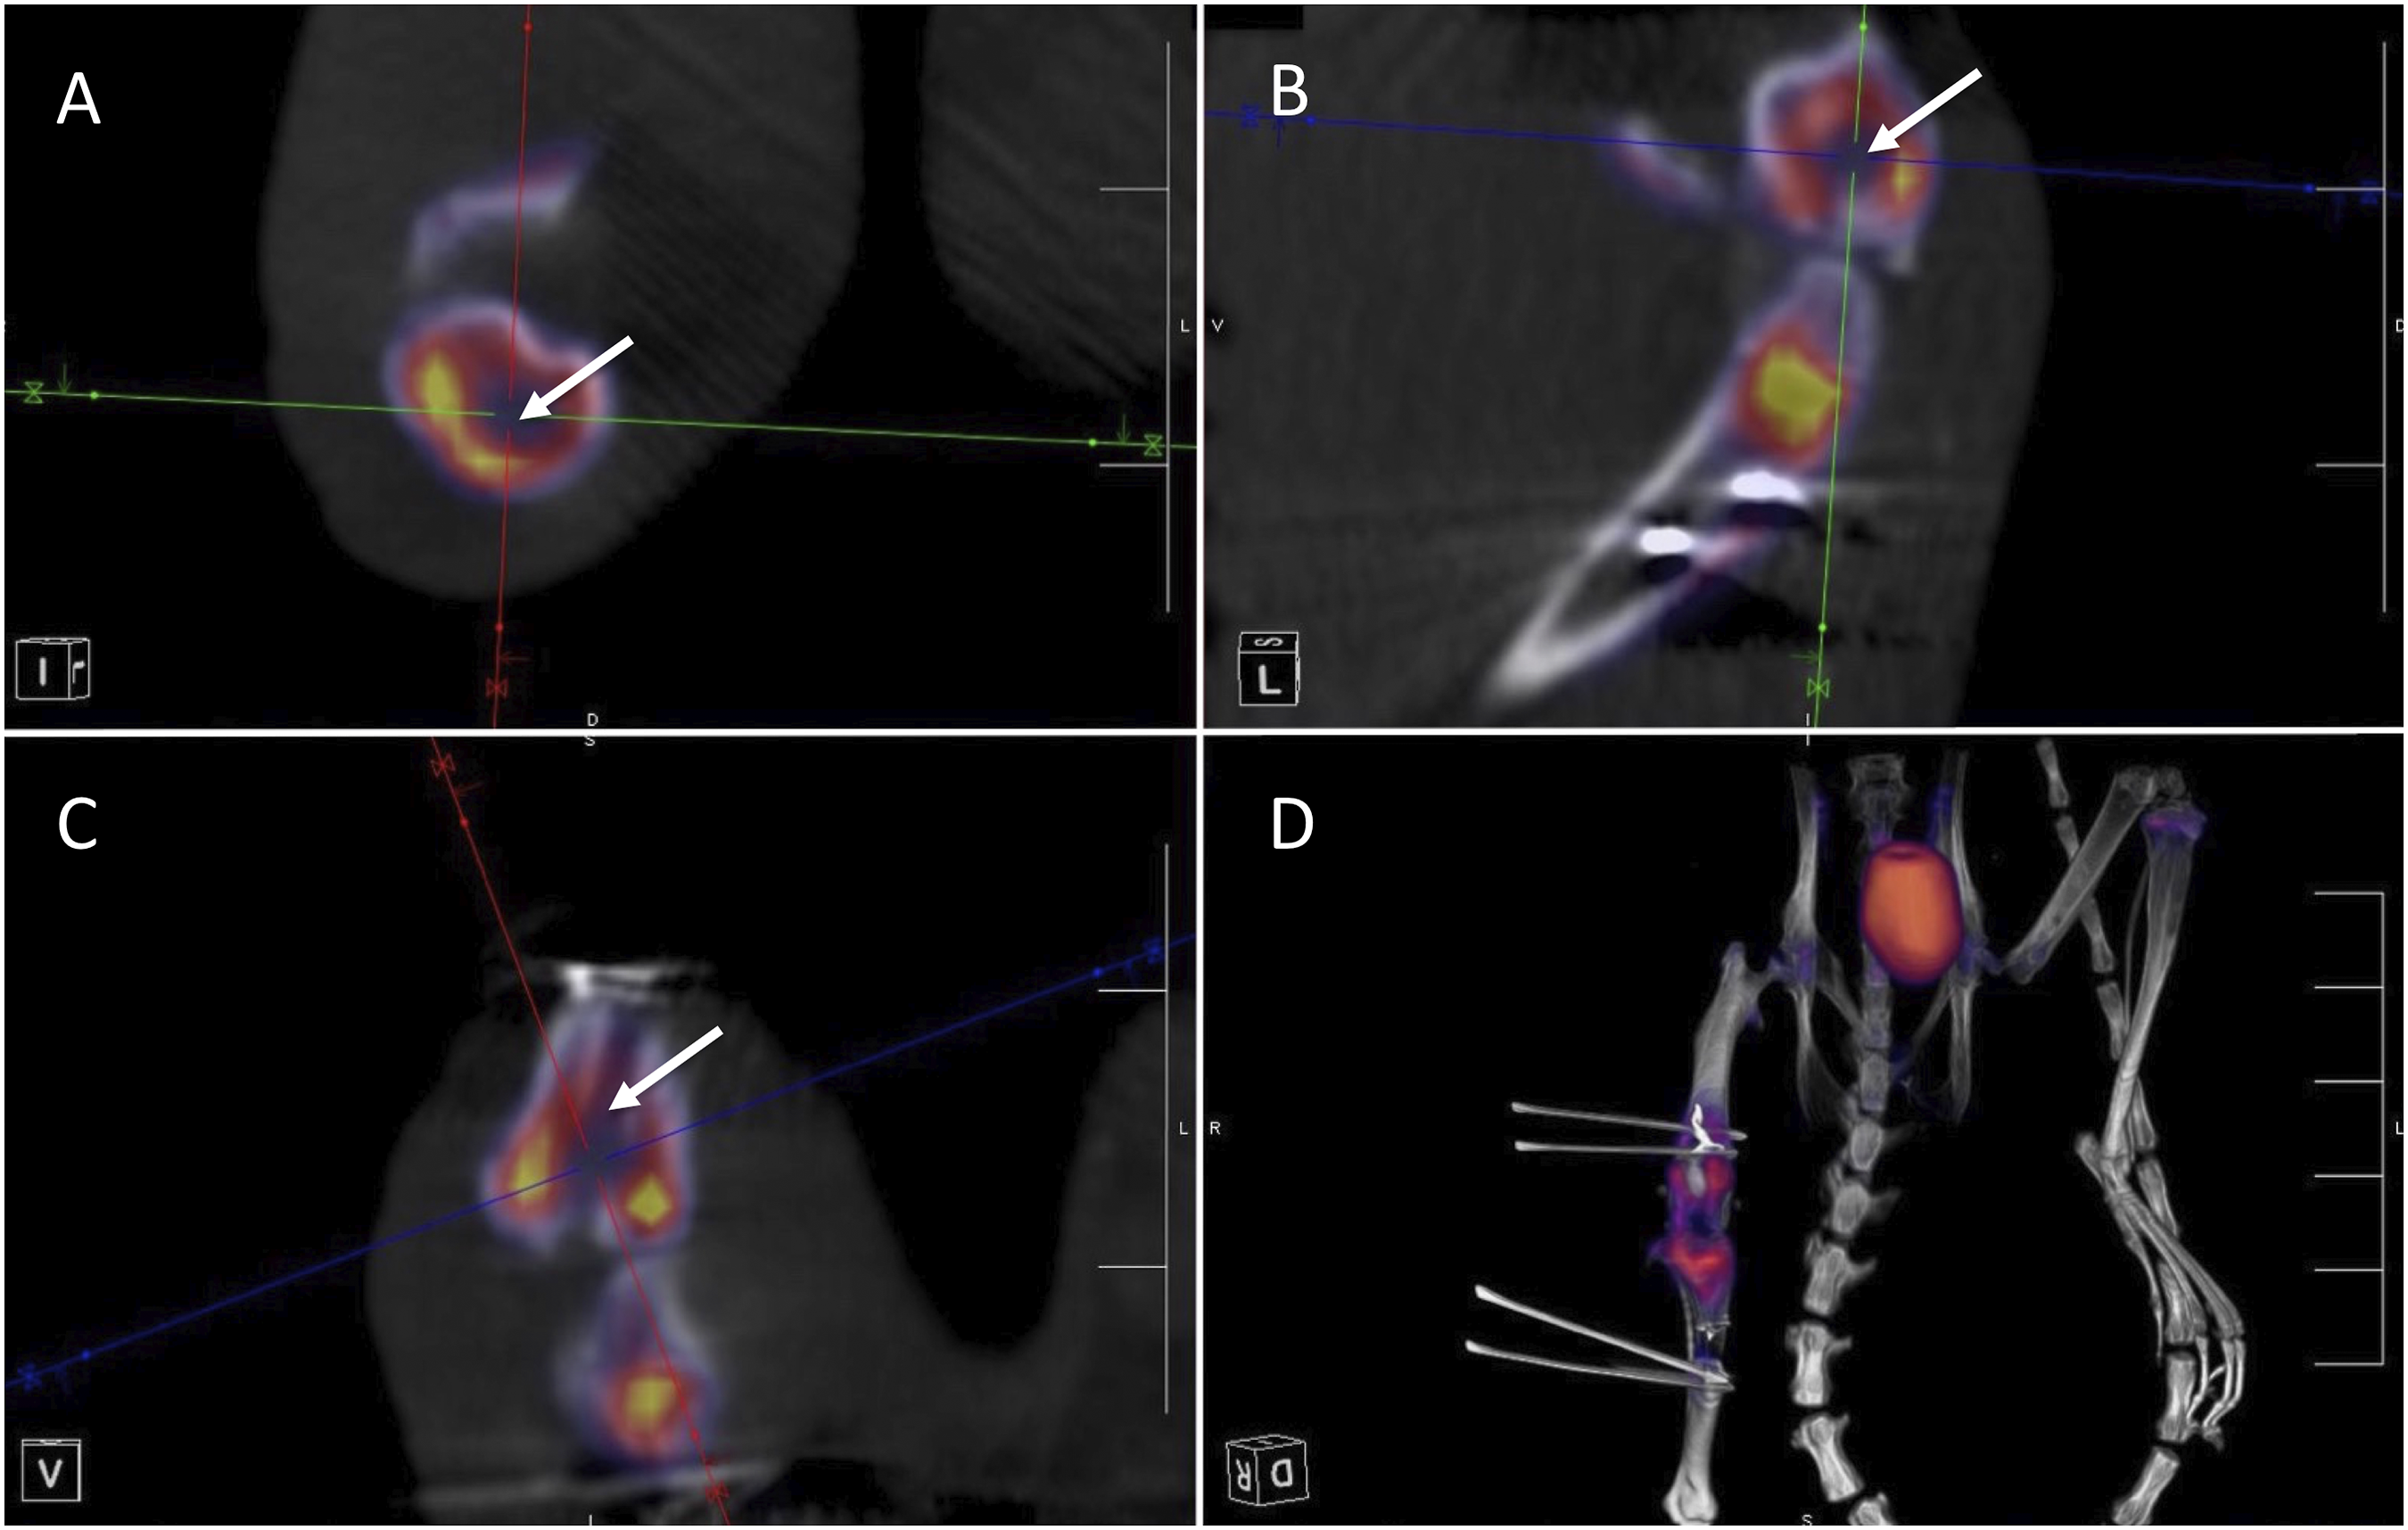
We did not find significant differences between the motion and no-motion group with respect to standard uptake values (SUV), μCT scan results, or histological evaluation. Thus, due to the small sample size we combined the two groups for all analyses.
Serial Micro PET Scans: Changes over time
Comparison of SUV values at different time points showed differences in 18F-Fluoride uptake, with the highest 18F-Fluoride uptake at 7 days post-ACL reconstruction, followed by a decrease on days 14, 21, and 28 (Figure 4). Analysis of ROI in femoral and tibial tunnels revealed significant differences in SUV in the femoral MT between 7 and 28 days (p = .02), the tibial MT between 7 and 28 days (p = .042), and the tibial EAA between 7 and 28 days (p = .042). These data suggest that the most bone turnover occurs at early time-points. 18F-fluoride SUV were obtained for each ROI: femoral extraarticular aperture (EAA), femoral mid-tunnel (MT), femoral intraarticular aperture (IAA), tibial IAA, tibial mid-tunnel, and tibial EAA at 7, 14, 21, and 28 days postoperative. N = 6 per group, *p < .05, **p < .01.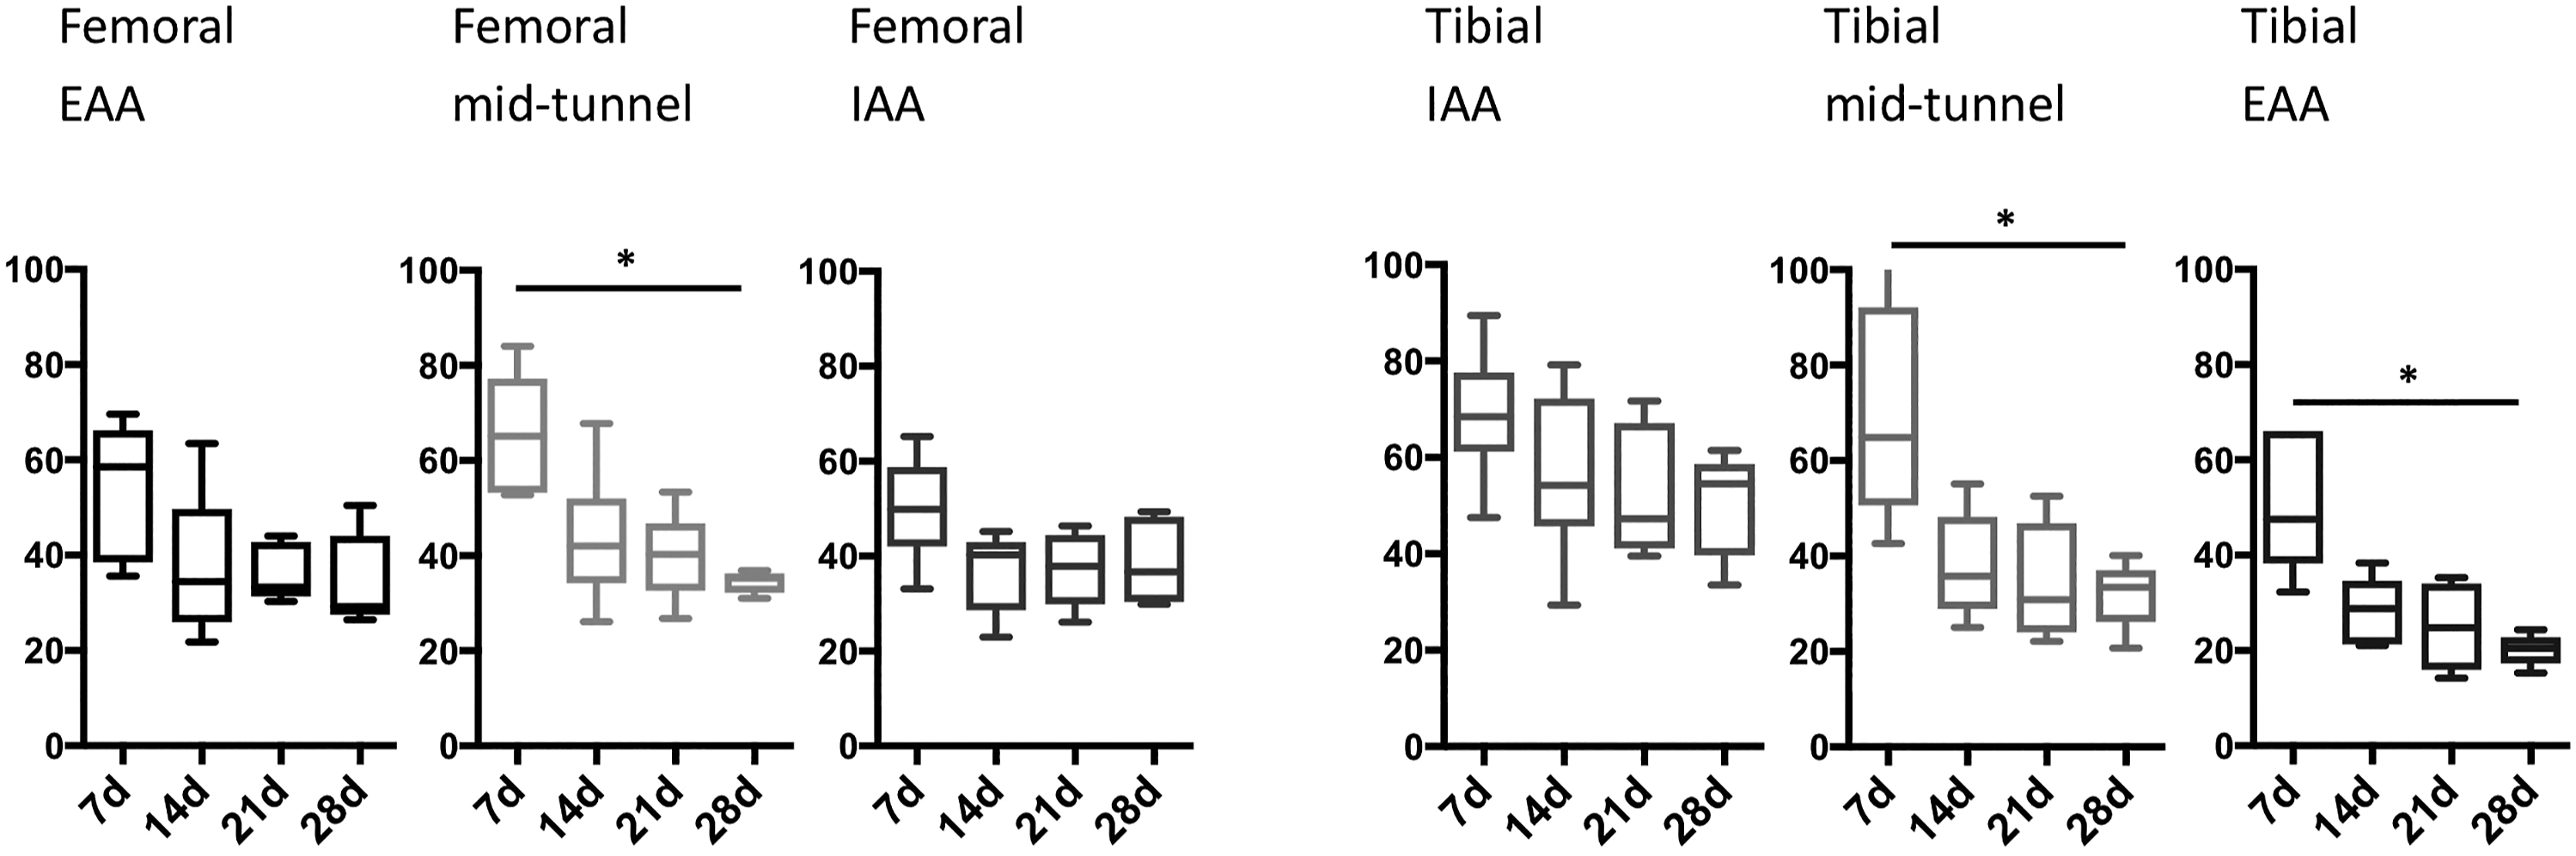
Micro PET Scans: Comparisons between different tunnel regions
Mean SUV of each tunnel region 7, 14, 21 and 28 days after ACL reconstruction.

The mean SUV of each tunnel region 7, 14, 21 and 28 days after ACL reconstruction are shown. EAA: extra-articular aperture; MT: mid-tunnel region; IAA: intraarticular aperture N = 6 per group.
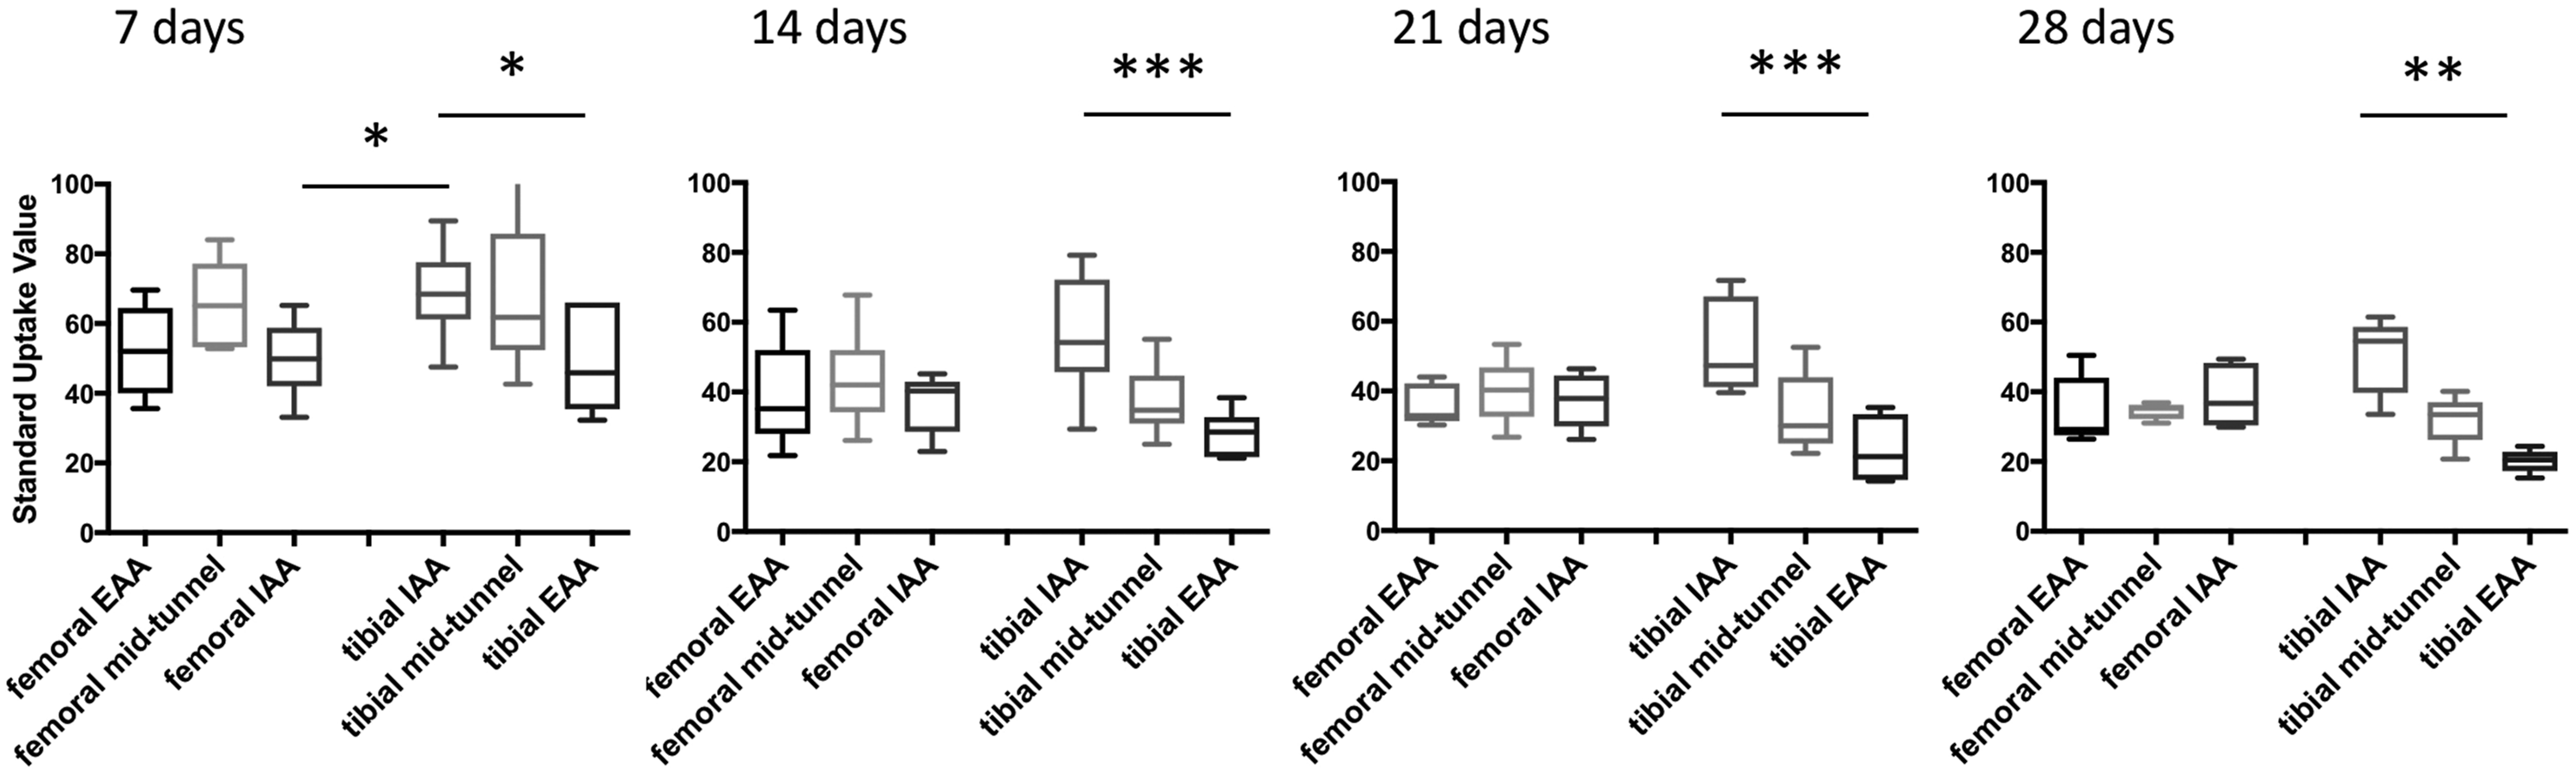
Comparison of SUV in the ROI over time. 18F-Fluoride SUV of the femoral and tibial IAA, MT, and EAA at 7, 14, 21, and 28 days postoperative. N = 6 per group, *p < .05, ** p < .01.
These data suggest differential bone turnover among different tunnel regions within the tibial and between the IAA of both bones but not between the different regions of the femoral tunnel.
Micro CT Scans: Bone characteristics
μCT scans showed significantly higher total bone volumetric density in the femoral EAA compared to the tibial MT (p = .01) and higher new bone volumetric density in the femoral EAA compared to the tibial EAA (p = .035) (Figure 6(a)). Assessment of bone turnover at 28 days. 18F-Fluoride SUV, amount of total bone volume, newly formed bone, (a), number of osteoclasts and osteoblasts along the graft tunnel in the different tunnel regions at 28 days postoperative (b) were measured. N = 6 per group, *p < .05, **p < .01.
Histology: Number of osteoblasts and osteoclasts
No significant differences were observed in the number of osteoblasts or osteoclasts between ROIs in either the femur or tibia at 28 days (Figure 6(b)). The highest numbers of osteoblasts was detected in the femoral MT, the lowest in the tibial EAA. We observed a gradient in osteoclast numbers in tibia, with most osteoclasts in the EAA and least in the IAA region.
Correlations
We observed a significant correlation between SUV (reflecting bone turnover) and new bone volumetric density (r = 0.449, p = .013). Total bone volumetric density correlated with new bone volumetric density (r = 0.796, p < .001). Additionally, we found a correlation between newly formed bone volumetric density and osteoblast numbers (r = 0.452, p < .016). In contrast, there was no correlation between bone turnover and osteoclast numbers.
Discussion
In this pilot study, we evaluated the feasibility of μPET/CT scanning as a non-invasive, sensitive imaging modality to follow metabolic processes during tendon-to-bone healing in vivo in a small animal model of ACL reconstruction. This is the first study to use serial, in vivo imaging in a small animal ACL reconstruction model. Our results indicate that the use of four repetitive μPET/CT scans over a period of 4 weeks is feasible for the evaluation of tendon-to-bone healing processes in a small animal model. Furthermore, collected μPET/CT data provided sensitive and reliable data for detecting changes in newly formed bone in vivo.
Our study showed a decrease of radiotracer uptake over time and thus demonstrates a decrease in bone turnover as healing progresses (Figure 4). This finding demonstrates the ability and sensitivity of 18F-Fluoride μPET to detect changes in new bone formation over a 4 week period in the ACL reconstruction animal model.
During the entire healing phases (days 7–28), we found a gradient of 18F-Fluoride uptake in the tibial tunnel, with significantly greater activity at the IAA compared to the EAA of the tunnel (Figure 5). This gradient in bone turnover may be due to different biological and biomechanical factors. With graft fixation at the EAA, relative graft-tunnel motion and resulting stress along the bone tunnel is likely to be greatest at the IAA. Furthermore, synovial fluid-derived cytokines are also likely to have greater effect at the IAA and may therefore affect bone turnover mostly in this area. However, it remains unclear why the femoral bone tunnel shows no uptake gradient and the femoral IAA shows much lower 18F-Fluoride uptake values compared to the tibial IAA. We speculate that this is due to differences in the local mechanical environment (i.e., relative graft-tunnel micro-motion) between the femoral and tibial tunnels. Further studies with a larger sample size will provide more insight into these findings.
The increased osteoblastic activity seen in μPET scan evaluation at the tibial IAA was matched by greater volumetric density of newly formed bone in the same region of the tibial tunnel (Figure 6). Later time points would be necessary to fully evaluate the relationship between μPET activity and new bone formation, as a temporal lag between osteoblastic activity and formation of new bone trabeculae is probable. Furthermore, we only correlated the μPET data with the high resolution μCT scans conducted at 28 days (after animal sacrifice) but not with the CT scans that were performed concomitantly with the μPET/CT scans at day 7, 14, and 21 due to the relatively low resolution of these in vivo scans. In a future study, in vivo μCT and the resulting higher resolution would allow a more detailed observation over time.
Correlation matrix.

In this correlation matrix, Spearman’s correlation between standard uptake value (PET) of 18F-Fluoride, total bone volumetric density, new bone volumetric density, osteoclast- and osteoblast numbers along the graft tunnel are shown. N = 6 per group.
aSpearmans correlation
b2-tailed, level of significance < 0.05.
cOsteoclast numbers along the graft tunnel
dOsteoblast numbers along the graft tunnel
The main limitation of this study is the small sample size of animals examined. 6 Although this number proved sufficient to establish the feasibility of serial μPET/CT scans to assess bone formation and healing processes in the animals at weekly intervals, our findings still need to be confirmed with a larger number of animals. Another limitation of our study is the analysis of bone volume, osteoblast- and osteoclast numbers only at the final time-point upon sacrificing the animals. Future studies should involve analysis at multiple time points. Finally, we only used one radiotracer (18F-Fluoride) to assess bone turnover. Further studies are necessary to evaluate other metabolic processes such as inflammation and osteoclastic activity using different radiotracers.
Conclusion
We have demonstrated the feasibility and sensitivity of repeated μPET/CT scans to assess osteoblast activity and new bone formation along the healing tendon-bone interface after ACL reconstruction in a small animal model. In contrast to histological and biomechanical ex vivo testing, where only one time point per animal can be assessed, in vivo “molecular imaging” using μPET/CT allows for continuous process monitoring within the same animal, as well as gaining insight into the healing process using fewer animals. This approach could be used to directly measure the effect of different strategies used to augment tendon-to-bone healing.
Footnotes
Acknowledgements
We thank Dorbila Nesic, PhD for reviewing the manuscript and making valuable corrections.
Author’s Note
This manuscript has not been published previously, it is not under consideration for publication elsewhere, the publication is approved by all authors and tacitly or explicitly by the responsible authorities where the work was carried out, and that, if accepted, it will not be published elsewhere in the same form, in English or in any other language, including electronically without the written consent of the copyright-holder.
Author contributions
Michael O Schär study design, animal surgery, PET scans, data analysis, manuscript preparation, revision.
Richard Ma study initiation, animal surgery, specimen harvest, data analysis, manuscript review.
Matthew Morgan PET scans, data analysis.
Tina Chen analysis of PET data.
Douglas J Ballon analysis of PET data.
Jonathan P Dyke study design, manuscript preparation, revision.
Xiang-Hua Deng study design, animal surgery, biomechanical testing, data analysis.
Scott A Rodeo study initiation and design, animal surgery, data analysis, manuscript preparation, revision
Declaration of conflicting interests
The author(s) declared the following potential conflicts of interest with respect to the research, authorship, and/or publication of this article: Each author certifies that he or she has no commercial associations (e.g., consultancies, stock ownership, equity interest, and patent/licensing arrangements) that might pose a conflict of interest in connection with the submitted article.
Funding
The author(s) disclosed receipt of the following financial support for the research, authorship, and/or publication of this article: Funding was provided by the Tisch Foundation and the Institute for Sports Medicine Research at Hospital for Special Surgery. The funding entities had no involvement in study design, data collection, interpretation of data, writing the report, nor decision to submit the article for publication.
Ethics approval
This study was approved by the Institutional Animal Care and Use Committee of our institution (IACUC protocol # 05-12-03R) and has been performed in accordance with the ethical standards of the 1964 Helsinki Declaration.