
Abstract
Purpose
We performed a bioinformatics analysis to identify the key genes that were differentially expressed between degenerative intervertebral disc (IVD) cells with and without exposure to interleukin-1β and explore the related signaling pathways and interaction networks.
Methods
The microarray data were downloaded from the Gene Expression Omnibus (27,494). Then, analyses of the gene ontology, signaling pathways, and interaction networks for the differentially expressed genes (DEGs) were conducted using tools including the Database for Annotation, Visualization, and Integrated Discovery, Metascape, Gene Set Enrichment Analysis, Search Tool for the Retrieval of Interacting Genes, Cytoscape, Venn method, and packages of the R computing language.
Results
A total of 260 DEGs were identified, including 161 upregulated and 99 downregulated genes. Gene Ontology annotation analysis showed that these DEGs were mainly associated with the extracellular region, chemotaxis, taxis, cytokine activity, and cytokine receptor binding. A Kyoto Encyclopedia of Genes and Genomes signaling pathway analysis showed that these DEGs were mainly involved in the of cytokine-cytokine receptor interaction, rheumatoid arthritis, tumor necrosis factor signaling pathway, Salmonella infection, and chemokine signaling pathway. The interaction network analysis indicated that 10 hub genes, including CXCL8, CXCL1, CCL20, CXCL2, CXCL5, CXCL3, CXCL6, C3, PF4, and GPER1 may play key roles in IVD degeneration.
Conclusions
Bioinformatic analysis showed that CXCL8 and other nine key genes may play a role in the development of disc degeneration induced by inflammatory reactions and can be used to identify potential target genes for therapeutic applications in IVD degeneration.
Keywords
Introduction
Intervertebral disc degeneration (IVDD) is considered to be the leading cause of low back pain, severely threatening the quality of life of middle-aged and elderly people and increasing the economic burden on families and the society.1,2 Although modern evidence-based medicine has identified IVDD as a consequence of a variety of genetic, traumatic, lifestyle, aging, and nutritional factors, the pathological mechanisms involved in IVDD progression remain unknown.3–7 Currently, treatment modalities include noninvasive treatments, such as drug therapy, multiple physical modalities, and multidisciplinary biopsychosocial rehabilitation; interventional modalities, such as intradiscal therapies and epidural injections; regenerative modalities with disc injections of various solutions; and surgical approaches, such as fusion and artificial disc replacement. Despite the progress made in therapies aimed at relieving the pain symptoms, they offer only temporary benefits and are related to complications. 8 Therefore, it is necessary to elucidate the underlying pathogenesis of IVDD and lower back pain to develop novel effective treatment methods for these conditions.
The role of bioinformatics in the exploration of disease mechanisms has become essential given the multifactorial nature of many common health conditions. Examples include the identification of hub genes associated with the etiology of intervertebral disc (IVD).9–12 Inflammatory cytokines play a significant role in disc degeneration. 13 As disc degeneration progresses, the expression of pro-inflammatory cytokines, such as interleukin (IL)-1β and tumor necrosis factor alpha (TNF-α) in the nucleus pulposus (NP) tissue increases significantly, which could accelerate disc cell degeneration by promoting the release of matrix metalloproteinases (MMPs) and inflammatory cytokines.13–16 However, Le et al. believed that IL-1 may play a more significant role than TNF-α. 16 Furthermore, IL-1β has been shown to elevate both neurotrophin gene expression levels and the production of nerve growth factor, which is associated with low back pain. 17 Thereafter, inflammatory processes exacerbated by IL-1β are believed to be key mediators of disc degeneration and low back pain, and IL-1β may be a better target for therapeutic intervention of IVDD.
In this study, microarray data profiling of human disc tissue samples from patients with herniated discs and degenerative disc disease, including four samples stimulated with 102 pM IL-1β and four controls performed by Gruber et al. (GSE27494) were downloaded and reanalyzed. Differentially expressed genes (DEGs) were identified and co-expression network analysis was performed, followed by functional analysis of the genes in the network. Differentially expressed genes were subsequently subjected to functional and pathway annotations, construction of protein-protein interaction (PPI) networks, and module analysis to investigate the critical DEGs in the progression of IVDD. The present study aimed to identify the molecular markers indicating the induction of disc degeneration by inflammatory cytokines, which may guide further investigations and contribute to the development of novel therapeutic strategies for the treatment of IVDD.
Materials and methods
Collection of microarray data
The gene profile GSE27494, which was downloaded from the Gene Expression Omnibus (GEO) database (https://www.ncbi.nlm.nih.gov/geo/), was produced using the [U133_X3P] Affymetrix Human X3P Array (Platform GPL1352). The gene profile consisted of four degenerated disc tissue samples and four degenerative disc tissues subjected to additional IL-1β exposure. Disc tissue samples were obtained from surgical disc procedures performed on patients with herniated discs and degenerative disc disease. Cultured annulus fibrosus (AF) cells were grown in a three-dimensional collagen construct with or without 102 pM IL-1 for 14 days. Following homogenization in TRIzol reagent, total RNA was isolated and analyzed using microarrays.
Identification of DEGs
The limma R package has emerged as one of the most widely used statistical tests to identify DEGs. 18 The package was obtained from an open website (http://www.bioconductor.org/packages/release/bioc/html/limma.html). We screened DEGs between IL-1β-exposed and control disc cells by utilizing the limma package with an adjusted p-value < 0.05 and a log (fold change) > 2 or log (fold change) < −2 as the cut-off criteria. Furthermore, volcano plots and heat maps were generated using the R software.
Functional annotation of DEGs using the database for annotation, visualization, and integrated discovery, and Metascape analysis
We used Database for Annotation, Visualization, and Integrated discovery (DAVID) (https://david.ncifcrf.gov/home.jsp) (version 6.8) 19 for Gene Ontology (GO) functional analysis 20 and Kyoto Encyclopedia of Genes and Genomes (KEGG) pathway analysis of DEGs. 21 The enriched GO terms and pathways with a p-value < 0.05 were identified. Moreover, GO and KEGG pathway analyses were performed using Metascape (http://metascape.org/gp/index.html#/main/step1). 22 Terms with a p-value < 0.01, a minimum count of 3, and an enrichment factor >1.5 (enrichment factor is the ratio between the observed count and the count expected by chance) were collected and grouped into clusters based on their membership similarities.
Enrichment analysis of GO and KEGG using gene set enrichment analysis
Gene set enrichment analysis primarily analyzes microarray data using genomic and genetic sequencing to detect significant biological differences in microarray datasets. 23 In the present study, we performed GSEA analysis on the gene sequences of IL-1β-exposed and control disc cells using c5.all.v7.1.symbols.gmt, and c2.cp.kegg.v7.1.symbols.gmt, respectively, as reference gene sets (software.broadinstitute.org/gsea/). 24 Gene set permutations were analyzed 1000 times. In addition, the normalized enrichment score, normalized p-value, and false discovery rate q values were used to filter the correlative GO terms and pathways.
Construction of the PPI network, significant module, and hub gene network
First, we used Metascape (http://metascape.org/gp/index.html#/main/step1) 22 to construct the PPI network and screen the significant module. Second, to assess the functional associations among the target genes of upregulated and downregulated DEGs, we uploaded the target gene data to the Search Tool for the Retrieval of Interacting Genes (STRING, http://string.embl.de/) to construct the PPI network. Interactions with a combined score >0.7 were considered significant. Highly interconnected (hub) genes in the PPI network were analyzed using Cytoscape (version 3.6.0). The Molecular Complex Detection tool (MCODE) (version 1.5.1), 25 a plug-in of Cytoscape, was used to screen and identify the most significant module in the PPI network. Genes with the top 10 highest degrees in the PPI network were identified as the hub genes.
Identification of significant genes
We generated a Venn diagram to identify the significant common genes among “Metascape_MCODE,” “Cytoscape_MCODE,” and “Cytoscape_cytoHubba” using Fun Rich software (http://www.funrich.org). 25 Summaries of the functions of the significant genes were obtained via DAVID (https://david.ncifcrf.gov/home.jsp). The R language was used to perform the clustering analysis of significant genes based on the gene expression levels.
Results
Screening of DEGs
After the analysis of the datasets (GSE27494) using the limma package, the DEGs between IL-1β-exposed and control disc cells were presented in a volcano plot (Figure 1). After setting the threshold value, a total of 260 DEGs were reserved, including 161 upregulated DEGs (Table 1) and 99 downregulated DEGs (Table 2). The cluster heatmap of the DEGs is shown in Figure 2. Volcano plot presenting the DEGs between IL-1β-exposed and control disc cells. The downregulated DEGs are marked in green, and the upregulated DEGs are marked in red. DEG: differentially expressed genes. The genes that were upregulated by a fold change > 2 and with a p < 0.05 (top 20). FC: fold change; MMP: matrix metalloproteinases. The genes that were downregulated by a fold change < −2 and with a p < 0.05 (top 20). FC, fold change. Heatmap of DEGs between IL-1β-exposed and control disc cells. Each column represents a DEG and each row represents a single sample. Red color indicates an upregulation and the green color indicates a down-regulation. DEG: differentially expressed genes.


The enrichment results of GO and KEGG via DAVID and Metascape
The GO functional annotation analysis of the DEGs showed that (1) the biological processes were mainly involved in the regulation of chemotaxis, taxis, and the response to molecules of bacterial origin; (2) the molecular functions of the altered genes were mainly related to cytokine activity, cytokine receptor binding, and chemokine receptor binding; and (3) the cell components involved were mainly in the extracellular region and extracellular matrix (Figure 3(a)–(c)). In the KEGG signaling pathway analysis, the 260 DEGs were found to be mainly involved in cytokine-cytokine receptor interaction, rheumatoid arthritis, TNF signaling pathway, Salmonella infection, chemokine signaling pathway, and other signal transduction pathways (Figure 3(d)). Bubble diagram of GO analysis and KEGG pathway analysis using DAVID. Detailed information relating to changes in the (a) biological process, (b) molecular function, (c) cellular components, and (d) KEGG analysis for hub genes. KEGG: Kyoto Encyclopedia of Genes and Genomes; DAVID: Database for Annotation, Visualization and Integrated discovery; GO: Gene Ontology.
Furthermore, the functional enrichment analysis performed using Metascape showed that the DEGs were significantly enriched in NABA MATRISOME ASSOCIATED, extracellular matrix organization, NABA CORE MATRISOME, positive regulation of cell motility, and regulation of cell adhesion (Figure 4(a)–(c)). Enrichment analysis of differentially expressed genes using Metascape. (a) Heatmap of enriched terms across input differentially expressed gene lists, colored by p-values, obtained using Metascape. (b) Network of enriched terms colored by cluster identity, in which the nodes that share the same cluster identity are typically close to each other. (c) Network of enriched terms colored by p-value, in which the terms containing more genes tend to have a more significant p-value.
Gene Ontology and KEGG pathway enrichment analysis of DEGs using GSEA
Functional enrichment analysis of DEGs in IL-1β-exposed disc cells using GSEA.

ES: Enrichment Score; NES: Normalized Enrichment Score; DEG: differentially expressed genes; GSEA: Gene Set Enrichment Analysis.

Six significant enrichment plots of functional enrichment analysis of DEGs between IL-1β-exposed and control samples in GSE27494 using GSEA. (a) Enrichment plot: GO_REGULATION_OF_INOSITOL_PHOSPHATE_BIOSYNTHETIC_PROCESS. Profile of the Running ES Score & Positions of Gene Set Members on the Rank Ordered List. (b) Enrichment plot: GO_IMMUNOGLOBULIN_RECEPTOR_BINDING. Profile of the Running ES Score & Positions of Gene Set Members on the Rank Ordered List. (c) Enrichment plot: GO_WATER_TRANSPORT. Profile of the Running ES Score & Positions of Gene Set Members on the Rank Ordered List. (d) Enrichment plot: GO_NEUTROPHIL_MIGRATION. Profile of the Running ES Score & Positions of Gene Set Members on the Rank Ordered List. (e) Enrichment plot: GO_ANTIMICROBIAL_HUMORAL_IMMUNE_RESPONSE_MEDIATED_BY_ANTIMICROBIAL_PEPTIDE. Profile of the Running ES Score & Positions of Gene Set Members on the Rank Ordered List. (f) Enrichment plot: GO_GRANULOCYTE_MIGRATION. Profile of the Running ES Score & Positions of Gene Set Members on the Rank Ordered List. DEG: differentially expressed genes; GSEA: Gene Set Enrichment Analysis.
Pathway enrichment analysis of DEGs using GSEA.

ES: Enrichment Score; NES: Normalized Enrichment Score; DEG: differentially expressed genes; GSEA: Gene Set Enrichment Analysis.

Six significant enrichment plots of pathway enrichment analysis of DEGs between IL-1β-exposed and control samples in GSE27494 using GSEA. (a) Enrichment plot: KEGG_THYROID_CANCER. Profile of the Running ES Score & Positions of Gene Set Members on the Rank Ordered List. (b) Enrichment plot: KEGG_DILATED_CARDIOMYOPATHY. Profile of the Running ES Score & Positions of Gene Set Members on the Rank Ordered List. (c) Enrichment plot: KEGG_CYTOKINE_CYTOKINE_RECEPTOR_INTERACTION. Profile of the Running ES Score & Positions of Gene Set Members on the Rank Ordered List. (d) Enrichment plot: KEGG_BASE_EXCISION_REPAIR. Profile of the Running ES Score & Positions of Gene Set Members on the Rank Ordered List. (e) Enrichment plot: KEGG_CHEMOKINE_SIGNALING_PATHWAY. Profile of the Running ES Score & Positions of Gene Set Members on the Rank Ordered List. (f) Enrichment plot: KEGG_GRAFT_VERSUS_HOST_DISEASE. Profile of the Running ES Score & Positions of GeneSet Members on the Rank Ordered List. DEG: differentially expressed genes; GSEA: Gene Set Enrichment Analysis.
Protein-protein interaction construction and module analysis
Using Metascape analysis, a PPI network of DEGs was constructed (Figure 7(a)). Six MCODE modules were identified in the PPI network. MCODE 1 consisted of 12 genes, including CXCL2, CCL20, SAA1, G protein-coupled estrogen receptor 1 (GPER1), CXCL8, CXCL1, C3, ACKR3, PF4, CXCL5, CXCL3, and CXCL6 (Figure 7(b)). Molecular Complex Detection tool 2 consisted of five genes, including ACTC1, GCH1, TUBB3, ACTG2, and SOD2 (Figure 7(c)). Molecular Complex Detection tool 3 consisted of three genes, TF, TFRC, and AMPH (Figure 7(d)). Molecular Complex Detection tool 4 consisted of three genes: Lyn, IL6, and IL1B (Figure 7(e)). Molecular Complex Detection tool 5 consisted of three genes: MMP3, CCL7, and CCL2 (Figure 7(f)). Lastly, MCODE 6 consisted of three genes: CCKAR, GNA14, and P2RY6 (Figure 7(g)). PPI network and significant module constructed using Metascape. (a) Through Metascape analysis, a protein-protein interaction network of DEGs was constructed. (b) MCODE 1 consists of 12 genes: CXCL2, CCL20, SAA1, GPER1, CXCL8, CXCL1, C3, ACKR3, PF4, CXCL5, CXCL3, and CXCL6. (c) MCODE 2 consists of 5 genes: ACTC1, GCH1, TUBB3, ACTG2, and SOD2. (d) MCODE 3 consists of 3 genes: TF, TFRC, and AMPH. (e) MCODE 4 consists of 3 genes: LYN, IL6, and IL1B. (f) MCODE 5 consists of 3 genes: MMP3, CCL7, and CCL2. (g) MCODE 6 consists of 3 genes: CCKAR, GNA14, and P2RY6. PPI: protein-protein interaction; DEG: differentially expressed genes.
Furthermore, the PPI network of the DEGs was also generated using the STRING online tool, and 327 edges and 251 nodes were observed (PPI enrichment p-value < 0.05) (Figure 8(a)). Six MCODE modules were also identified from the PPI network using the MCODE (version 1.5.1), one plug-in of Cytoscape (Figure 8(b)–(g)). Using Cytoscape, a total of 10 genes were identified as hub genes: CXCL8, CXCL1, CCL20, CXCL2, CXCL5, CXCL3, CXCL6, C3, PF4, and GPER1 (Figure 8(h)). PPI network, significant module, and hub gene network constructed using STRING and Cytoscape. (a) There were 327 edges and 251 nodes in the PPI network. All nodes with a combined score >0.7 are shown. Disconnected nodes in the network were excluded. (b) The first module consists of 95 edges and 17 nodes. (c) The second module consists of 15 edges and 6 nodes. (d) The third module consists of 10 edges and 5 nodes. (e) The fourth module consists of 3 edges and 3 nodes. (f) The fifth module consists of 3 edges and 3 nodes. (g) The sixth module consists of 3 edges and 3 nodes. (h) A total of 10 genes were identified as hub genes using Cytoscape: CXCL8, CXCL1, CCL20, CXCL2, CXCL5, CXCL3, CXCL6, C3, PF4, and GPER1. PPI: protein-protein interaction; GPER1: G protein-coupled estrogen receptor 1; STRING: Search Tool for the Retrieval of Interacting Genes.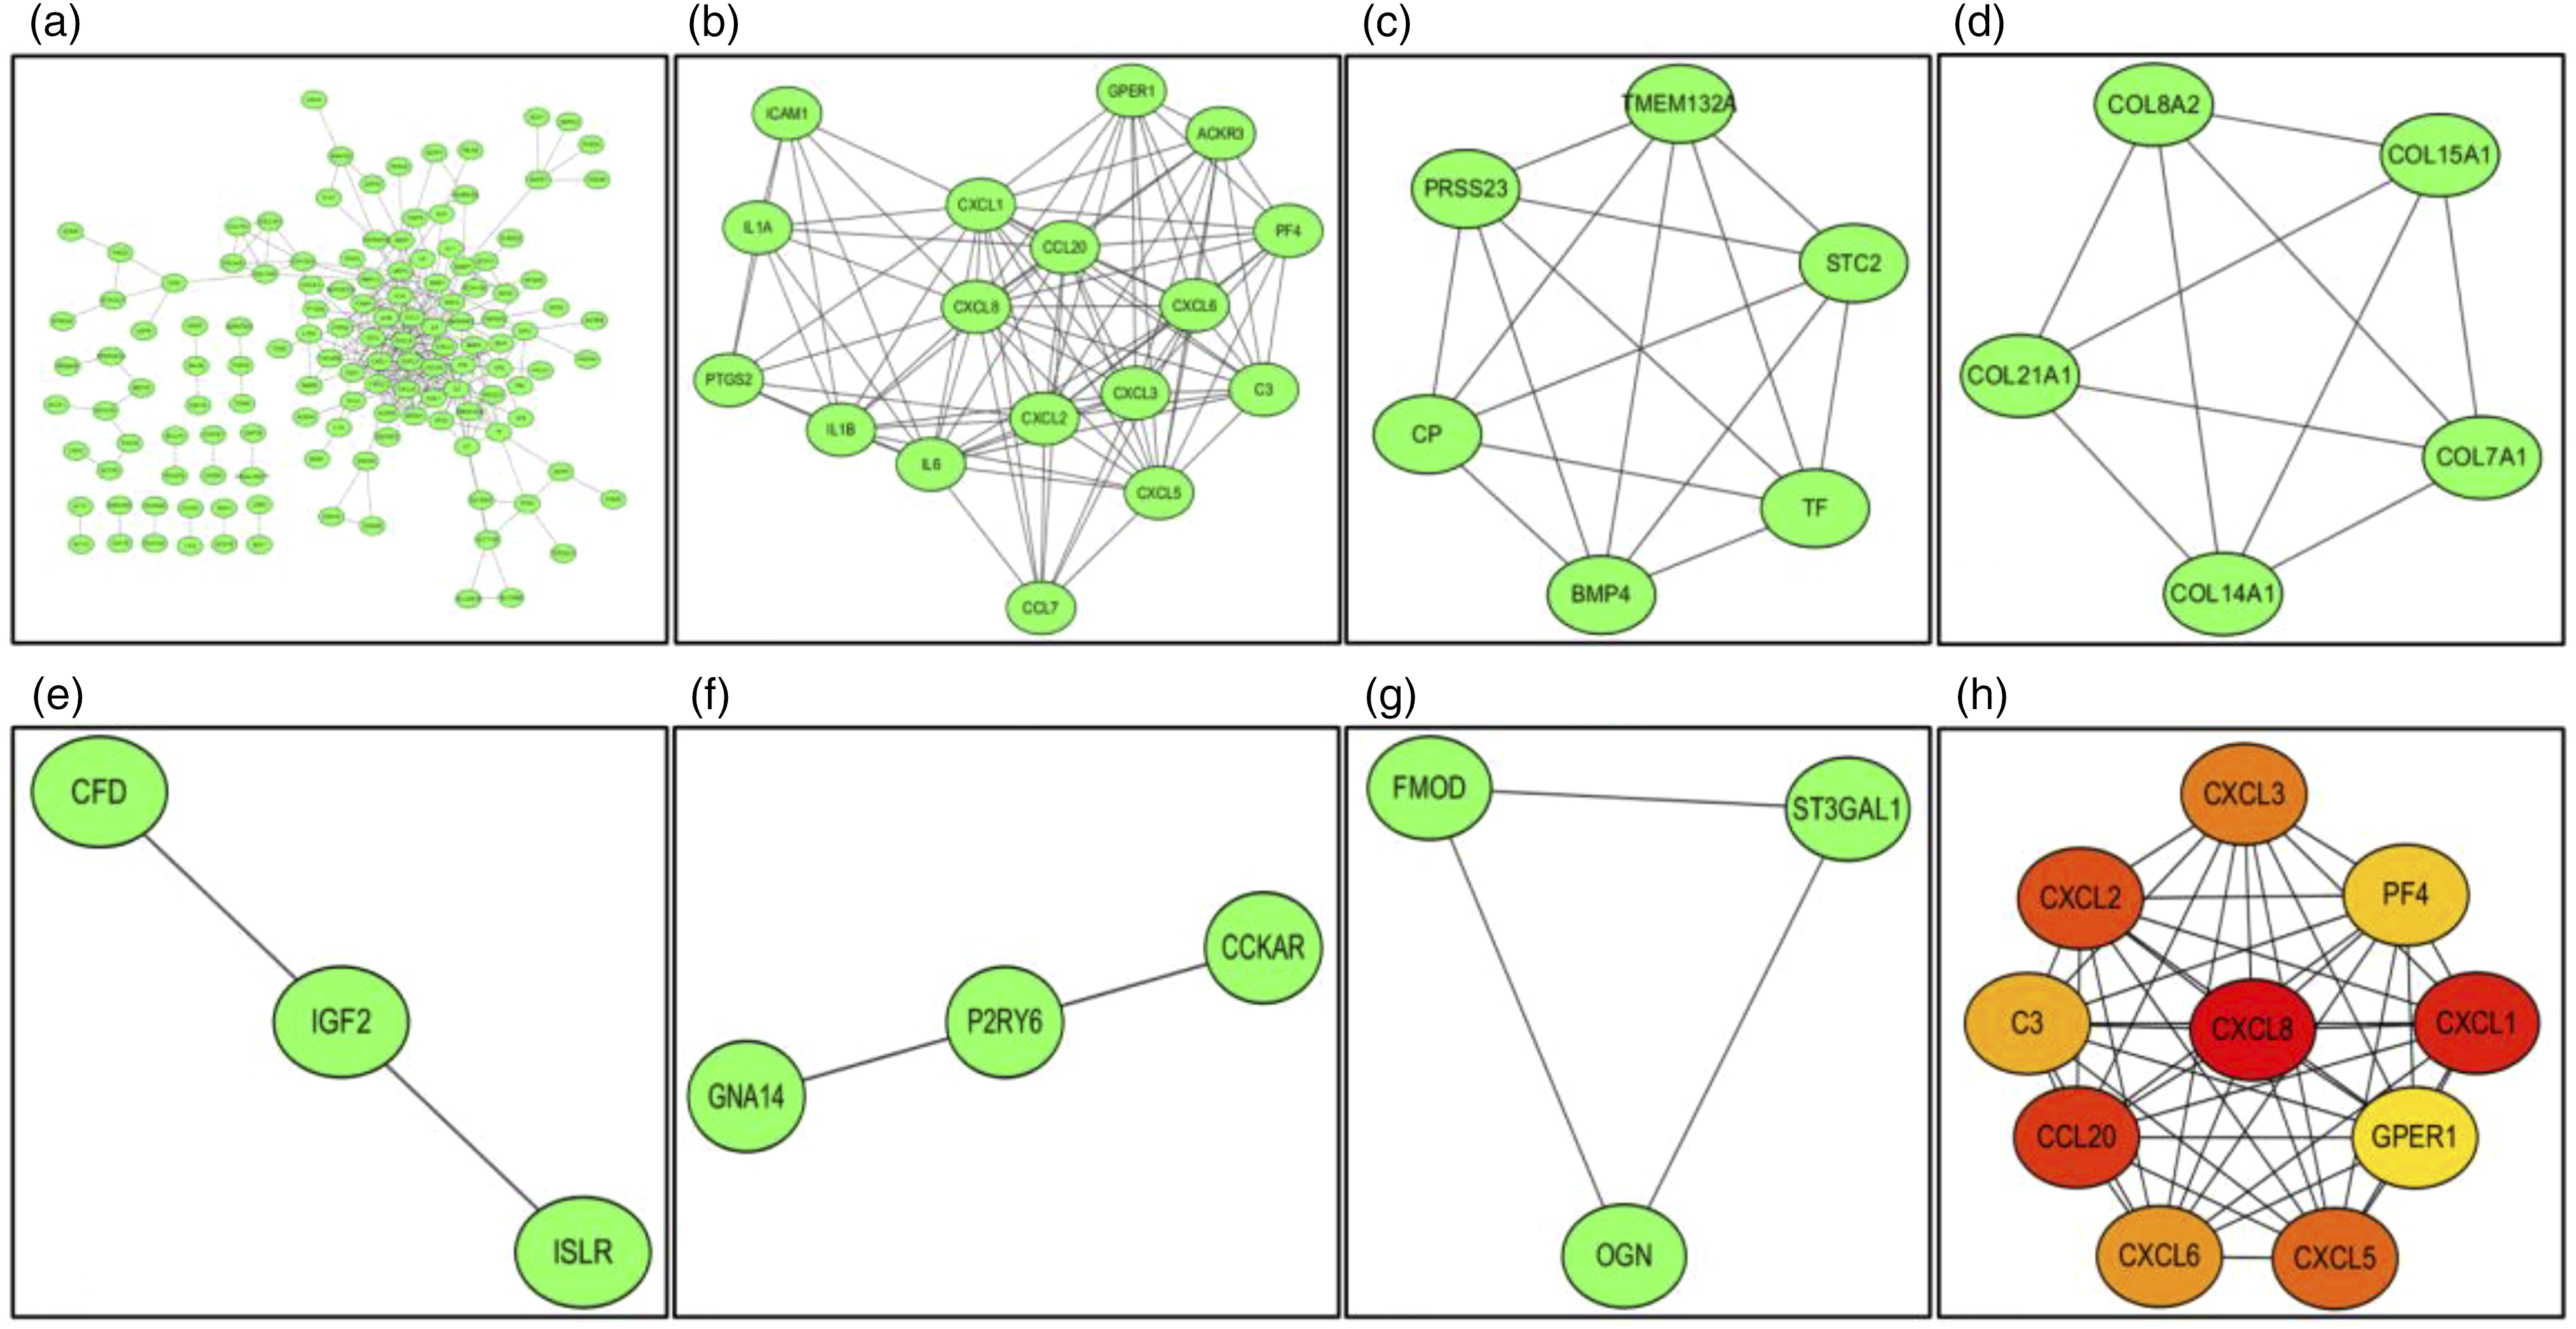
Identification and analysis of significant genes
The VENN diagram showed that there were 10 significant common genes among “Metascape_MCODE,” “Cytoscape_MCODE,” and “Cytoscape_cytoHubba,” including: CXCL8, CXCL1, CCL20, CXCL2, CXCL5, CXCL3, CXCL6, C3, PF4, and GPER1 (Figure 9(a)). Hierarchical clustering showed that the significant genes could be used to significantly distinguish IL-1β-exposed disc cells from control cells. Compared with the control cells, the expression of GPER1 was downregulated, and the expression of CXCL8, CXCL1, CCL20, CXCL2, CXCL5, CXCL3, CXCL6, C3, and PF4 were upregulated in IL-1β-exposed discs (Figure 9(b)). Identification and analysis of significant genes. (a) The VENN diagram shows that there were 10 significant common genes among “Metascape_MCODE,” “Cytoscape_MCODE,” and “Cytoscape_cytoHubba,”: CXCL8, CXCL1, CCL20, CXCL2, CXCL5, CXCL3, CXCL6, C3, PF4, and G protein-coupled estrogen receptor 1. (b) Hierarchical clustering showed that the significant genes could basically differentiate the IL-1β-exposed disc cells from the control disc cells.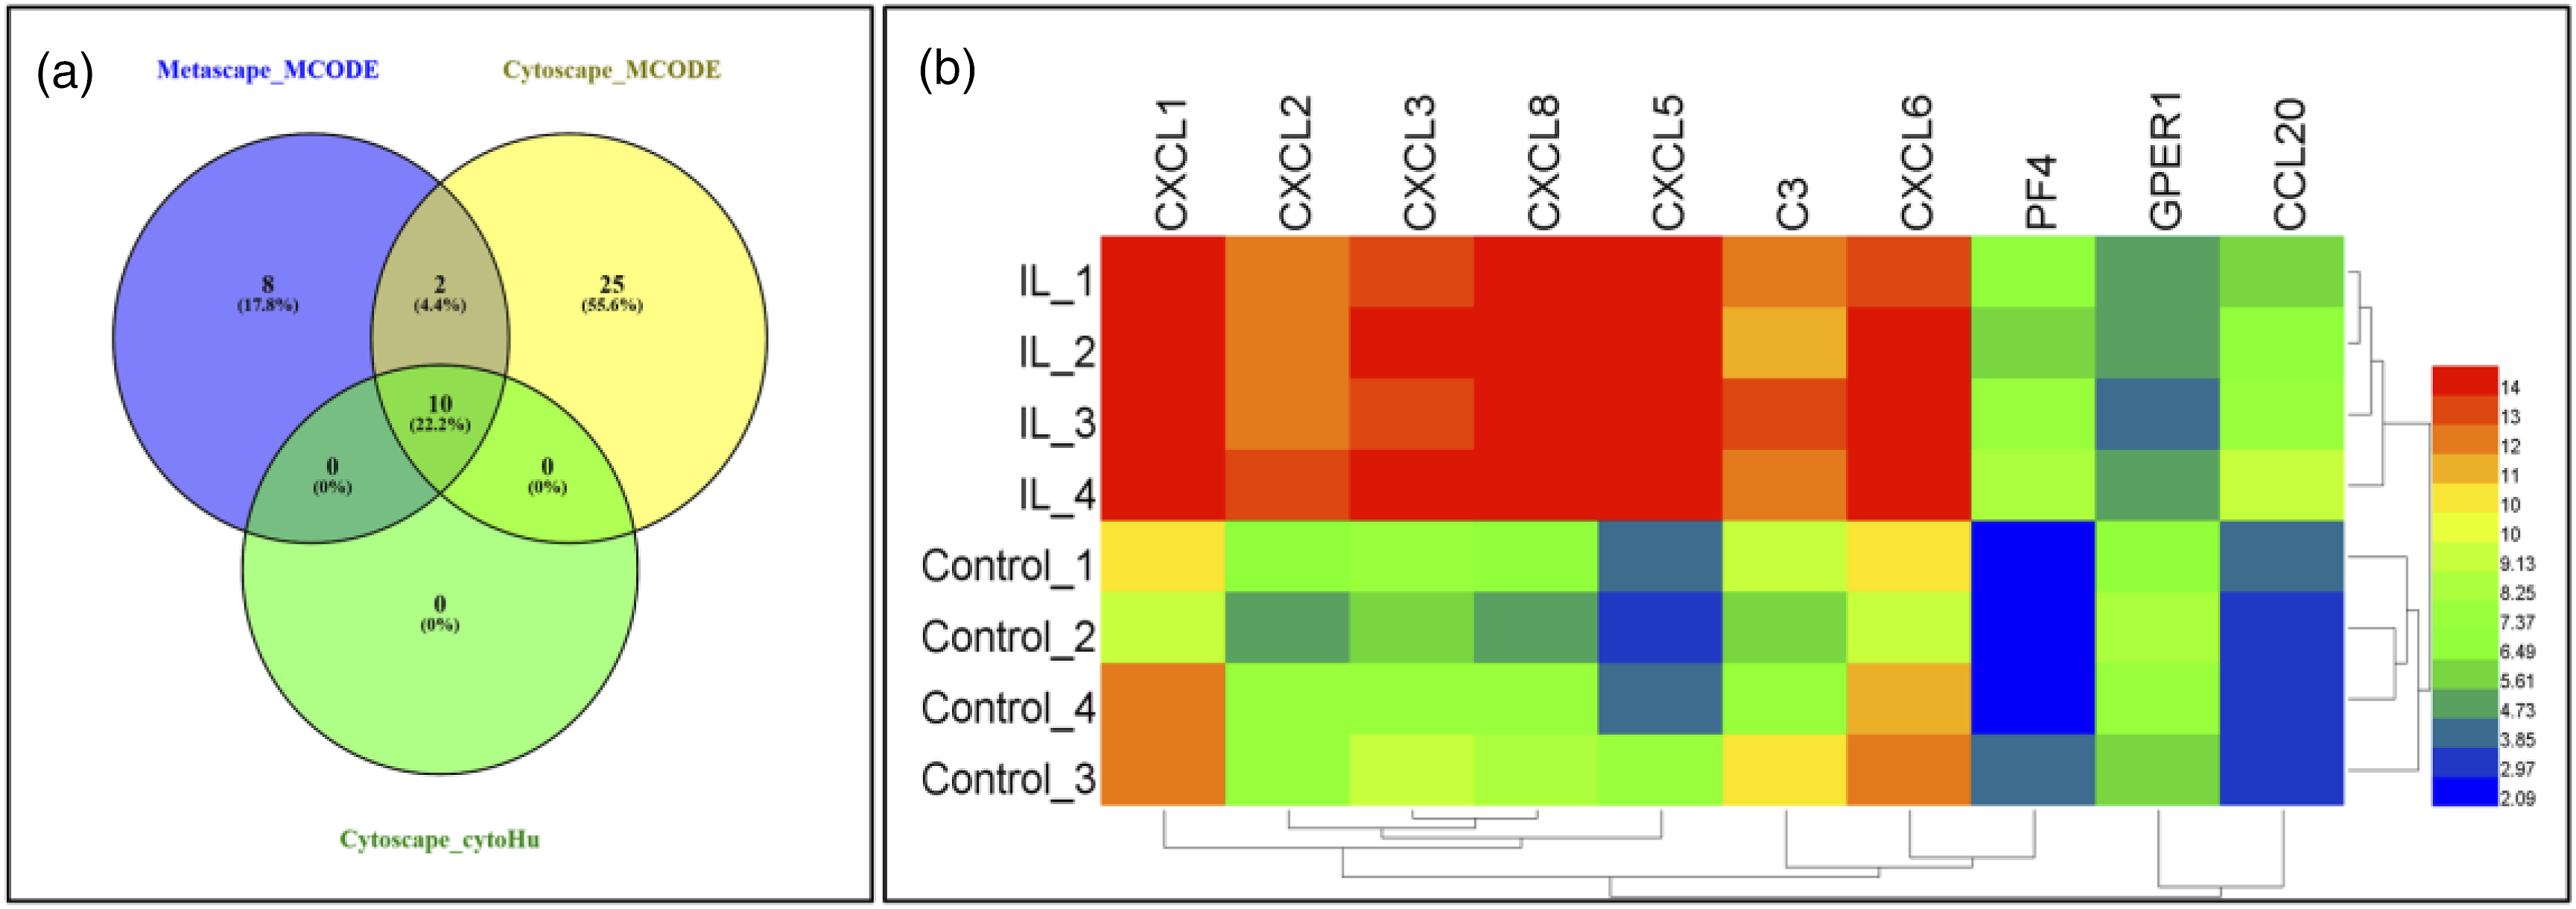
Discussion
Discussion
Biological information analysis has been widely applied to help scientists identify new therapeutic targets by exploring gene changes in the process of disease development.26,27 In the present study, we focused on inflammation as the primary etiological factor impacting disc degeneration, and IL-1β was selected as a representative inflammatory cytokine. 28 Therefore, we obtained gene expression profiling data from GEO microarray datasets containing four samples of degenerative IVD cells stimulated with 102 pM IL-1β and four controls. The key genes that were affected during disc degeneration caused by inflammatory cytokine exposure were analyzed using bioinformatics analysis, and 260 DEGs were obtained (161 upregulated and 99 downregulated). Subsequently, GO annotation and KEGG pathway enrichment analyses of the DEGs revealed their participation in several cellular processes (e.g., the regulation of chemotaxis and taxis) and signaling cascades related to IVDD development (e.g., the interactions of cytokine-cytokine receptor interaction and rheumatoid arthritis). A PPI network based on these genes was constructed to obtain the top 10 hub genes: CXCL8, CXCL1, CCL20, CXCL2, CXCL5, CXCL3, CXCL6, C3, PF4, and GPER1. Our results suggest that increased levels of IL-1β affected the expression of the hub genes, and subsequent analysis confirmed their involvement in important IVDD-related pathways. Therefore, we believe that these hub genes might be potential biological targets for IVDD diagnosis and for the development of therapeutic drugs.
Chemokines produced by mammalian cells during inflammation are a class of chemotactic and inducible small molecule peptides that are ubiquitous and play an important role in acute and chronic inflammation. 29 Based on key cysteine residues involved in disulfide bonds, chemokines are classified as C, CC, CXC, and CX3C. 30 Among the top 10 hub genes observed in the present study, CXCL8, CXCL1, CXCL2, CXCL5, CXCL3, CXCL6, and PF4 belong to the CXC family of chemokines, CCL20 belongs to the CC family, and C3 belongs to the C family. Of the nine chemokines, CXCL8, CXCL6, and CCL20 have been confirmed to participate in IVDD in previous studies. Zhang et al. 31 found that AF samples from patients with low back pain had an elevated IL-8 expression compared to controls with scoliosis. CXCL6 has also been detected in a conditioned medium of induced-degenerative discs in an organ culture and may contribute to the chemotactic response of induced-degenerative discs. 32 Grad et al. 33 observed significantly elevated levels of systemic blood plasma concentrations of chemokine CXCL6 in individuals with moderate/severe disc degeneration, in comparison with a control group with no signs of disc degeneration, according to the MRI results. Meanwhile, Zhang et al. 34 reported that NP cells from the extruded and herniated patient groups could produce abundant amounts of CCL20. Subsequently, Zhang et al. 35 suggested a potential mechanism for the recruitment of IL-17-producing cells to degenerated IVDs via a CCL20/CCR6 system in vivo, while IL-17 is involved in the autoimmune process of IVDD in rat models. In the present study, the expression of CXCL8, CXCL6, and CCL20 in IL-1β-exposed samples were increased by 7.88-fold, 3.2-fold, and 4.18-fold, respectively, compared to control samples, respectively. Therefore, we speculated that increased levels of IL-1β affected the expression of CXCL8, CXCL6, and CCL20 in IVD cells, suggesting that these chemokines may be potential new targets for treating IVDD. However, we did not retrieve any literature identifying whether IVDD is correlated with CXCL5, CXCL1, CXCL2, CXCL3, C3, and PF4. Therefore, further research investigating the six genes is needed to determine their detailed mechanisms in IVDD.
Previous studies have shown that pathological inflammation of IVD and peridiscal space is characterized by increased levels of pro-inflammatory cytokines and chemokines.36–38 Cytokines and chemokines have three modes of action: (1) recruiting inflammatory cells and activation of phagocytosis, (2) stimulating the production of other inflammatory mediators and MMPs, and (3) enhancing matrix degradation.39–44 In terms of GO enrichment analysis, we found that most DEGs were mainly involved in the regulation of chemotaxis and taxis, cytokine activity, cytokine receptor binding, and chemokine receptor binding. Regarding the KEGG pathway, we found that most of the DEGs were primarily involved in cytokine-cytokine receptor interaction, TNF signaling pathway, and chemokine signaling pathway. In addition, among the top 10 hub genes, 9 chemokines were the most significantly upregulated genes. Therefore, in addition to the direct effect on IVDD, increased levels of IL-1β may activate a cascade of detrimental self-promoting events that exacerbate IVDD by stimulating the production of pro-inflammatory cytokines and chemokines. Furthermore, experimental studies have reported the role of pro-inflammatory cytokines in degenerated and painful IVD,45,46 which indicates that IL-1β is significantly associated with low back pain.
The underlying molecular mechanisms of IVDD have been previously investigated, and extracellular matrix degradation and inflammation have been confirmed to play a critical role in accelerating IVDD progression. A normal adult IVD is composed of vascular tissue, which contains a large amount of extracellular matrix, and the disc cells are responsible for maintaining the integrity of the extracellular matrix. 47 Changes in the metabolic balance of IVD cells affect the quality and quantity of the extracellular matrix and its functional properties; therefore, these changes can be related to disc degeneration. 48 Our study showed that the DEGs were mostly enriched in the extracellular region and extracellular matrix, which indicates that IL-1β may be involved in IVDD by affecting the quality and quantity of the extracellular matrix. In addition, Le et al. 16 reported that IL-1β induced the expression of MMPs, and the upregulation of MMPs expression is implicated in disc extracellular matrix destruction, leading to the development of IDD. 49 Similarly, our bioinformatics analysis showed that MMP-3 significantly increased in degenerative IVD cells stimulated with 102 pM IL-1β compared to controls. Therefore, we inferred that IL-1β may affect the extracellular matrix and participate in IVDD by stimulating the expression of MMPs, although MMP-3 is not among the top 10 hub genes.
Furthermore, GPER1, which is an estrogen receptor (ER), was the only downregulated hub gene (downregulated by 2.42-fold). There are four major naturally occurring estrogens identified in women: oestrone (E1), estradiol (E2), oestriol (E3), and estetrol (E4). In addition, ERs consist of two classic nuclear receptors, ER-α and ER-β, and membrane-bound GPR30. 50 Over the past decade, many researchers have studied the relationship between estrogen and IVDD and found that estrogen can effectively alleviate IVDD development by inhibiting the apoptosis of IVD cells. Eestrogen can decrease IVD cell apoptosis in multiple ways, including the inhibition of inflammatory cytokines IL-1β and TNF-α, reducing catabolism due to MMP inhibition, upregulating integrin α2β1 and IVD anabolism, activating the PI3K/Akt pathway, decreasing oxidative damage, and promoting autophagy. 50 Song et al. found that both cytoplasmic and nuclear staining of ER-α and ER-β immunoreactivity were observed in NP cells, and ER-α and ER-β expression significantly decreased, along with the aggravation of IVDD in both males and females. 51 Wei et al. 52 also showed that GPR30, which has a high affinity for estrogen, is expressed in the human disc NP and can mediate E2-enhanced cell proliferation and influence disc cell survival. Therefore, we speculate that IL-1β decreases the expression of GPER1 in human disc AF, which accelerates disc degeneration.
Despite the rigorous bioinformatic analysis performed in the present study, there were still some limitations. First, the size of the dataset was small; thus, further analyses with an increased sample size are necessary to confirm the results. Second, we did not conduct further experimental verification of the screened genes. Although our study had these limitations, we believe that the results of the present study may provide potential directions for future research.
Conclusions
In this study, bioinformatic analysis of the gene expression profiles of degenerative IVD cells stimulated with IL-1β showed that CXCL8 and other nine key genes may play a role in the development of disc degeneration induced by inflammatory reactions. This suggests that bioinformatics methods can be used to identify potential therapeutic target genes and provide new insights into IVDD.
Footnotes
Declaration of conflicting interests
The author(s) declared no potential conflicts of interest with respect to the research, authorship, and/or publication of this article.
Funding
The author(s) disclosed receipt of the following financial support for the research, authorship, and/or publication of this article: This work was supported by the key medical disciplines/schools of Shijingshan district, Beijing.