
Abstract
Purpose:
This study was designed to investigate (1) the contour of the distal tibial cutting surface, and (2) the bone mineral density (BMD) of the distal tibial cutting surface used during total ankle arthroplasty (TAA).
Methods:
Eight-four distal tibial models were created using foot and ankle computerized tomographic (CT) images taken from normal people. The distal tibial cutting surface for TAA was determined to be 10 mm proximal to the tibial plafond. The bony contour and BMD values were determined from the CT image at that level. A bounding box was made on the contour and the width and length of the contour was measured. Regional BMD was evaluated by Hounsfield units (HU) value measurement, with 7 regions of interest (ROI) on 8 different directions for all the 84 CT images. Two different observers made independent measurements and mean HU values for all the 56 ROIs were calculated.
Results:
Great variations were found among the contours of the cutting surface especially in term of the shape of the anterior and posterior tibial tubercle, and the fibular notch. These variations could be grouped into six categories. For the BMD of the cutting surface, the medial border of the cutting surface did not included cortical bone. The HU value of seven ROIs, which included cortical bone, were significantly greater than all the other ROIs. Few statistical differences were found by multiple comparisons among HU value of all the 49 ROIs without cortex.
Conclusions:
Great variability existed in the shape and the BMD of the distal tibial cutting surface.
Introduction
Total ankle arthroplasty (TAA) has become a widely accepted treatment alternative to arthrodesis for end-stage arthritis. 1 –4 As the indications were extended and the techniques of TAA were refined, 5,6 the survivorship of the third-generation implants have improved such that the 5-year survival rates are now more than 90%. 7 –12 However, the complication rates remain high with aseptic loosening and subsidence remaining a common complications following TAA. 13 –15
Aseptic loosening or subsidence related factors appear to be multiple and include age, body mass index (BMI), preoperative deformity, postoperative alignment, ipsilateral hindfoot fusion and implant design. 9,16 –19 In addition, the size of the implant and the bone density and cortical continuity of the distal tibia osteotomy should be considered in the assessment of the potential of aseptic loosening. 20 –22 Distal tibial metaphyseal bone is 40% weaker than talar bone and the strength of the distal tibial metaphysis decreases substantially at the usual level of the distal tibial osteotomy, 10 mm to 15 mm superior to the plafond. 20,23,24 It is assumed that the ideal tibial component should provide anatomic cortical coverage. 25 However, the variable shape of the distal tibial-fibular notch and retained medial malleolus results in a very irregular osteotomy surface with a lateral cutout and a straight medial edge. Thus, individual patients demonstrate highly varied distal tibial osteotomy anatomy, making it difficult to create truly anatomic distal tibial components. Moreover, when designing prosthesis or positioning the tibial tray during TAA, it is not known which portion of the tibial component must be covered by cortical bone and which portion can be safely left uncovered. Comparing to the current non-anatomic tibial component, the new anatomic shaped tibial tray were designed for tri-cortical endplate coverage, it is still not clear which type could obtain more cortical bone support. 9,26,27
Hounsfield units (HU), measured from computed tomography (CT) imaging, can evaluate regional bone mineral density (BMD) and have been shown to be positively correlated with T-score measurements from dual X-ray absorptiometry (DXA). 23,28,29 It has been demonstrated that low regional HU values had a significant association with the severity of supination external rotation ankle fractures and was strongly related with intraoperative fractures of TAA. 30,31
Our hypothesis is that investigations on the contour and BMD of the distal tibial cutting surface could help us to direct a new anatomic tibial component design for a TAA, and to improve tibial component position. Similar research on these two issues has not been accomplished. The purpose of this study was to investigate (1) the contour of the distal tibial cutting surface, and (2) the BMD of the distal tibial cutting surface created during TAA.
Materials and methods
Study participants
The protocol of the study was approved by the ethics committee of our institution. Imaging studies from 107 patients from our institution, who received a bilateral foot and ankle CT scan due to a unilateral fracture or sprain, were retrospectively reviewed. Inclusion criteria for the uninjured foot and ankle included: (1) no previous sprain or fracture, (2) the absence of any deformity or degenerative arthritic changes. Two of the authors reviewed the medical history and CT image independently with any disagreement in eligibility resolved by consensus discussion. Twenty-three uninjured feet and ankles were excluded, 17 with a positive medical history for previous sprain or fracture, 5 for degeneration changes and 1 for deformity. Thus, 84 CT images of uninjured ankles were enrolled, 48 right and 36 left side, 43 males and 41 females. All were Han Chinese. The mean age was 24.73 years (19–46). The mean height, weight and BMI were 170.11 ± 7.97 cm, 64.01 ± 12.69 kg and 21.96 ± 3.08.
Reconstruction of distal tibial models
The CT imaging was performed using axial slices (brilliance iCT, Philips, Cleveland, USA; 120 kV, 250 mA, slice thickness = 0.67 mm, slice increment = 0.67 mm, pixel size = 512 × 512 matrix). First, the DICOM images were imported into Mimics (Version 9.0, Materialise NV, Belgium). After proper segmentation, filtering and rendering, three-dimensional (3D) distal tibial models were then imported into Geomagic Studio 2013 (Geomagic, Morrisville, NC, USA) to refine the geometry. Finally, left models were transferred to right using left-right mirror transform.
Distal tibial resection contour and CT image of the cutting surface
First a plane aligned along the inner side of the medial malleolus facet was built, and an axial tibial contour, which was perpendicular to anatomic axis of the distal tibial, at the level of the distal tibial platfond was obtained (Figure 1(a) and (b)). Then, two points were made on this axial contour by the plane (Figure 1(a) and (b)). Next, a sagittal plane, which passed through the posterior point, was created to make a line on the axial tibial contour 10 mm superior to the platfond (Figure 1(a) and (b)). Distal tibial resection was completed and the contour of the distal tibial cutting surface during TAA was obtained (Figure 1(c) and (d)). The contour was imported into CT data. Finally, CT image of the distal tibial cutting surface was extracted.

Distal tibial resection was done on the reconstruction model. (a) Distal tibial resection was observed from coronal view. (b) Distal tibial resection was observed from transverse view. The blue plane was aligned along the inner side of the medial malleolus facet (a), the distal yellow dotted line represented axial tibial coutour at the level of platfond (b), two point of the distal yellow coutour were made by the blue plane, the green point represented posterior point (c) and the pink point represented anterior point (d), the proximal yellow dotted line represented axial tibial coutour 10 mm above the platfond (e), the red dotted line represented the sagittal plane passed the green point (f). (c) Distal tibia was observed from coronal view after resection. (d) Distal tibia was observed from transverse view after resection.
Radiographic measurements
A bounding box was made on the contour with the width and length of the bounding box defined as the width and length of the contour (Figure 2(a)). This bounding box could be measured automatically by solid modeling software (Rhinoceros, Seattle, WA, USA). Two diagonal lines, two horizontal lines and one vertical line were made on this bounding box. Thus, the eight directions (a to h) of CT image measurement were conducted (Figure 2(a)). HU values of seven tangent circular regions of interest (ROIs) on each direction were measured and the first ROI contained the cortex except direction h. The diameter of ROI was 5% length of each contour. The first ROI of direction h was tangent to the medial edge of the cutting surface (Figure 2(b) and (c)). Consequently, the 56 ROIs were named (a0, a5, a10, a15…, h20, h25, h30). In addition that the size of the bounding box and contours was scaled according to the mean length. All the adjusted contours were coincided based on the center of their bounding box to obtain a contour mapping. Double HU measurement was made on 10 randomly selected directions including 70 ROIs by two authors independently to establish interobserver reliability.
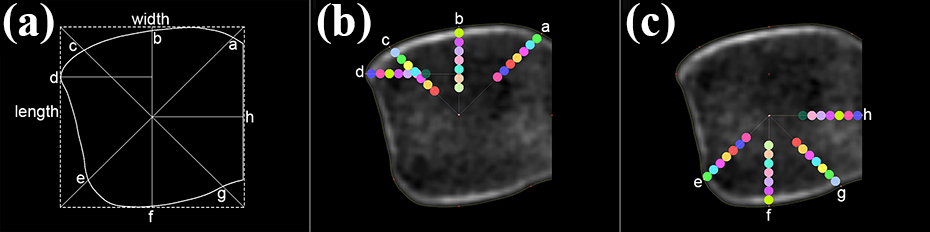
The coutour and CT image of the distal tibial cutting surface measurement: (a) The width and length of the coutour measurement, and eight directions (a to h) of CT image. (b) HU value measurement on the ROIs of direction a, b, c and d. (c) HU value measurement on the ROIs of direction e, f, g and h.
Statistical analysis
Interobserver reliability was evaluated using intraclass correlation coefficients (ICCs). The reliability was thought to be good if ICC > 0.75. 32 Multilevel, mixed-effects, generalized linear models were used to investigate if gender, age, side of foot, height, weight and BMI had an effect on HU value. Adjusted regression coefficient with 95% confidence intervals and p values were calculated. Reference categorical characteristics were indicated with an odds ratio of 1.00. A single factor ANOVA was utilized to identify the differences between mean values of different groups. When a difference was found, a multiple comparisons test was applied. The analyses were conducted with the statistical package STATA 13.1 (StataCorp LP, College Station, TX, USA) and P value < 0.05 was considered significant.
Results
Contour measurement, categorization and variability analysis
The length and width of the contours were recorded (see Supplementary file 1). The mean width was 36.57 ± 3.28 mm (27.52 to 44.01 mm), and mean length was 36.39 ± 3.06 mm (30.49 to 43.52 mm). The mean width/length ratio was 1.01 ± 0.06 (0.86 to 1.13). There was variability among these contours especially in the shape of anterior tibial tubercle, fibular notch, and posterior tibial tubercle. These variabilities could be grouped into 6 categories (Figure 3). The shape of anterior tibial tubercle can be described as smooth or sharp (Figure 3(a) and (b)). When drawing a vertical line from the base of anterior tibial tubercle, the fibular notch can be described as typical and the posterior tibial tubercle can be described as apparent (Figure 3(a) and (b)) if the vertical line has two intersections with the contour, the fibular notch can be described as straight and the posterior tibial tubercle can be described as inapparent (Figure 3(c) and (d)) if the vertical line almost coincides with the contour, and the fibular notch can be described as oblique and the posterior tibial tubercle can be described as null (Figure 3(e) and (f)) if the vertical line has only one intersection with the contour (Table 1). However, no difference was found among the contour length/width ratio of the six categories (p > 0.05). The contour mapping indicated great variability existed in the irregular lateral and straight medial edge (Figure 4).
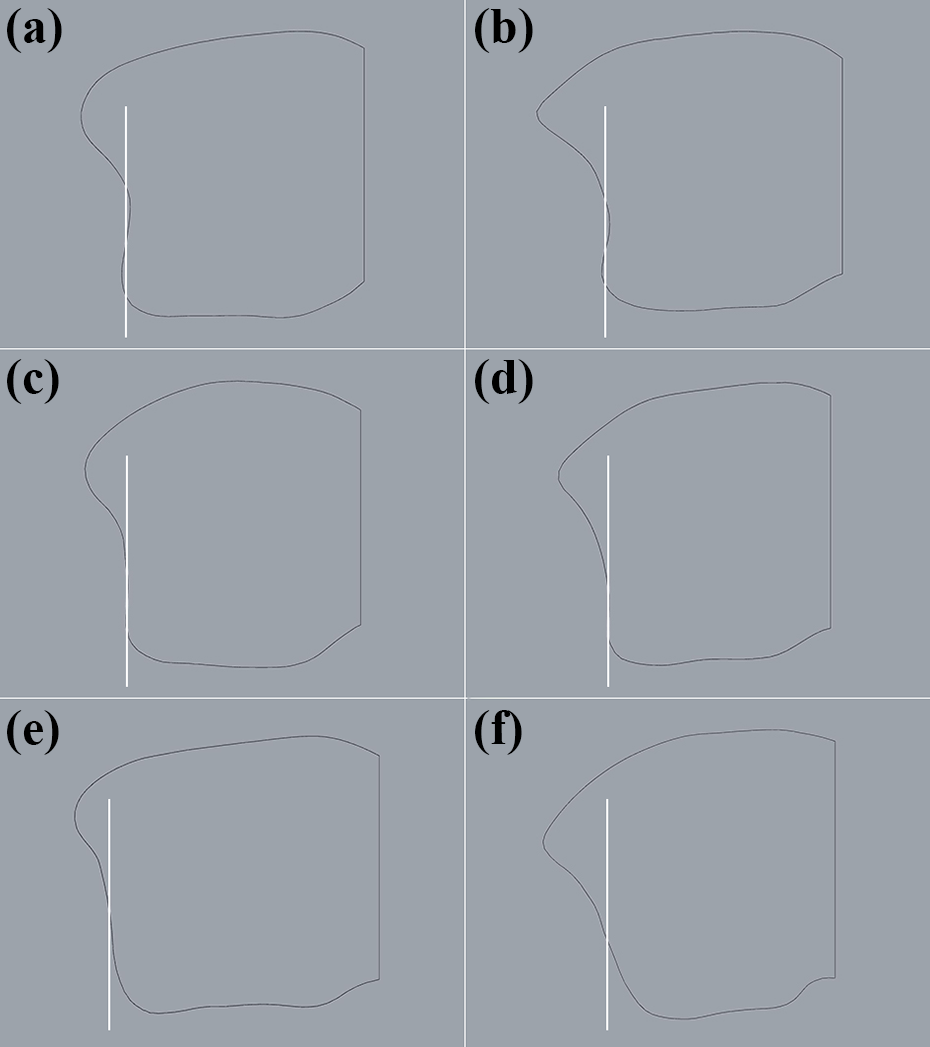
Coutour of distal tibial cutting surface categorization. (a) Feature of category I coutour: smooth anterior tibial tubercle, typical fibular notch and apparent posterior tibial tubercle. (b) Feature of category II coutour: sharp anterior tibial tubercle, typical fibular notch and apparent posterior tibial tubercle. (c) Feature of category III coutour: smooth anterior tibial tubercle, straight fibular notch and inapparent posterior tibial tubercle. (d) Feature of category IV coutour: sharp anterior tibial tubercle, straight fibular notch and inapparent posterior tibial tubercle. (e) Feature of category V coutour: smooth anterior tibial tubercle, oblique fibular notch without posterior tibial tubercle. (f) Feature of category VI coutour: sharp anterior tibial tubercle, oblique fibular notch without posterior tibial tubercle.
Contour categorization.

Length/width ratio represent means ± standard deviation. *No difference was found among the contour width/length ratio of the six categories.

Mapping for the coutour of distal tibial cutting surface after scaling and center coinciding. Blue meant no coutour passed through and reddish black meant 70 of the 84 (79.7%) coutours passed through.
HU value measurement
The interobserver reliability for HU measurement was 0.997 (0.995 to 0.998), which was regarded as good. HU values of 56 ROIs for all the cutting surfaces were recorded (see Supplementary file 1) and the mean HU values for all the ROIs in each direction were calculated (Table 2). Gender, age, side of foot, height, weight and BMI did not have a significant effect on HU values (Table 3). Statistical analysis indicated HU value of a0, b0, c0, d0, e0, f0 and g0 were significantly higher than the other ROIs (p < 0.001). Significant differences were found between the HU values of these seven ROIs (Table 2). In addition, HU value analysis of the second ROIs of the eight directions suggested d5 and b5 were higher than f5 (Table 2). Although few differences were found by multiple comparisons among HU value of all the 49 ROIs without cortex (see Supplementary file 2), line chart indicated that the HU value significantly decreased from the second ROI then generally remained unchanged and the HU values were almost the same on direction h (Figure 5).
Mean HU value of each ROI on each direction.

Values represent means ± standard deviation; ROI: regions of interest; 0%, 5%, 10%, 15%, 20%, 25% and 30% meant the percentage of each length was the interval for each ROI to the margin of cortex; same symbol means no statistical difference was found; *, #, ¶ and • had significant difference in the row of “0% ROI”; ▪ and ♦ had significant difference in the row of “5% ROI”.
The effects of patient characteristics on HU value.
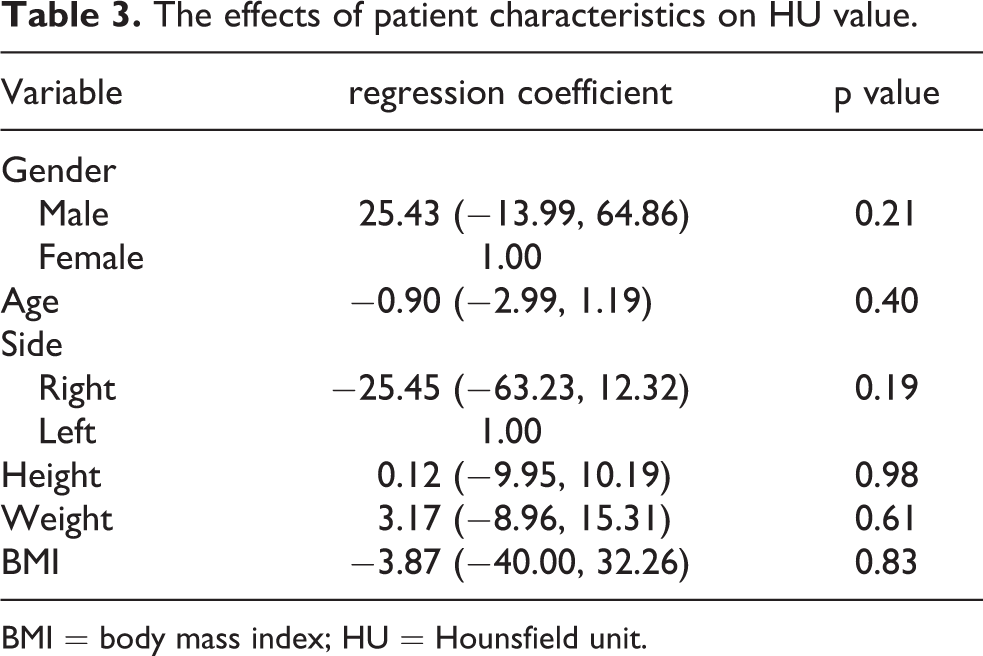
BMI = body mass index; HU = Hounsfield unit.

Line graph of the HU value changes on each direction. (a) HU value change on direction a. (b) HU value change on direction b. (c) HU value change on direction c. (d) HU value change on direction d. (e) HU value change on direction e. (f) HU value change on direction f. (g) HU value change on direction g. (h) HU value change on direction h.
Discussion
Current bone preparation results in a loss of cortical bone on medial side of distal tibial cutting surface. 26,27 This is similar to unicompartmental knee arthroplasty (UKA) of proximal tibial bone preparation. 33 The results demonstrated that it was relatively safe to leave the mid-portion of the medial side and the posterior portion of the lateral side without cortical coverage during UKA. 34
Our results show the contour of distal tibial cutting surface used during TAA is irregular. However, few of the widely used total ankle implants copied this morphologic feature. 9,26,27 In one study 94.7% of the bony support of the Salto tibial component was provided by trabecular bone and 4.8% by cortical bone, while 93.0% of the Salto Talaris bony support was provided by trabecular bone and 6.1% by cortical bone. 35 Even 0.9% and 0.5% were unsupported at the fibular notch for the two implants, which might result in postoperative impingement. 35 Although the anatomic shaped tibial trays of two current total ankle systems (Cadence and Vantage) are designed to achieve tri-cortical endplate coverage and accommodate the fibular notch. 27,36 We found great variability in the shape of the lateral border of the distal tibia cutting surface which could be grouped into six categories suggested more than one shape of tibial component might be needed for a certain size implant.
One study investigated the subchondral bone strength of the tibial plafond using nine equal-sized grid zones by puncture tests, and found that bone strength of anterior-lateral zone was greater than that of posterior-middle zone. 37 Our study, which investigated the BMD of metaphyseal area 10 mm proximal to the tibial plafond suggested different findings. In our study the cutting surface anterior-medial (a0), posterior-medial (g0) and posterior-lateral (e0) cortical bone was weaker than the cortical bone of other zones (b0, c0, f0 and d0). We selected our osteotomy site 10 mm above the plafond. A different osteotomy level might result in different findings. The bone strength of the seven cortical bone zones (a0, b0, c0, d0, e0, f0 and g0) was significantly greater than other regions. Tibial component plafond should cover these seven zones as much as possible to obtain maximum bone support. 38 However, anatomic variations in distal tibia contours might result in insufficient cortical bone coverage for the implant, especially for the anterior tibial tubercle. On the other hand, the BMD was consistent between ankles for the medial edge (h direction) of the cutting surface. Consequently, it was proposed that the tibial component must cover the anterior and posterior cortex, and also should be flush with the cortex at the fibular notch and the anterior and posterior tibial tubercles. However the tibial component does not need to sit on the medial border of the cutting surface regardless of whether an anatomic or non-anatomic implant is used.
According to our results, the mean width/length ratio for the distal tibial osteotomy cutting surface was 1.01. As the diameter of ROI is 5% of the length of each contour. Based on our research, the width/length ratio of tibial component platfond was no less than 0.96 (1.01–0.05) if a new anatomic tibial component is designed to cover the anterior tibial tubercle cortex. However, most of the width/length ratios for the tibial component of Cadence ankle system are less than 0.96. 39 Thus the cortical bone of the anterior tibial tubercle might not be covered by this component. It was also not clear if the flat cutting surface could provide the current anatomic tibial component more cortical bone support than the non-anatomic implants. Long-term clinical studies of current anatomic designs are needed to prove whether or not they decrease aseptic loosening compared to non-anatomic implants.
Some limitations exist. First, TAA is a treatment option for end-stage arthritis. However, potential deformity, osteophyte or cyst of metaphysis could impact the contour and bone mineral density measurement. Normal CT images were used to investigate contour and BMD. Consequently, our results only reflect the BMD of normal distal tibias. Also it has been suggested that BMD around the ankle may not reduce but actually increase when comparing patients with arthritis to controls. 40 Second, HU values differ when images are obtained from different cohort or by different CT scanners. Thus our results would not be comparable to those from other studies. Third, the quantitative comparison of bone support between current tibial components could not be done in this study because only one total ankle (INBONE II) was available in our region, and the tibial fixation depend on press-fit tibial stem rather than bony coverage. Fourth, another published study indicated bony support might be decreased using flat resections compared to round resections at comparable resection depths. Finally, a 10 mm proximal flat resection to the tibial plafond did not allow us to investigate the contour and BMD of a cutting surface for transfibular approach ankle systems. Although published study indicated bony support might be decreased using flat resections compared to round resections at comparable resection depths. 22
Conclusion
Variations exist among the contours of the distal tibial cutting surface used during TAA especially in the shape of anterior tibial tubercle, fibular notch, and posterior tibial tubercle. This means more shapes were needed when designing anatomic tibial component. The edge of tibial component must cover the anterior and posterior cortex and be flush on the cortex at the fibular notch and the anterior and posterior tibial tubercle. However it does not need to sit on the medial border of the cutting surface. The results found in the present study could help us to improve anatomic tibial component design tibial component position when doing TAA.
Supplemental Material
Supplemental Material, sj-pdf-1-osj-10.1177_23094990211028048 - Investigation on the contour and bone mineral density of the distal tibial cutting surface used for total ankle arthroplasty
Supplemental Material, sj-pdf-1-osj-10.1177_23094990211028048 for Investigation on the contour and bone mineral density of the distal tibial cutting surface used for total ankle arthroplasty by Dahang Zhao, Gonghao Zhang, Dichao Huang, Jian Yu, Kan Wang, Xu Wang, Tiansong Zhang and Xin Ma in Journal of Orthopaedic Surgery
Supplemental Material
Supplemental Material, sj-pdf-2-osj-10.1177_23094990211028048 - Investigation on the contour and bone mineral density of the distal tibial cutting surface used for total ankle arthroplasty
Supplemental Material, sj-pdf-2-osj-10.1177_23094990211028048 for Investigation on the contour and bone mineral density of the distal tibial cutting surface used for total ankle arthroplasty by Dahang Zhao, Gonghao Zhang, Dichao Huang, Jian Yu, Kan Wang, Xu Wang, Tiansong Zhang and Xin Ma in Journal of Orthopaedic Surgery
Footnotes
Authors’ note
Dahang Zhao, Gonghao Zhang and Dichao Huang contributed equally to this work and should be considered as co-first authors.
Declaration of conflicting interests
The author(s) declared no potential conflicts of interest with respect to the research, authorship, and/or publication of this article.
Ethical review committee statement
Each author certifies that his institution has approved the human protocol for this investigation and that all investigations were conducted in conformity with ethical principles of research, and that informed consent for participation in the study was obtained.
Funding
The author(s) disclosed receipt of the following financial support for the research, authorship, and/or publication of this article: This work was funded by National Natural Science Foundation of China (Grant No. 82072388 and 81702109), Scientific and Technological Innovation of Shanghai Science and Technology Committee (Grant No: 18441902200).
Supplemental Material
Supplemental material for this article is available online.
References
Supplementary Material
Please find the following supplemental material available below.
For Open Access articles published under a Creative Commons License, all supplemental material carries the same license as the article it is associated with.
For non-Open Access articles published, all supplemental material carries a non-exclusive license, and permission requests for re-use of supplemental material or any part of supplemental material shall be sent directly to the copyright owner as specified in the copyright notice associated with the article.