
Abstract
Purpose:
The meniscal kinematics in the full knee range of motion (ROM) have not been demonstrated by MRI, because the narrow bore of the superconducting magnet prevents full knee motion. The purpose of this study was to the investigate meniscal kinematics associated with femorotibial kinematics using an open-structure MRI unit that allows kinematic analysis of the menisci in full knee ROM.
Methods:
Non-weight-bearing MR images of the right knee of 10 subjects were acquired at six angles of knee flexion (0°, 30°, 60°, 90°, 120°, and full flexion) using a compact 0.2-T MRI system. The positions of the anterior and posterior horns of the medial and lateral menisci (MM/LM) and the medial and lateral femoral condyles (MFC/LFC) were measured at each angle of flexion.
Results:
Significant posterior LFC movement was observed in all sets of adjacent flexion angles of 60°–90° or more, indicating medial pivot motion of the femur. Significant differences in LM position were observed between adjacent flexion angles of 60°–90° or more. The positional relationship between the posterior horn of MM and the MFC was statistically significant in all but 60° flexion. The positional relationship between LM and LFC was significant at flexion angles of ≤90° in the anterior horn and at 60°, 90°, and full flexion in the posterior horn.
Conclusion:
Motion patterns of the menisci were analogous to those of the femoral condyle. Medial pivot motion of the femur caused the greatest posterior movement of the LM. Meniscal kinematics followed the femorotibial kinematics. Comprehension of meniscal kinematics in full knee ROM is important for understanding of injury mechanisms, planning meniscus transplant, and making postoperative care program for meniscus surgery.
Introduction
In the knee joint, the menisci play important roles such as load distribution, 1 –3 joint conformity, 2 joint stabilization, 4 providing lubrication and nutrition to the joint, 5,6 and proprioception. 7,8 It is known that the contact pressure on the menisci increases at higher angles of flexion. 2,9 At these angles, the areas of contact of the femur and tibia with the menisci increase, causing the menisci to bear more weight; therefore, the menisci are crucial to knee joint function. 10 Thompson et al. analyzed normal meniscal kinematics in fresh cadaveric knees using magnetic resonance imaging (MRI), 11 whereas Vedi et al. investigated meniscal kinematics in living knees with MRI, and reported the different kinematics of medial meniscus (MM) and lateral meniscus (LM) (i.e. LM more mobile, while MM less mobile). 12 Meniscal kinematics in the full ROM have not been fully investigated in a single study, because full ROM of a living knee is impossible inside the narrow bore of the superconducting magnet of clinical MRI units. 12,13 In medial pivot motion, however, the femur rotates externally on the tibial plateau around the medial femoral condyle (MFC) at 0° to 120° of flexion. 14 –20 Beyond 120° of flexion, both the MFC and lateral femoral condyle (LFC) roll posteriorly on the tibial plateau; i.e. roll-back motion. 21 Meniscal kinematics related to the medial pivot and roll-back motion have not been fully evaluated in a single MRI study, especially in deeper flexion angles, due to the same restrictions of the narrow bore mentioned above. We hypothesized that meniscal kinematics followed femorotibial kinematics. The purpose of the present study was to investigate the meniscal kinematics associated with femorotibial kinematics in full ROM of living knees using an open-structure compact MRI scanner.
Materials and methods
Subjects
Twenty-two healthy Japanese adult volunteers were recruited to the study and underwent MRI of their right knee. Ten subjects were excluded because of considerable artifact that prohibited precise measurement of meniscal movement, and two were excluded due to discoid meniscus. The final subject population comprised 10 right knees (4 males, 6 females; median age, 28.6 years [range, 22–34 years]; median height, 165.4 cm [range, 154–178 cm]; median body weight, 54.0 kg [range, 42–70 kg]; and median body mass index, 19.2 [range, 16–22]).
All subjects provided written informed consent. The study was approved by the Institutional Review Board.
Image acquisition
1H MR images were acquired using a 0.2-T compact MR imaging system (MRTechnology, Tsukuba, Japan) equipped with an oval 1H solenoidal radiofrequency (RF) coil (130 × 250 mm) specially designed for knee imaging from full extension to full flexion (Figure 1). Three-dimensional (3D) T1-weighted gradient echo imaging (T1w-MRI) was performed using the following imaging parameters: field of view (FOV) 256 × 128 × 128 mm, data matrix 256 × 96 × 96, relaxation delay (repetition time [TR]) 60 ms, echo time (TE) 8 ms, flip angle 60°, and total image acquisition time 9 minutes and 13 seconds. Images were Fourier-transformed with a data matrix of 256 × 128 × 128 after zero-filling of data, and the final voxel size was 1 × 1 × 1 mm. The 3D imaging analysis was performed using OsiriX MD v8.0.2 (Pixmeo SARL, Bernex, Switzerland).
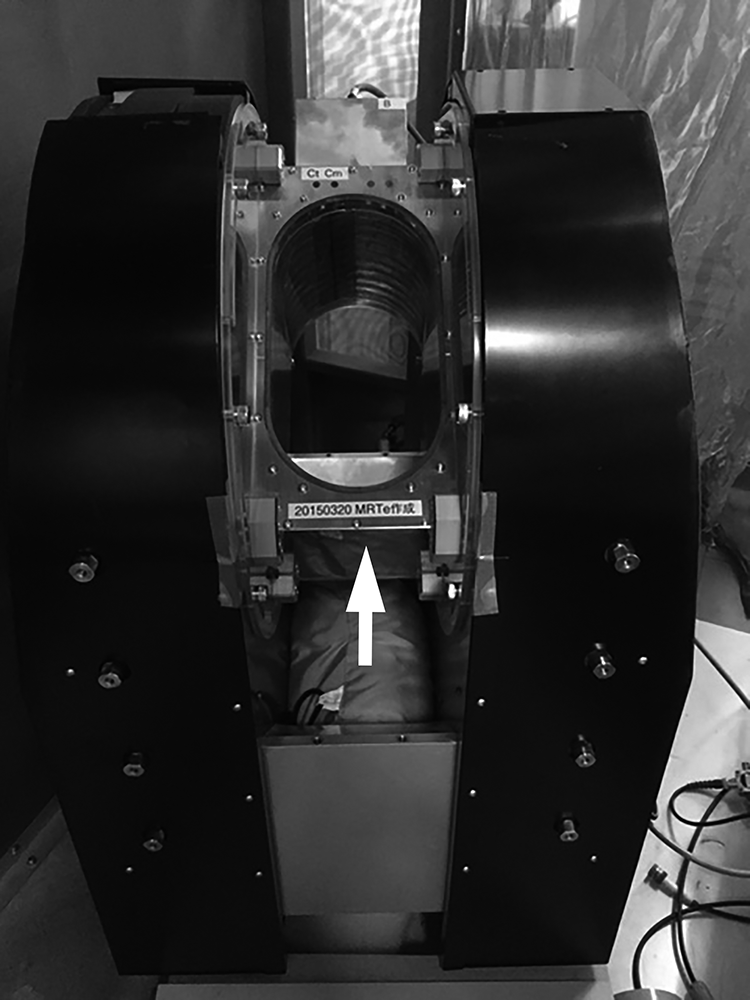
0.2-T compact MRI system. The system (MRTechnology, Tsukuba, Japan) is equipped with an oval 1H solenoidal radiofrequency coil (130 × 250 mm) (white arrow).
Non-weight-bearing images were acquired at six different angles of knee flexion (0°, 30°, 60°, 90°, 120°, and full flexion) (Figure 2). The right knee was fixed in a custom hydraulic splint for each flexion angle except full flexion. Using a goniometer, the angle of thigh to the leg was adjusted to the required flexion angle and fixed in the splint. Care was taken to avoid applying forced internal or external rotation to the lower leg. For full flexion, the subject was asked to sit on their heel and the right knee was then inserted into the magnet.

Representative images using the 0.2-T compact MRI system. The medial (a to f) and lateral (g to l) knee is shown in the following flexion angles: (a and g) 0°; (b and h) 30°; (c and i) 60°; (d and j) 90°; (e and k) 120°; and (f and l) full flexion.
A 3D filter program 22 was used to correct the images and prevent distortion. Images of a 1-cm3 phantom were obtained before each examination to confirm that no new distortions were present.
The anteroposterior (AP) axis of the tibia was defined in the axial plane at the proximal tibia as the line connecting the medial third of the tibial tuberosity and the attachment of the posterior cruciate ligament (Figure 3(a)). Planes parallel to this AP axis and perpendicular to the axial section were defined as sagittal planes. The transverse axis of the tibia was defined as the line perpendicular to the AP axis for which the transverse diameter of the tibia was the largest. The most medial edge and the most lateral edge of the tibia were defined as 0% and 100%, respectively, of the transverse axis of the tibia (Figure 3(b)). At each of the six knee flexion angles (0°, 30°, 60°, 90°, 120°, and full flexion), we created two sagittal images that passed through 20% and 75% of the transverse axis on which MM, LM, MFC, and LFC could be most clearly depicted, and the following measurements were obtained for each knee flexion angle (Figure 3(b)).

Measurement methods. (a) The AP axis of the tibia is shown as the line connecting the medial third of the tibial tuberosity and the attachment of the posterior cruciate ligament. (b) MM, LM, MFC, and LFC were measured on two sagittal images: that passing through the medial 20% of the transverse axis, and that passing through the lateral 75% of the transverse axis. (c and d) MS1/LS1 and MS2/MS2 are shown as the distance from the line tangential to the most anterior edge of the tibial tuberosity to the posterior edge of the anterior horn of the MM, and that to the anterior edge of the posterior horn of the LM, respectively. The positions of the MFC and LFC are shown as the distance from the described tangent to the femorotibial cartilage contact point.
Measurements
In the sagittal plane, the anterior horn of the MM was measured at 20% of the transverse axis, whereas that of the LM was measured at 75% of the transverse axis (Figure 3(c) and (d)). Measurements were conducted independently by two orthopedic surgeons approved by the Japanese Orthopaedic Association. The observers measured each image twice, at an interval of at least 2 weeks.
The tangent passing through the most anterior edge of the tibial tuberosity was defined as TT. In each sagittal plane, the posterior edge of the anterior horn and the anterior edge of the posterior horn of both menisci and the femorotibial cartilage contact point were identified. For the position of the anterior horn, the distance from TT to the posterior edge of the anterior horn of the MM and the LM was defined as MS1 and LS1, respectively. For the position of the posterior horn, the distance from TT to the anterior edge of the posterior horn of the MM and the LM was defined as MS2 and LS2, respectively. For the position of MFC and LFC, the distances from TT to the medial and lateral femorotibial cartilage contact points were defined as MFT and LFT, respectively (Figure 3(c) and (d)).
The observers independently measured MS1, MS2, LS1, LS2, MFT, and LFT at all knee flexion angles in the sagittal planes. The values of these parameters were compared between adjacent flexion angles (e.g., 30° and 60°). The positional relationship between the two menisci and the correspondent femoral condyles was also assessed. To confirm reliability of the measurements, inter-rater reliability and intra-rater reliability were examined.
Statistical analysis
Statistical analysis was conducted using JMP 14.2.0 (SAS Institute Inc. NC). Wilcoxon signed-rank test and Spearman’s rank-order correlation was used for statistical analysis. The results were considered statistically significant when p < 0.05. Inter-rater reliability and intra-rater reliability were assessed by determining the intraclass correlation coefficients.
Results
Position of MFC and LFC at each flexion angle
Figure 4 shows the MFT and LFT values for each flexion angle. The values increased as position became more posterior. There was no statistically significant difference in MFT between adjacent flexion angles except for 60°–90°. In contrast, statistically significant difference in LFT was observed in all sets of adjacent flexion angles at 60°–90° or more. This movement pattern indicates medial pivot motion of the femur. Roll-back motion was not observed.
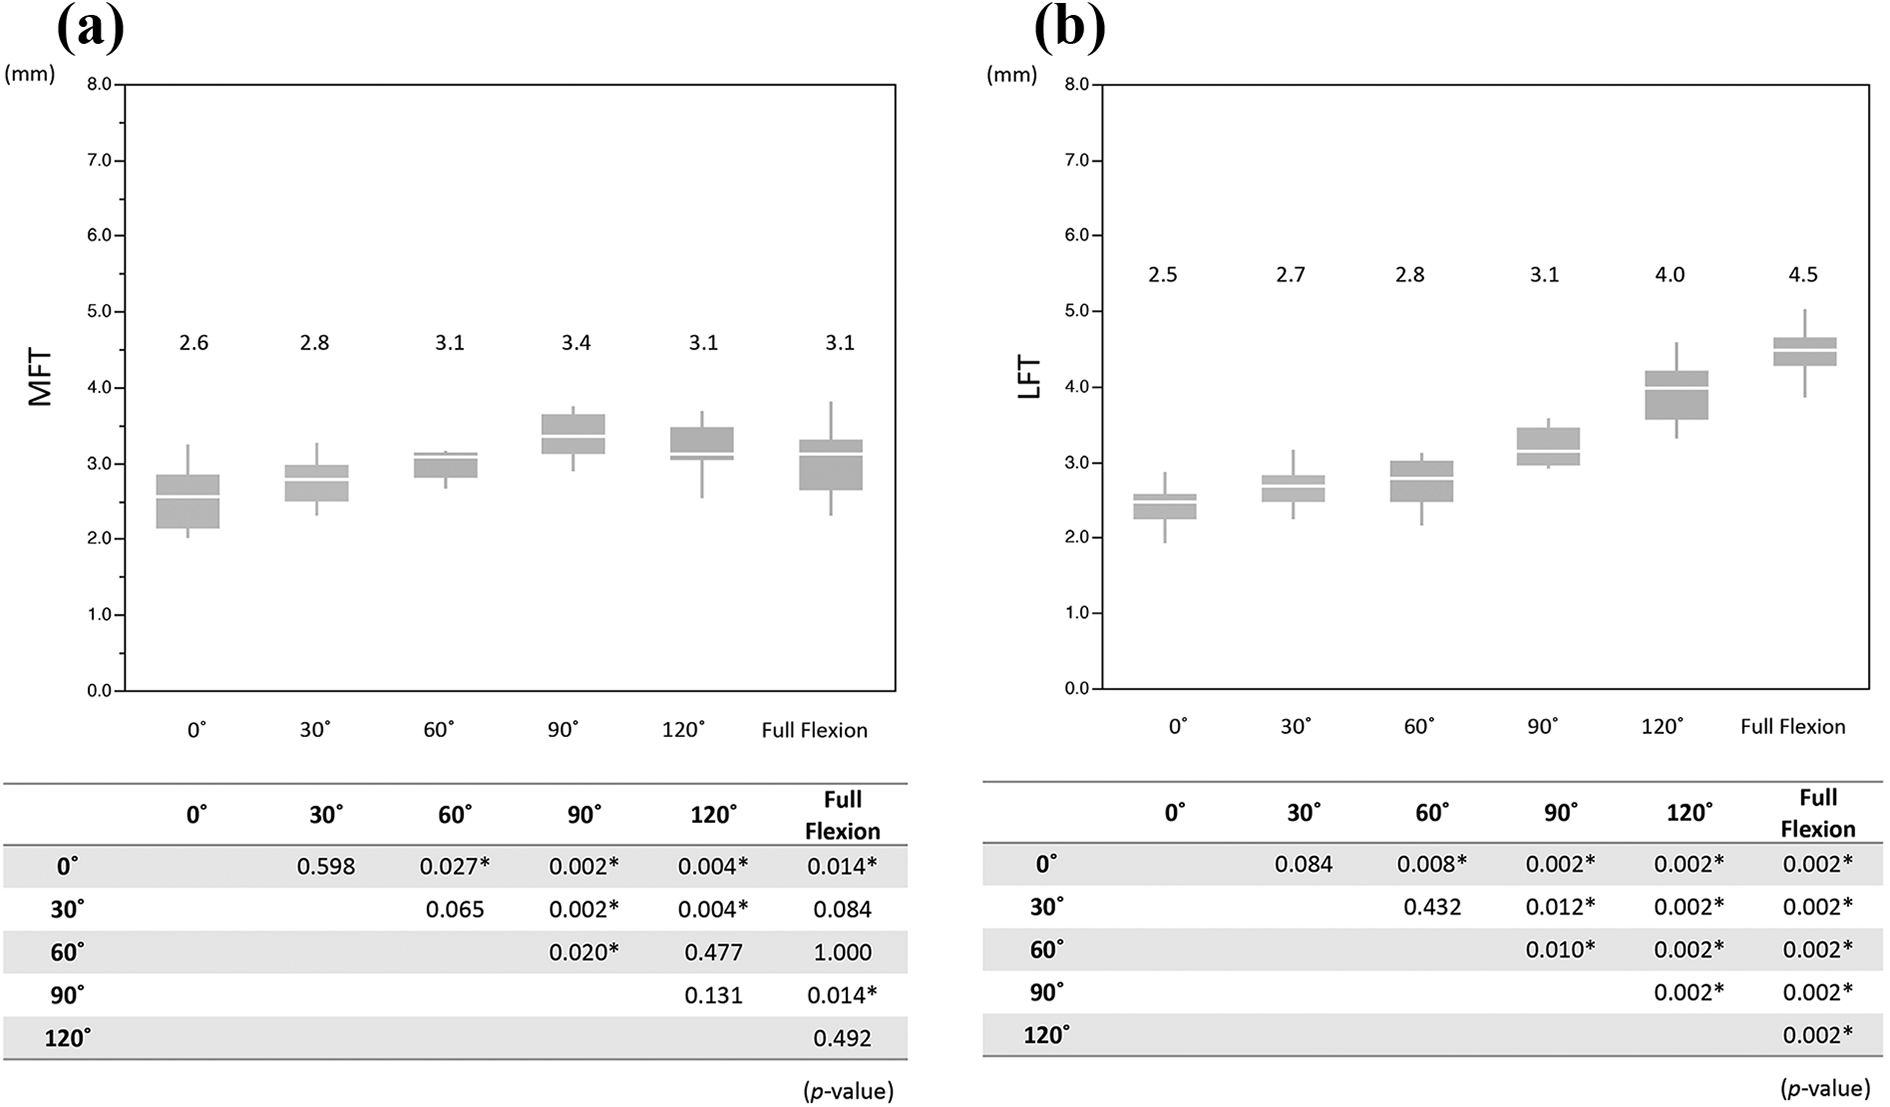
Comparison of MFT and LFT between each flexion angle: (a) MFT and (b) LFT.
Position of MM in each flexion angle
There was no statistically significant difference in MS1 between adjacent flexion angles except for 60°–90° (Figure 5(a)). Significant difference in MS2 was observed for 0°–30°, 60°–90°, and 120°–full flexion (Figure 5(b)).
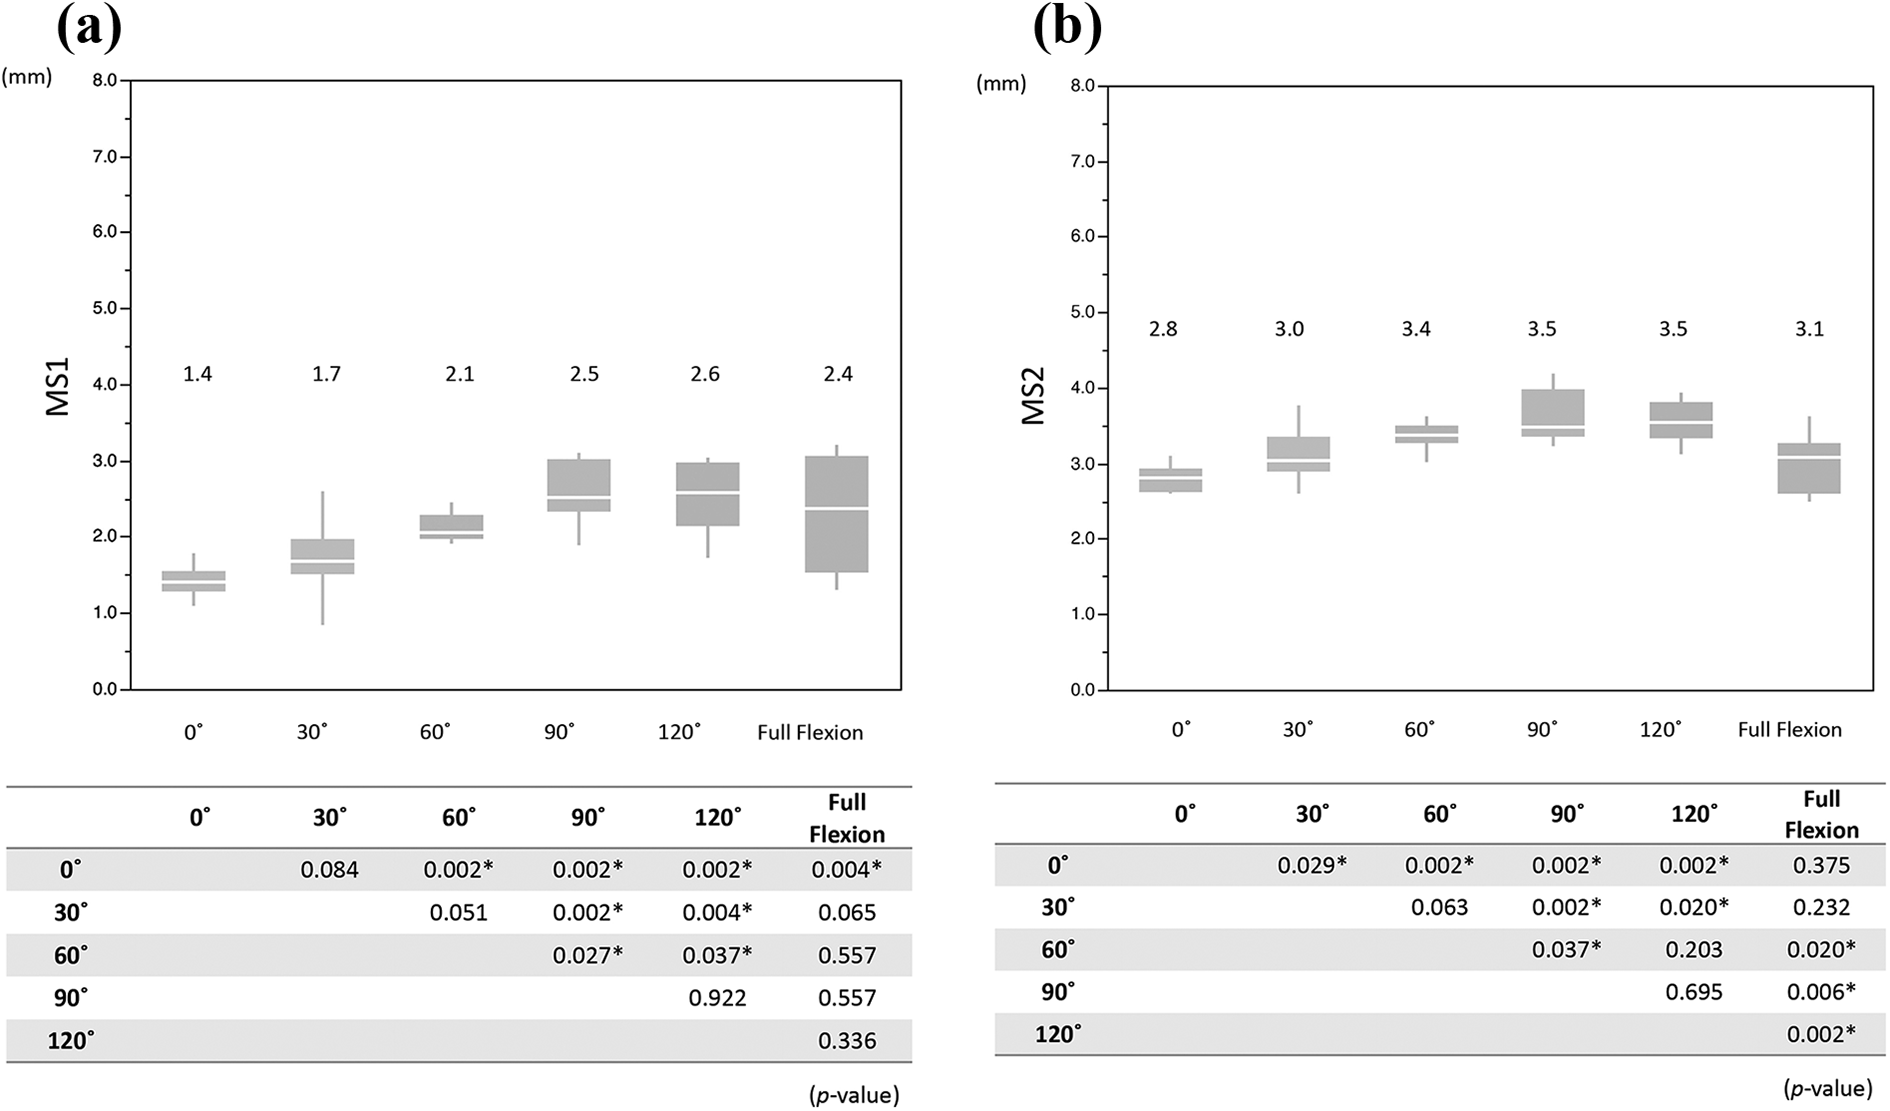
Comparison of MS1 and MS2 between each flexion angle: (a) MS1 and (b) MS2.
Position of LM in each flexion angle
Statistically significant differences were observed in LS1 and LS2 between adjacent flexion angles at 60°–90° or more (Figure 6).
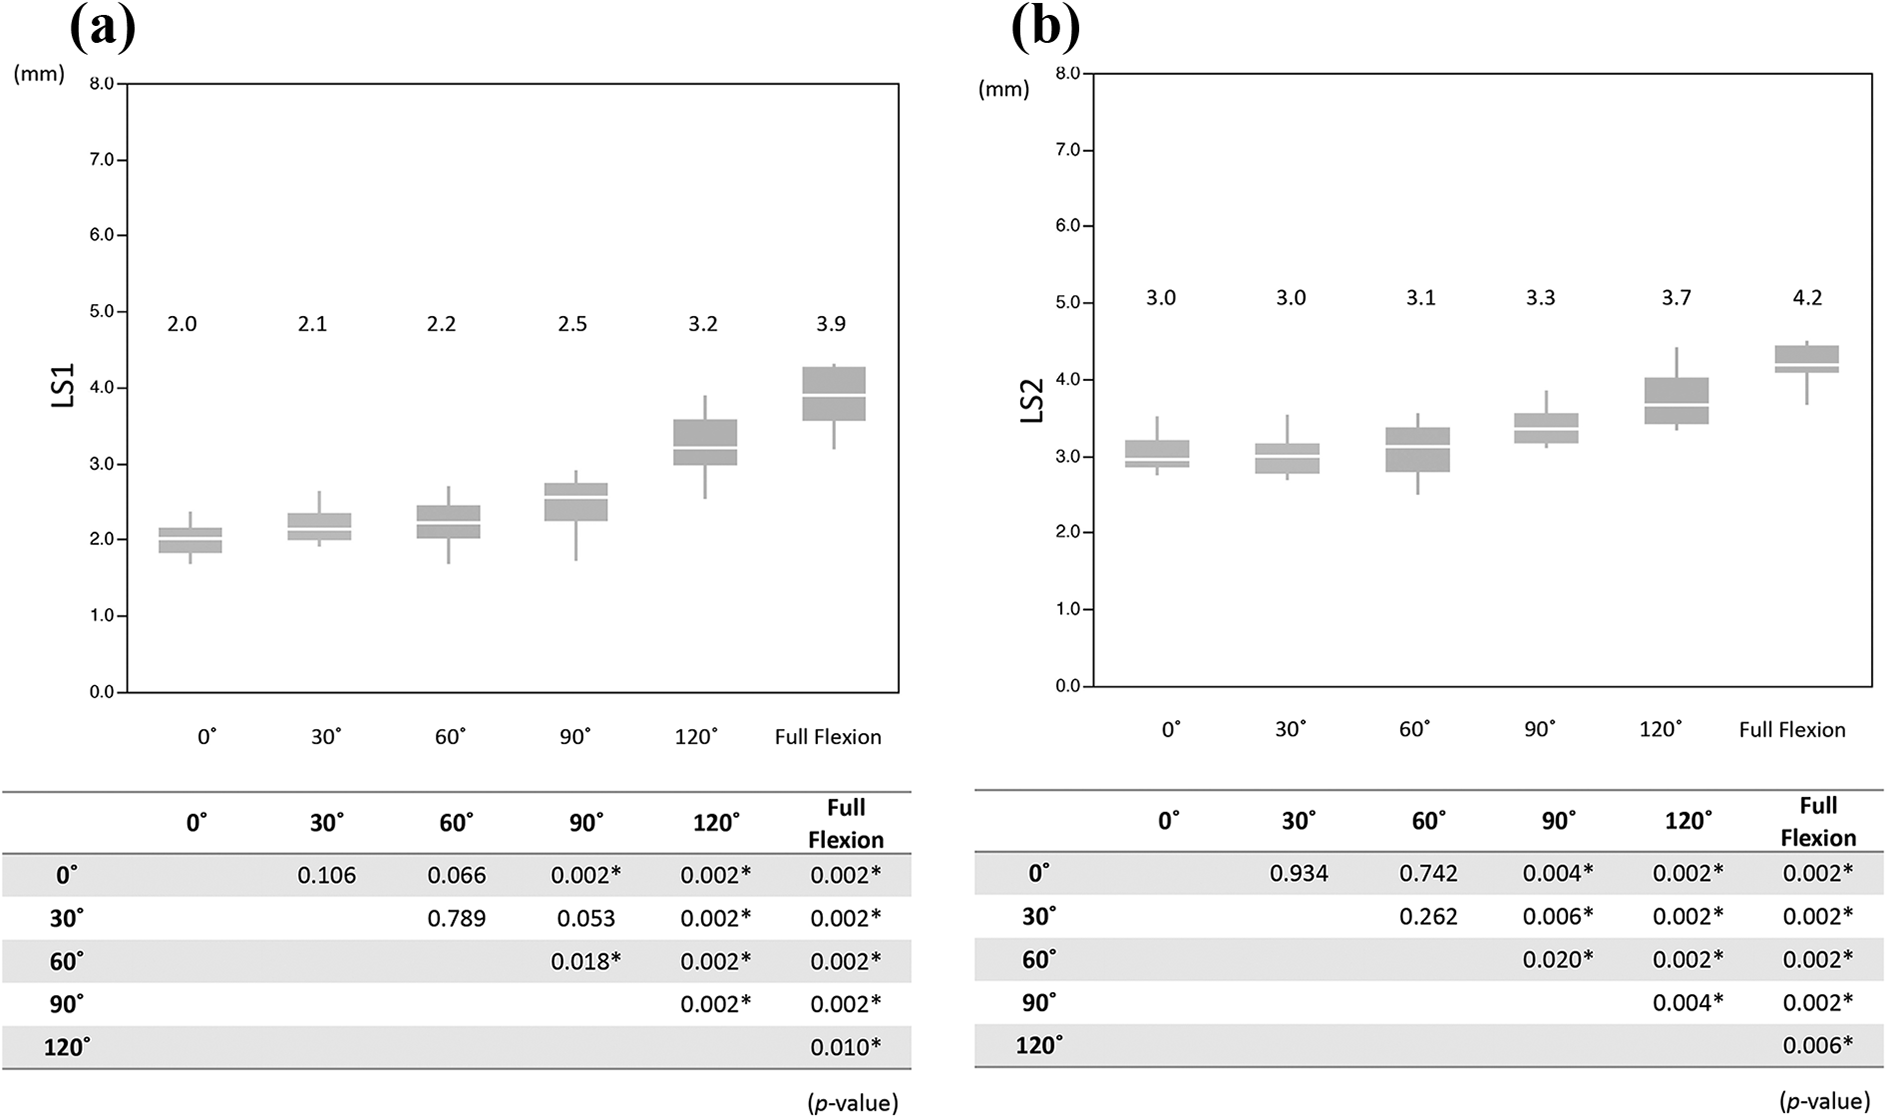
Comparison of LS1 and LS2 between each flexion angle: (a) LS1 and (b) LS2.
Positional relationship between MM and MFC
There was no statistically significant relationship between MS1 and MFT at any flexion angle. A statistically significant relationship was observed between MS2 and MFT in all but 60° flexion (Table 1).
Positional relationship between the meniscus and the femoral condyle (Spearman’s rank-order correlation).

MFT, LFT: distance from the tangent passing through the most anterior edge of the tibial tuberosity to the medial and lateral femorotibial cartilage contact point; MS1, LS1: distance from the tibial tuberosity to the posterior edge of the anterior horn of the medial and lateral menisci, respectively; MS2, LS2: distance from the TT to the anterior edge of the posterior horn of the medial and lateral menisci, respectively.
* Significant relationship.
† Spearman’s correlation coefficient.
Positional relationship between LM and LFC
A statistically significant relationship was observed at flexion angles of 90° or less between LS1 and LFT, and at 60°, 90°, and full flexion between LS2 and LFT (Table 1).
Reliability of measurements
The intraclass correlation coefficients (case 2: rater 1 vs rater 2) for measurements of MS1 and LS1, MS2 and LS2, and MFT and LFT were 0.99/0.99, 0.89/0.96, and 0.97/0.99, respectively; whereas, intraclass correlation coefficients (case 1: first vs second measurement) for rater 1 of MS1 and LS1, MS2 and LS2, and MFT and LFT were 0.96/0.99, 0.90/0.95, and 0.96/0.95, respectively. Those for rater 2 of MS1 and LS1, MS2 and LS2, and MFT and LFT were 0.97/0.98, 0.94/0.97, and 0.95/0.98, respectively. Reliability between the two independent observers was determined to be excellent, as was the reliability between their first and second measurements.
Discussion
We analyzed the meniscal and femorotibial kinematics during full knee ROM under non-weight-bearing conditions in normal adult volunteers using a compact MRI scanner. In most previous MRI studies of the meniscal kinematics in vivo, knee ROM has been limited to 0°–90° of flexion. 12,13 Previous kinematic studies have reported medial pivot, in which the femur rotates externally around the medial condyle of the tibia. 15 –21 Tanifuji et al. performed 3D motion analysis and observed medial pivot motion when knee flexion angle was between 0° and 120°. At angles greater than 120°, the MFC moved posteriorly, i.e. roll-back motion. 21 In the present study, MFC showed no significant movement through the full range of knee flexion but there was significant posterior movement of the LFC, especially in angles of flexion of 60° or more (Figure 4(a) and (b)). Although medial pivot motion was demonstrated in the current study, no roll-back motion of the MFC in deeper flexion was observed, which can be explained as follows. When the subject sat on their heels and inserted their fully flexed knee into the MRI bore, posterior drawer force was applied to the proximal tibia from the bore edge of the MRI scanner, blocking physiological roll-back motion of the MFC.
In terms of meniscal kinematics, previous MRI studies have reported that the menisci moved posteriorly with increasing knee flexion. 11 –14 Hamamoto et al. 14 reported that the mean posterior movement of MM and LM were 8.9–16.8 mm and 13.2–16.0 mm, respectively, in 20 living knees during non-weight-bearing in full ROM. Whereas, Thompson et al. 11 reported that the mean posterior movement were 3.2–7.0 mm in MM and 9.6–12.8 mm in LM in five cadaveric knees under non-weight-bearing conditions with full ROM. Vedi et al. 12 and Kawahara et al. 13 also used MRI to examine meniscal kinematics, but ROM examined in these studies was only from 0° to 90°. All of these studies reported greater movement of the LM than the MM. In the present study, the MM and LM motion patterns were analogous to those of the corresponding femoral condyles. In terms of positional relationship between the menisci and the femoral condyles, statistically significant positional consistency was observed except for the anterior horn of the medial meniscus (Table 1).
This finding indicates that the kinematics of the meniscus are regulated by those of the femoral condyle. The pivot motion of the medial femoral condyle enabled greater posterior movement of the lateral meniscus. In contrast, the medial meniscus was less mobile because of the pivotal function of the medial femoral condyle. With regard to the load-bearing function of the meniscus, Ahmed and Burke 2 and Thambyah et al. 9 reported that load transfer on the meniscus increases due to higher contact pressure at deeper flexion angles. The contact area between the meniscus and the femoral condyle expands with increasing knee flexion. 10 As the knee flexes, the meniscus bears weight in the posterior direction and thus shows posterior movement, which explains why meniscal kinematics follow femorotibial kinematics (e.g., medial pivot motion).
We overcame the structural limitations of conventional clinical MRI scanners by using a compact MRI scanner with open structure to evaluate the kinematics of both menisci in the full knee ROM. However, limitations of the present study include the following: the small number of subjects, not reproducing physiological continuous knee motion or physiological roll-back motion, not conducting testing under weight-bearing conditions, and image quality of the low-field (0.2 T) open scanner lower than that of conventional MRI. Further study is necessary to obtain more physiological information regarding meniscal kinematics.
Conclusions
Meniscal kinematics in the full ROM were evaluated using a compact MRI scanner with open structure. Positional consistency was observed between the menisci and the MFC/LFC except for the anterior horn of the medial meniscus. The motion patterns of the medial and lateral menisci were analogous to those of the MFC and LFC, respectively. Greater posterior movement of the lateral meniscus was brought about by the medial pivot motion of the femoral condyle. Meniscal kinematics closely followed femorotibial kinematics. Comprehension of meniscal kinematics is important for understanding injury mechanisms, planning meniscus transplant, and making postoperative care program for meniscus surgery.
Footnotes
Acknowledgment
The authors thank Ms M Yokoi-Hayakawa and Ms Y Imaizumi-Ohashi for their technical assistance.
Declaration of conflicting interests
The author(s) declared no potential conflicts of interest with respect to the research, authorship, and/or publication of this article.
Funding
The author(s) received no financial support for the research, authorship, and/or publication of this article.