
Abstract
Introduction:
Limb length discrepancy (LLD) of lower extremities is underdiagnosed due to compensatory mechanisms during locomotion. The natural course of compensation leads to biomechanical alteration in human musculoskeletal system leading to adverse effects. General consensus accepts LLD more than 2 cm as significant to cause biomechanical alteration. No studies were conducted correlating height and lower extremities true length (TL) to signify LLD. Examining significant LLD in relation to height and TL using dynamic gait analysis with primary focus on kinematics and secondary focus on kinetics would provide an objective evaluation method.
Methodology:
Forty participants with no evidence of LLD were recruited. Height and TL were measured. Reflective markers were attached at specific points in lower extremity and subjects walked in gait lab at a self-selected normal walking pace with artificial LLDs of 0, 1, 2, 3, and 4 cm simulated using shoe raise. Accommodation period of 30 min was given. Infrared cameras were used to capture the motion. Primary kinematic (knee flexion and pelvic obliquity (PO)) and secondary kinetic (ground reaction force (GRF)) were measured at right heel strike and left heel strike. Functional adaptation was analyzed and the postulated predictor indices (PIs) were used as a screening tool using height, LLD, and TL to notify significance.
Results:
There was a significant knee flexion component seen in height category of less than 170 cm. There was significant difference between LLD 3 cm and 4 cm. No significant changes were seen in PO and GRF. PIs of LLD/height and LLD/TL were analyzed using receiver operating characteristic curve. LLD/height as a PI with value of 1.75 was determined with specificity of 80% and sensitivity of 76%.
Conclusion:
A height of less than 170 cm has significant changes in relation to LLD. PI using LLD/height appears to be a promising tool to identify patients at risk.
Introduction
Three to fifteen percent of a given population have limb length discrepancy (LLD) and are underdiagnosed. 1 Patients eventually develop a compensatory mechanism involving the kinematics of joint, repositioning of bone, and changes in lower limb attitude during course of time as an adaptation process. 2 Several complications may arise as a result of LLD, for example, lower back pain, 3 scoliosis, hip and knee osteoarthritis, 1 plantar fasciitis, ankle and foot pain, and pressure sore. 4 –6 Studies have shown that LLD has its effect on kinematics and biomechanics of the skeletal system and gait. 7
Current consensus suggests the discrepancy does not reach significant level until approximately 2 cm of LLD. 8,9 In addition to this, it was supported by Kaufman et al. who mentioned LLD of more than 20 mm leads to gait asymmetry. 8 An epidemiological study back in 1991 further reinforced the significance of the 20 mm LLD. 10 Despite the census, McCaw and Bates reported the following classification: mild defined as LLD less than 3 cm, moderate defined as LLD between 3 cm and 6 cm, and severe defined as LLD more than 6 cm. 11 Significant LLD leading to complications is still being debated upon. 12 A simple example is, LLD of 2 cm might not be significant for a male of 180 cm but might be significant for a male of 150 cm. There are not many studies done to prove this fact. However, arbitration and controversies persist till date regarding significant level for LLD, as there is a vast difference between functional and anatomical values. Functional assessment is gaining more popularity compared to anatomical value currently. Therefore, the focus of our study was on formulating a predictor index (PI) proven via functional assessment that can be used easily by everyone.
LLD can be measured anatomically 13,14 and functionally via dynamic gait assessment. 15 Functional assessment carries more weightage and valid outcome when tested as it provides the whole-body compensatory mechanism to be observed and tested. Hence the ideal discrepancy must be individualized based on height to decide whether intervention is justified for the patient.
The aim of this study was to determine the relationship between height and true length (TL) of the limb to functional outcome of significant LLD concerning kinetic and kinematic components in human locomotion via gait assessment.
A PI was formulated and evaluated via functional assessment. This index can be used as a screening tool to determine functional outcome as superior assessment tool to anatomical discrepancies. This objective assessment of LLD will help identify patients where early intervention and treatment can be justified.
Materials and methods
Forty right foot-dominant 16 male subjects with no LLD or history of trauma to lower limbs were recruited. Subjects screened via the inclusion criteria were recruited in this study. Inclusion criteria were as follows:
– Normal healthy subjects between 20 years and 40 years 17 with no cognitive impairment.
– No previous history of central nervous system injuries, lower limb, pelvis, and spine fractures. 18
– Dominant right foot 16 (subjects were screened using a questionnaire). 19
– No preexisting LLD. 18
Professional athletes and bodybuilders were excluded from the study. 20 Height range was 155–185 cm and were categorized into less than 1.70 m, 1.70–1.74 m, and 1.75 m and above based on statistical analysis of our data. There is conflicting literature on the average height of men and majority are region or ethnic based. Malaysia is a multiethnic country and the average height of South Asian men is 167 cm. 21 These ranges were chosen to obtain adequate number of samples for comparison purposes. This is a dynamic study looking into multiple parameters and range rather than a specific cutoff point.
A pilot study was performed to determine the maximum tolerable discrepancy. Above 4 cm discrepancy, the subjects complained of foot pain and instability, therefore discrepancies from 1 cm to 4 cm were chosen (Figure 1). Height and TL of the limb 22 were measured using standardized tool. In this study, the right lower limb was standardized as the longer limb and the left lower limb as the shorter limb. Adding the desired shoe raise to the right lower limb simulated the discrepancy.

Shoe raise with different heights.
Gait lab setup
The gait lab was set up with Qualisys (Sweden) cameras (Oqus® and Miqus), passive spherical markers, calibration kit, and software that consisted of nine cameras to cover a capture volume of at least 4 × 1.5 × 2 m3 (length × width × height). The Oqus 5+ (Qualisys) provided the right combination of speed (up to 180 Hz) and resolution (4 MP). The path was covered with polyvinyl chloride mat, preventing subjects to visualize the force plate, thus avoiding bias steps. The signals were captured via Oqus infrared cameras (Qualisys) and relayed via Oqus 3D motion capture system (Qualisys) on computer. Qualisys Track Manager software was used to handle motion capture process.
The gait was reexamined in slow motion and gait specific points, namely right heel strike and left heel strike, were recorded via video replay. Kinematic (knee flexion, pelvic obliquity (PO)) and kinetic component readings were calculated at each point of heel strike. The results were projected via gait report.
Reflective markers were attached to subjects following modified Helen Hayes model (Figure 2). 23,24 Artificial shortening of a limb was created by inserting shoe raise over the contralateral limb. Each subject was given 30 min to adjust to the LLD before walking in the gait lab. Every subject repeated the walk for each discrepancy of 0, 1, 2, 3, and 4 cm and was not aware of the height increment. For each LLD, the subject was required to perform a minimum of 3 trials and was given an average number of 5–15 trials per LLD. Average duration given to each subject was 4–6 h for completion. It was ensured that there were no gross discrepancies between the trials, if not the test was repeated. Discrepancies can be due to technical errors, for example, receptive marker positioning, subject tripping, or falling. Average values of three trials were deemed conclusive because the design of this experiment is dynamic at selected time of motion, hence a single trial would not be accurate.

Reflective markers attached to the subject following modified Helen Hayes model.
Formulation of PI
Several factors play a role in determining the extent of compensation experienced by a patient with LLD. However, the human body can compensate via kinetic and kinematic components and allow normal locomotion without affecting the musculoskeletal system. The end effect of functional outcome despite many contributing factors is the subject of interest.
Much has been reported and analyzed about anatomical discrepancies. Debates are still ongoing about the extent of significant LLD. Functional outcome is a practical method to assess a subject’s capability to compensate and function optimally without ill effects in short or long term. A subject with LLD is better to be described, assessed, and analyzed functionally rather than traditional anatomical assessment.
Functional assessment involves both kinetic and kinematic component and is best analyzed dynamically. Based on these facts, formulation of a PI to determine functional outcome of a subject is proposed here.
The proposed PIs were height and TL based. Both proposed formulas were analyzed independently with kinetic and kinematic factors for significance. Significance was established via Spearman’s correlation test with kinematic components.
The formulated PIs using LLD, height, and TL were tested using receiver operating characteristic (ROC) curve. Analysis via ROC curve enabled to determine a significant value, which determined the group at risk based on the calculated formula. Significance was found in kinematic component of knee flexion. The proposed formulas of LLD/height and LLD/TL were analyzed separately using ROC curve. Specificity and sensitivity were delineated to determine the PI value.
The concept of PI was formulated as a screening tool in clinical practice to identify high-risk groups.
Two indices were computed as follows (Figure 3):
– PI 1: LLD (cm)/height (m).
– PI 2: LLD (cm)/TL (m).

PI formulas 1 and 2. PI: predictor index.
LLD in this case was considered as a fixed factor. Height and TL were considered as varying factors. The proposed PI 1 and 2 were tested for longer limb and shorter limb knee flexion, PO, and ground reaction force (GRF) independently.
During a gait cycle, the knee flexion varies between phases of a gait. The knee flexion value of our interest is the artificially longer limb and the contralateral shorter limb as a result of shoes raise. The point of study is upon heel strike of the artificial longer limb and shorter contralateral limb.
During a gait cycle, PO varies between phases of a gait. The PO value of our interest was in reference to the artificial longer limb and the resultant shorter limb. The point of study was upon heel strike of the artificially longer limb and shorter contralateral limb.
Approval from the institutional review board (201511-1847) was obtained and ethical guidelines were followed. An informed consent prior to the initiation of the study was taken.
Test of normality was conducted for each component using Shapiro–Wilk test. Parametric data were analyzed using one-way analysis of variance (ANOVA). For nonparametric data, Kruskal–Wallis test was used. Statistical analysis was done with SPSS® version 20 (IBM, Armonk, New York, USA). For statistical significance, p value of <0.05 was taken. Data were mainly presented as average values with standard deviation.
Results
All subjects were Asian male with a mean height of 1.71 m and a range of 1.62–1.85 m. Majority (22.5%) of the subjects fell between 1.70 m and 1.74 m. The kinematics considered in this study was knee flexion and PO.
Knee flexion
The distribution of knee flexion of longer and shorter limb on heel strike is summarized in Table 1.
Distribution of knee flexion.

Height category less than 1.70 m
The distributions of longer and shorter limb knee flexion upon heel strike for height group less than 1.70 m are shown in Figure 4. For longer limb, Kruskal–Wallis analysis shows p < 0.001. Therefore, each LLD for the height category of less than 1.70 m was analyzed using Mann–Whitney U test. Via this analysis, there is a significant difference in longer limb knee flexion between LLD 4 compared to LLD 0, 1, and 2. There is also a significant difference in knee flexion between LLD 3 compared to LLD 0, 1, and 2. However, no significant difference was noted comparing LLD 3 cm and LLD 4 cm.

The distribution of limb knee flexion on heel strike according to height categories.
For shorter limb knee flexion using Kruskal–Wallis analysis, p = 0.410 (not significant).
Height category of 1.70–1.74 m
The distributions of longer and shorter limb knee flexion upon heel strike for height 1.70–1.74 m are shown in Figure 4.
For longer limb using Kruskal–Wallis analysis, p = 0.199. For shorter limb using Kruskal–Wallis test, p = 0.428. Thus, there is no significant difference in knee flexion by LLD for subjects in the height category of 1.70–1.74 m.
Height category 1.75 m and above
The distributions of longer and shorter limb knee flexion upon heel strike for height 1.75 m and above are shown in Figure 4. For lengthened limb, Kruskal–Wallis analysis shows p = 0.090. For shorter limb using Kruskal–Wallis test, p = 0.672. Thus, there is no significant difference in knee flexion at heel strike by LLD for subjects in the height category of 1.75 and above. Based on the results it can be shown that LLD affects knee flexion in shorter individuals.
Pelvic obliquity
The distribution of PO on heel strike is summarized in Table 2.
Distribution of PO.
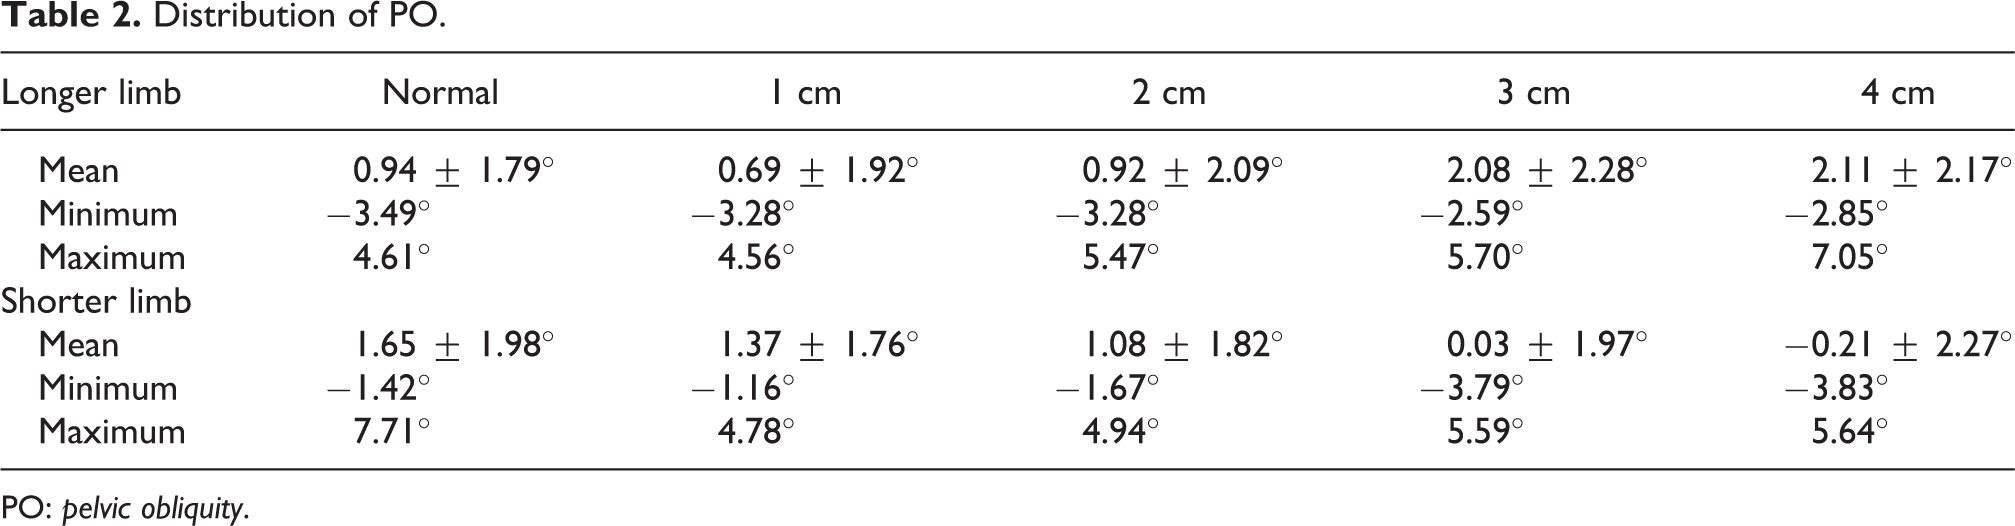
PO: pelvic obliquity.
Height category of less than 1.70 m
The distribution of PO at longer and shorter limb heel strike for height shorter than 1.70 m is shown in Figure 5.
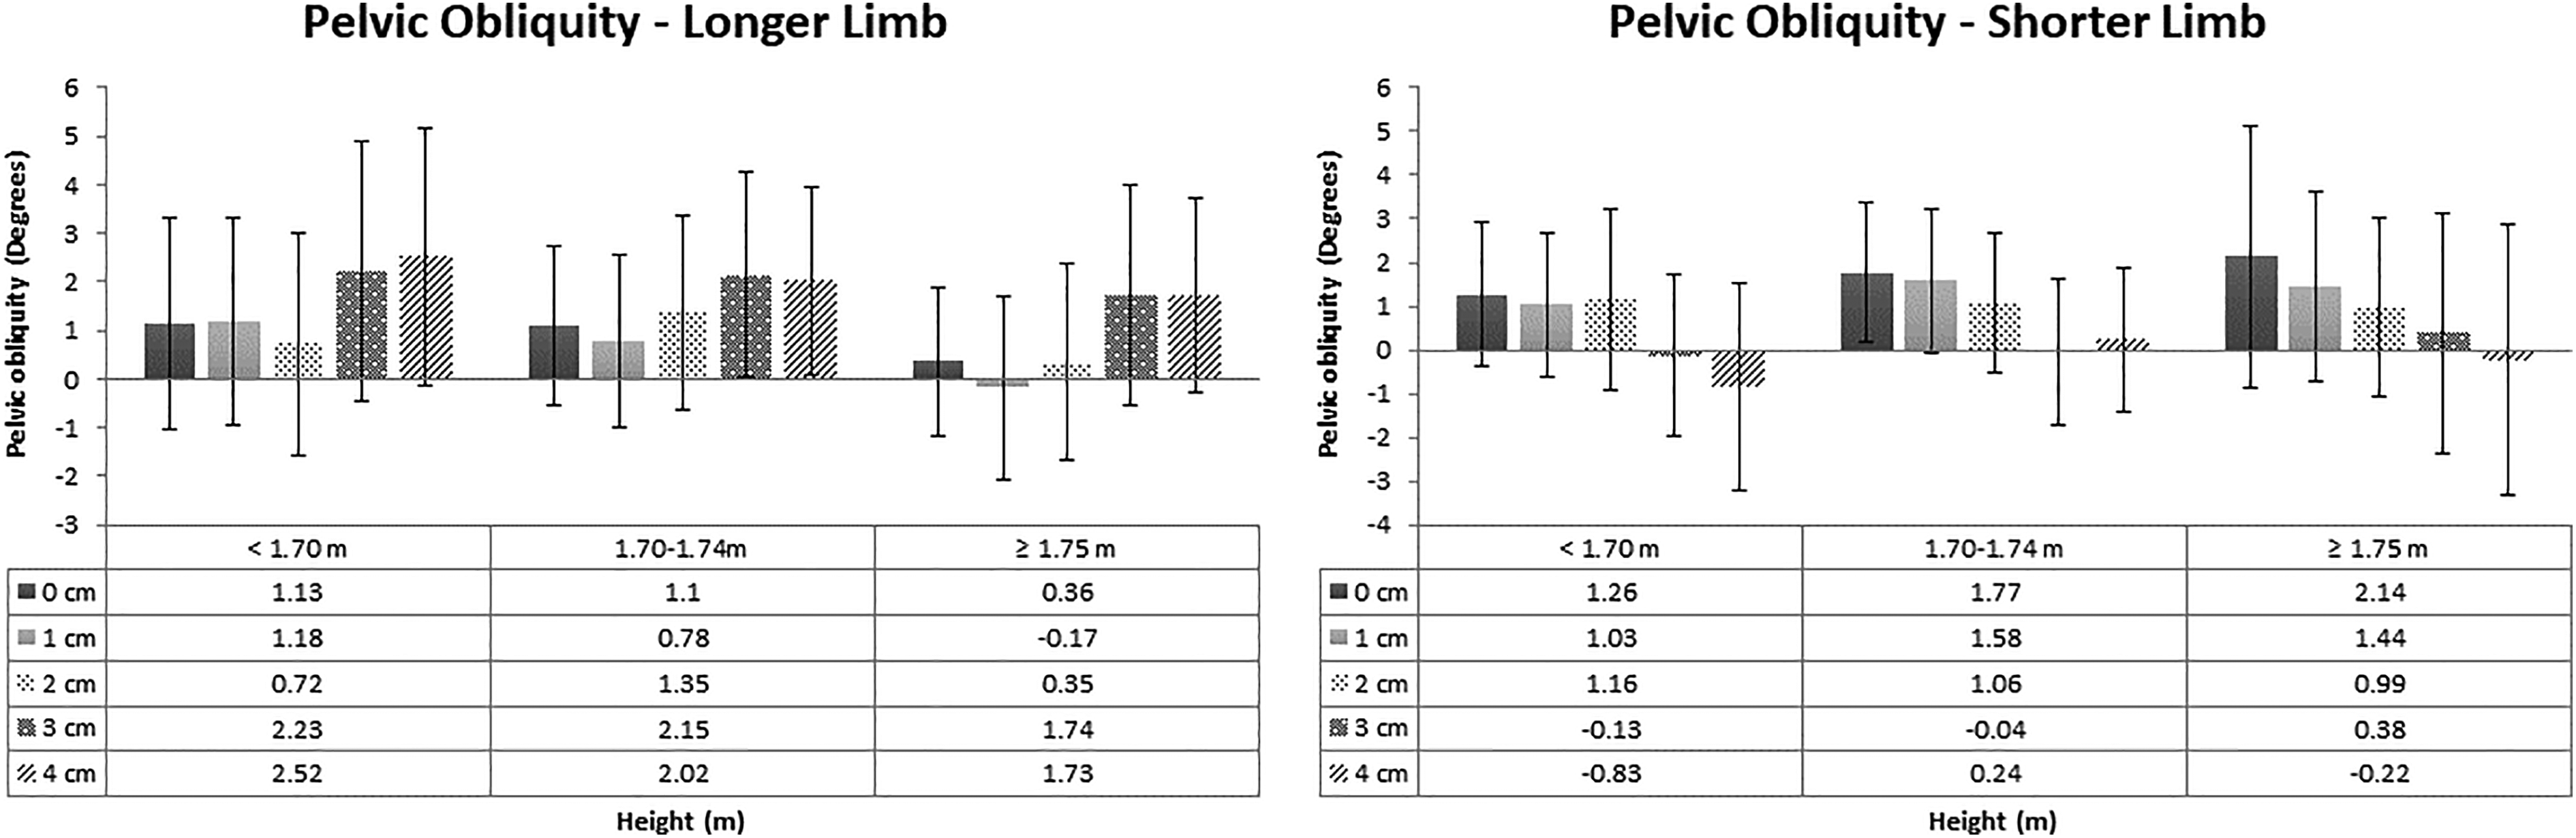
The distribution of PO on heel strike according to height categories. PO: pelvic obliquity.
For longer limb using one-way ANOVA, p = 0.261. For shorter limb using one-way ANOVA, p = 0.026. Following significant difference, a Bonferroni post hoc test was conducted for each LLD in this group and showed no significant difference.
Height category of 1.70–1.74 m
The distribution of PO at longer and shorter limb heel strike for height 1.70–1.74 m is shown in Figure 5.
For longer limb using one-way ANOVA, p = 0.149. For shorter limb using one-way ANOVA, p = 0.005. Post hoc test showed a significant difference in PO at shortened limb heel strike and 3 cm shortening, however this may not be representative as in 4 cm shortening it was not significant.
Height category of 1.75 m and above
The distribution of PO at longer and shorter limb heel strike for height 1.75 m and above is shown in Figure 5.
For longer limb using one-way ANOVA, p = 0.145. For shorter limb using one-way ANOVA, p = 0.379.
Kinetics
Kinetic component that was selected is GRF.
Height category of less than 1.70 m
The distribution of GRF at longer and shorter limb heel strike for height less than 1.70 m is shown in Figure 6.

The distribution of GRF at longer and shorter limbs on heel strike according to height categories. GRF: ground reaction force.
For longer limb using one-way ANOVA, p = 0.815 (not significant). For shorter limb using one-way ANOVA, p = 0.952.
Height category of 1.70–1.74 m
The distribution of GRF at longer and shorter limb heel strike by LLD for height 1.70–1.74 m is shown in Figure 5.
For longer limb using Kruskal–Wallis test, p = 0.969. For shorter limb using one-way ANOVA, p = 0.990.
Height category of 1.75 m and above
The distribution of GRF at longer and shorter limb heel strike for height 1.75 m and above is shown in Figure 6.
For longer limb using Kruskal–Wallis test, p = 0.999. For shorter limb using Kruskal–Wallis test, p = 0.980. Significance was established between height and functional outcome based on kinetic and kinematic components. Significance was demonstrated in longer limb group for knee flexion and shorter limb group for PO. This enabled formulation of a PI based on height and TL of the patient.
PI as a screening tool
Analysis of PI 1: LLD/height to kinematic and kinetic components are in Table 3 and PI 2: LLD/TL to kinematic and kinetic components are in Table 4. Significance was noticed in longer limb knee flexion, longer limb PO, and shorter limb PO for both formulated PIs. No significance was found for the remaining parameters. Hence both height and TL were significant in kinematic component of gait. Comparing both formulas, PI (LLD/height) was superior statistically to PI (LLD/TL) as the correlation coefficient was higher.
Spearman’s correlation test for PI 1: LLD/height.
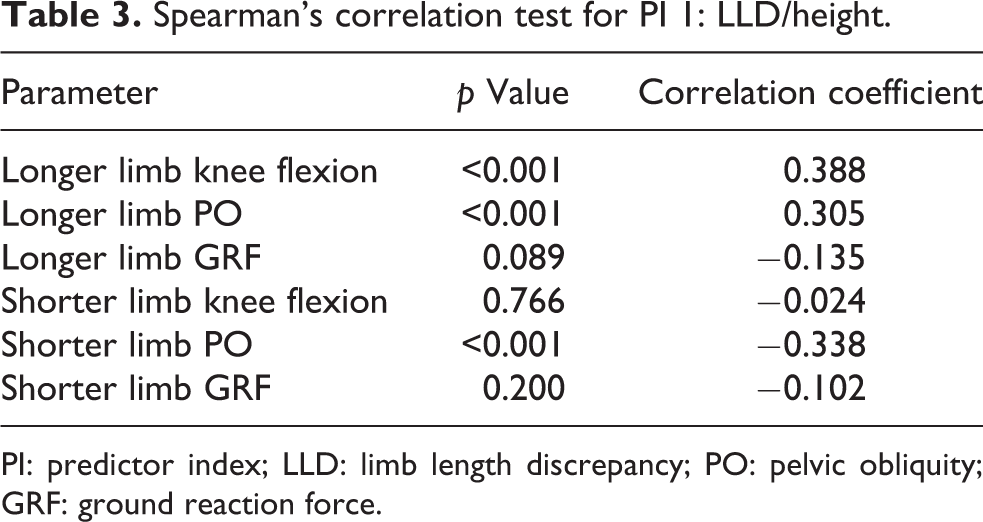
PI: predictor index; LLD: limb length discrepancy; PO: pelvic obliquity; GRF: ground reaction force.
Spearman’s correlation test for PI 2: LLD/TL.

PI: predictor index; LLD: limb length discrepancy; TL: total length; PO: pelvic obliquity; GRF: ground reaction force.
Further statistical analysis for PI (LLD/height) showed area under the curve (C = 0.828) with SE = 0.040 and 95% confidence interval (CI) from 0.749 to 0.906. ROC curve showed LLD/height as a good indicator to anticipate excessive knee flexion in a subject with LLD (Figure 7). Cutoff point for knee flexion was determined at PI of 1.75 m. Sensitivity at this point was 0.80 and specificity at 0.75.

ROC curve for LLD/height and LLD/TL. LLD: limb length discrepancy; TL: true length; ROC: receiver operating characteristic.
Further statistical analysis for PI (LLD/TL) showed area under the curve (C = 0.825) with SE = 0.040 and 95% CI from 0.746 to 0.904. ROC curve shows LLD/TL as a good indicator to anticipate possibility of excessive knee flexion in a subject with LLD (Figure 7). Cutoff point for knee flexion was determined at PI 3.6. Sensitivity at this point was 0.80 and specificity at 0.75.
As a screening tool the ideal ultimate expectation would be highly sensitive and specific PI. However, this is not possible as many factors and variations are involved. Both proposed PIs are significant and demonstrate good outcome via ROC curve. Both indices had sensitivity of 80% and specificity of 76%. Area under ROC curve (AUROCC) for LLD/height was 0.828 and LLD/TL was 0.825. A higher AUROCC is superior in determining suitable PI with higher sensitivity and specificity. The AUROCC for LLD/height is higher than LLD/TL. Hence based on the analysis, the most suitable formula of PI is LLD/height.
Analysis of PO with PI demonstrated significance. However, when these were analyzed for suitable PI via ROC curve, the outcome was poor and therefore not a suitable predictor of PI. In contrast, no significance was demonstrated between GRF and PI.
Discussion
Clinical gait analysis is now recognized as a clinically useful tool and it is financially reimbursable for some medical conditions. Compensatory mechanisms during walking include a complex combination of kinematic changes at multiple joints. These changes are best analyzed with dynamic analysis. 2,25 A static examination can only document anatomic deformity; it does not take into account the changes compensated by functional adaptations. To discriminate between functional and structural LLD, an analysis of the patient’s gait is deemed important. Dynamic gait analysis can discriminate between functional and structural LLD and provide helpful information regarding treatment. It can also be used to evaluate the effectiveness of shoe lifts and limb equalization procedures. Further, kinematic and kinetic studies can be used to gain insight into the compensatory mechanisms that minimize the effects of limb length inequality. 8
There were no studies done previously to review or establish interdependency of patient’s height or TL of lower extremities to LLD. This study establishes the relationship between height, PI, and LLD pertaining to knee flexion, which was found to be significant. Large LLD is found to affect knee flexion of the longer limb and places the shorter limb in extension. 2 Compensatory mechanisms for shorter limb include increasing PO, increasing knee extension, vaulting, toe walking, or any of these combinations. 8 In this study, the artificially lengthened limb demonstrated significant knee flexion similar to other papers. 2,26
A preexisting knee flexion of more than 15° during heel strike will cause alteration in the ankle and hip joint subsequently, thus flexion deformity of more than 10° is considered significant. The greatest increase in patella-femoral contact pressures was observed at 30–60° flexion. 26 Based on this, interval value at 15° was taken as cutoff in this study.
No similar studies were conducted previously in relation to height concerning PO. This weak positive correlation can be explained by the compensatory mechanisms to eliminate excessive PO. It has been shown that LLD leads to PO on the frontal plane resulting in compensatory, nonstructural, and nonprogressive scoliosis. 27 A PO which is also known as lateral tilt on frontal plane of more than 2° signals the need for further examination to delineate LLD. 28 Most dynamic gait assessment showed a range of 5–7° of maximum PO as part of normal gait. 29 However, there was no correlation with height demonstrated in these studies. Patients with long-standing LLD with excessive PO and compensatory scoliosis demonstrated abnormal radiologic findings compared to controls including wedging of the fifth lumbar vertebra, concavities of the vertebral end plates in the lumbar spine, traction spurs, and osteophytes of the vertebral bodies. 3 PO is a vital component to be considered, as excessive pelvic tilt is associated with compensatory scoliosis and may lead to long-standing effects.
A normal gait has been shown to have equal GRF for both limbs. 30 Several authors have found that LLD creates an asymmetry in GRF, with a larger GRF consistently found on the longer leg. 8,31 Vertical GRF has been proven to increase directly with body weight. 32 In addition to this, GRF has also been proven to correlate with walking speed, 33 as was demonstrated in this study.
Several factors contribute to determining the extent of compensation experienced by a patient with LLD. Despite multifactorial contributory factors, human body is able to compensate via kinetic and kinematic components and allow normal locomotion without affecting the musculoskeletal system. The end effect of functional outcome despite many contributing factors is the subject of interest. Functional assessment involves both kinetic and kinematic components and is best analyzed dynamically, thus the need for a PI. This PI would be useful in primary and secondary centers as a screening device warranting a referral to tertiary centers. This can be performed quickly without specialized expensive tools and easily demonstrable. Basic standardized measuring tape and device can be used to measure. It would in turn save time and money. Economic and social burden on the health-care system can be minimized if intervention is started early preventing unwanted side effects.
In a subject, the growth of trunk is expected to be proportional to the limb. Calculation of index becomes obvious as the volume of height is signified. Actual height measurement is superior to TL measurement for this PI as a screening tool. TL is measured for the non-pathological limb. Incidences where bilateral lower limbs are affected may yield false results pertaining to TL. This is applicable where the height is affected by pathological process over axial trunk and this can be a limitation.
Measurement of TL is technically more demanding, where the pelvis needs to be squared, and requires a trained clinical staff and incidence where bilateral lower limbs are affected may yield errors. Measurement of height is not as technically demanding and can be done by non-clinicians. We found that any LLD/height more or equal to 1.75 m is suggestive of kinematic imbalance for the given LLD, which will warrant a tertiary referral for the patient.
The limitation of this study is that all subjects underwent acute shortening and were only given 30 min to compensate. It may not reflect the actual biomechanical changes that occur in chronic shortening. This artificial shortening of the limb was created by inserting shoe raise over the contralateral limb. This may not show similar resemblance to an originally shortened limb as there might be changes with the skeletal and joint geometry. We presumed the artificial shortened limb resembles a pathological shortened limb. Acute shortening may not cause actual decompensation even though subjects were given adequate time to accommodate.
The usage of shoe and shoe raise material which may compromise the actual changes in gait could be a contributing factor too. A footwear which resembles human contour and texture would be an ideal option. But it is not readily available nor cheap. Financial constraints were apparent with the cost for using the lab facility and reflective marker. Our limitations were also in selecting participants for this study as it required a tight-fitting sportswear that enabled a higher yield of data capture. Most female participants are not comfortable in this sportswear. Reference and normative data for reference in this study were based on Western studies. Subjects involved in this study were Asian population, namely Malaysians. No normative data for Asian population were published before as a reference which can be utilized for in this study. Skeletal geometry may differ from Asian and Western population.
PI (LLD/height) can be used as a screening tool to identify group at risk of adverse effects in primary and secondary centers. Screened patients should be analyzed independently using a dynamic gait analysis to determine the level of functional adaptation before deciding the mode of intervention as numerous factors are involved in adaptation. Suggestion in future would be to test this PI in a larger number of subjects.
Conclusion
PI using LLD/height appears to be an interesting screening indicator to identify group at risk of adverse effects of LLD. However, further research is required to test PI in subjects with actual chronic shortening and also look into the anatomical location of shortening as a factor. 34
Supplemental material
Supplemental Material, Table_1S - Predictor index of functional limb length discrepancy
Supplemental Material, Table_1S for Predictor index of functional limb length discrepancy by Vivek Ajit Singh, Sasidaran Ramalingam, Amber Haseeb and Nor Faissal Bin Yasin in Journal of Orthopaedic Surgery
Supplemental material
Supplemental Material, TABLE_2S - Predictor index of functional limb length discrepancy
Supplemental Material, TABLE_2S for Predictor index of functional limb length discrepancy by Vivek Ajit Singh, Sasidaran Ramalingam, Amber Haseeb and Nor Faissal Bin Yasin in Journal of Orthopaedic Surgery
Supplemental material
Supplemental Material, TABLE_3S - Predictor index of functional limb length discrepancy
Supplemental Material, TABLE_3S for Predictor index of functional limb length discrepancy by Vivek Ajit Singh, Sasidaran Ramalingam, Amber Haseeb and Nor Faissal Bin Yasin in Journal of Orthopaedic Surgery
Footnotes
Declaration of conflicting interests
The author(s) declared no potential conflicts of interest with respect to the research, authorship, and/or publication of this article.
Funding
The author(s) received no financial support for the research, authorship, and/or publication of this article.
Supplemental material
Supplemental material for this article is available online.
References
Supplementary Material
Please find the following supplemental material available below.
For Open Access articles published under a Creative Commons License, all supplemental material carries the same license as the article it is associated with.
For non-Open Access articles published, all supplemental material carries a non-exclusive license, and permission requests for re-use of supplemental material or any part of supplemental material shall be sent directly to the copyright owner as specified in the copyright notice associated with the article.