
Abstract
Purpose:
The purpose of this study was to investigate the surgical outcomes of total hip arthroplasty (THA) through direct anterior approach (DAA) performed by beginners by comparing the outcomes after the introduction of DAA-THA between using a normal operating table and a traction table.
Methods:
The total subjects were 200 patients, there were 120 cases from the introduction of three surgeons using a normal table and 80 cases from two surgeons using a traction table. The surgical procedure was standardized, and a surgeon skilled in DAA entered the operating room and instructed the novice surgeons of DAA in all cases.
Results:
The mean operative time was no significant difference between the two groups (p = 0.093). The difference in slope of the operative time was no significant difference between the two groups (p value = 0.089). The mean fluoroscopy time and the mean blood loss were significant difference between the two groups (p < 0.05). The difference in slope of the fluoroscopy time and blood loss were significant difference between the two groups (p < 0.05). There were no intraoperative complications and no reoperations for any reason.
Conclusions:
At the facility with a surgeon skilled in DAA, the use of a traction table in DAA did not increase the complication rate compared with the use of a normal operating table when the exclusion criteria for DAA were set and surgery was performed using intraoperative fluoroscopy under supervision by a skilled surgeon.
Keywords
Introduction
Total hip arthroplasty (THA) is effective for reducing hip joint pain, recovering function, and improving the Quality of Life (QOL). 1,2 There are several approaches for THA and the direct anterior approach (DAA) is capable of conserving soft tissue because it is an intermuscular approach. Accordingly, postoperative recovery is fast, which is considered to be associated with a low dislocation rate and pain reduction, and a favorable postoperative outcome can be expected. 3 –10 However, the risk of complications, such as failure of component placement and femoral fracture, was reported to be high early after the introduction of DAA for THA, and the presence of a learning curve has been pointed out. 5,11 –14
The Judet brothers used an anterior approach for hip joint arthroplasty with a traction table in 1985. 15 As the number of scrub assistants can be reduced and a reliable position can be retained using this traction table, improvement of the implant placement position, shortening of the operative time, and improvement of the postoperative outcome in THA are also expected. 5,15,16 However, complications, such as fracture during retention of the rotational position, are of concern when using a traction table, 5,17 and DAA without its introduction has been reported. 3,18 –20 Our facility introduced DAA using a normal operating table in 2009, and a traction table (LECURE®, Surgical Alliance, Tokyo, Japan) 16 has been used since 2015, aiming at shortening the operative time and intraoperative fluoroscopy time, and further improvement of the postoperative outcome.
The use of a traction table 12,16 and normal operating table 3,18 –20 for DAA during the learning curve period has been previously reported, but no study has investigated the learning curve by comparing them. We hypothesized that at a facility with a surgeon skilled in DAA, surgeons performing DAA for the first time can achieve a favorable surgical outcome without increasing the risk of complications through the use of a traction table under supervision by the skilled surgeon. The purpose of this study was to investigate the surgical outcomes of THA through DAA (DAA-THA) performed by beginners by comparing the outcomes after the introduction of DAA-THA between using a normal operating table and a traction table.
Methods
Three and two orthopedists changed the approach for THA from the posterior approach to DAA between 2013 and 2015, and after 2015, respectively. The average years of experience in orthopedic department between each groups are 8.3 (6, 8, 11 years in each: normal group) and 7.5 (6, 9 years in each: traction group) years.
The flow chart of this study is shown in Figure 1. A total of 216 patients were collected and the exclusion criteria for introduction of DAA were set as follows prior to the initiation of DAA: (1) Past medical history of osteotomy or osteosynthesis, (2) CROW grade III or IV acetabular hypoplasia, (3) markedly short femoral neck due to Perthes deformation, or (4) severe joint contracture with a 30° or smaller range of motion (ROM) of the hip joint in the sagittal view. The subjects were each 40 consecutive patients from when three orthopedists initiated DAA-THA using a normal operating table (normal group) and when two orthopedists initiated DAA-THA using a special traction table (traction group). After applying the exclusion criteria, there was a total of 200 patients.

Flow chart of this retrospective study.
Surgical procedure
Only one surgeon skilled in DAA was present at our facility at the time of this study. The surgical procedure was standardized, and one of the surgeon skilled in DAA attended to all procedures and instructed the beginner surgeons in all cases. The details are described below.
The skin incision was made an 8–10 cm. The capsular ligament anterior to the hip joint was incised in a Y-shape and inverted to expose the femoral head and neck. In general, an inclination angle of 40° and an anteversion angle of 20° were the goal for the primary cup position. For the acetabular component, a cementless cup was used in all patients. The femur was elevated by applying a single blunt hook to the femoral neck. Then, when a normal operating table was used, the bed was extended in order to extend the bilateral hip joints 15–30°. Furthermore, an assistant rotated the affected side 90° and adducted it 15° to retain the position. When a traction table was used (Figure 2(a)), the position was retained by applying external rotation, extension, and adduction only to the lower limb on the affected side by traction (Figure 2(b)). After the affected limb was removed from the traction table, a sufficient ROM and stability of the hip joint were confirmed, and a cementless stem of appropriate size was inserted. The joint capsule incised in a Y-shape was resutured and the wound was closed by suturing each layer of the incised fascia and subcutaneous tissue.
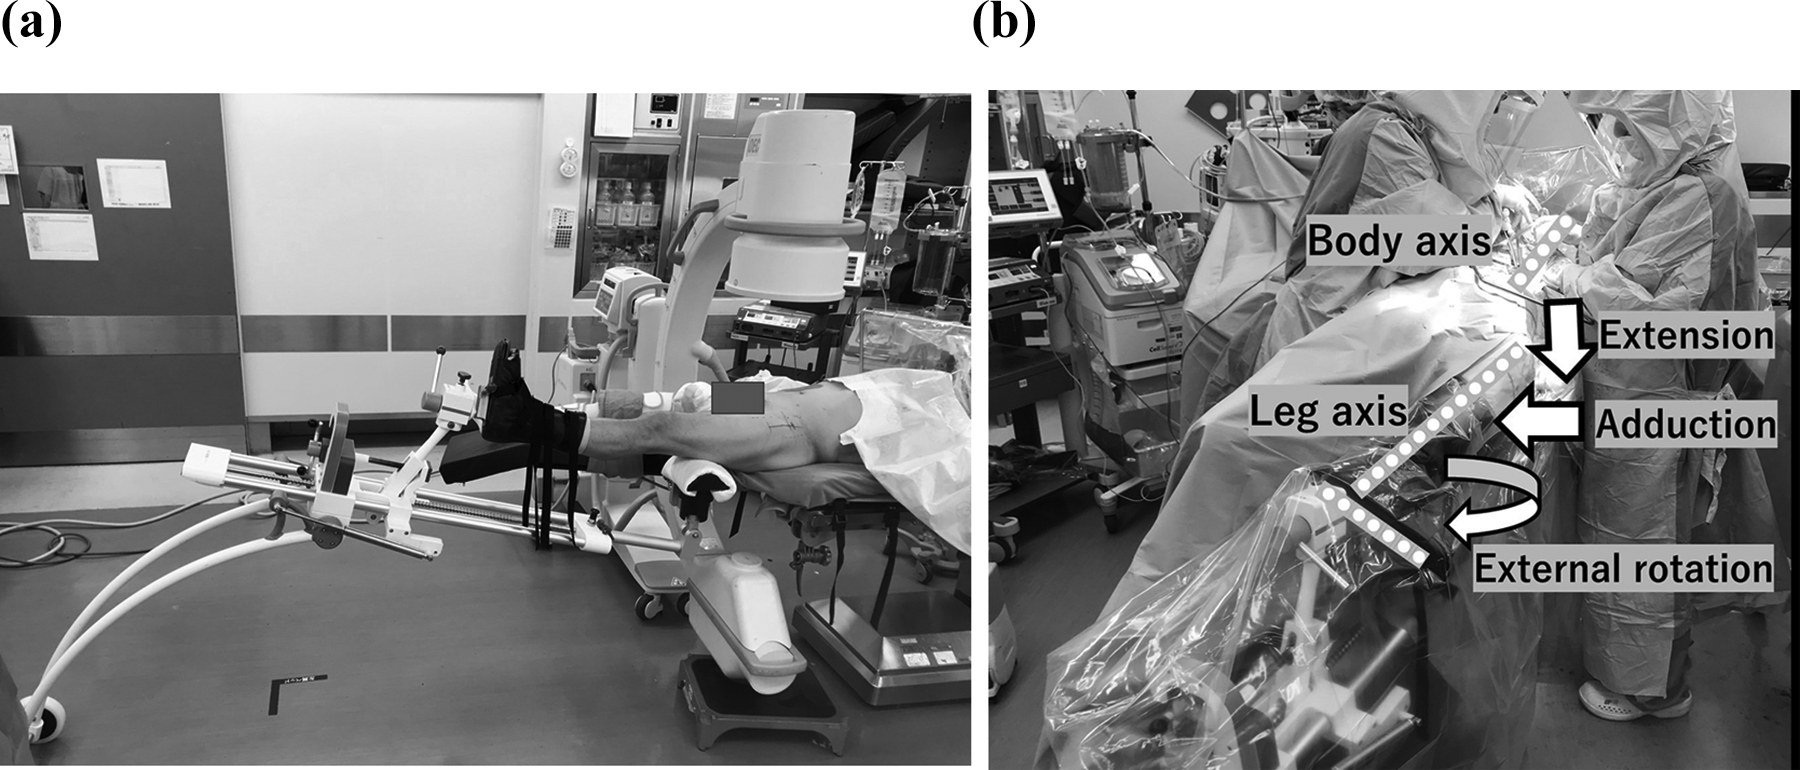
(a) Traction table (LECURE®) is easy to use the intraoperative fluoroscopy. (b) When a traction table was used, the position was retained by applying external rotation, extension, and adduction only to the lower limb on the affected side by traction.
Implants
Modern uncemented cups and proximal coated stems were used: the Trident–Accolade System (Stryker Orthopaedics, Mahwah, New Jersey, USA) in 170 hips and the G7-Taperloc Complete Microplasty system (Zimmer Biomet, Warsaw, Indiana, USA) in 30 hips.
Intraoperative fluoroscopy
Intraoperative fluoroscopy was used in all patients (Figure 2(a)). Fluoroscopy was used to confirm safety mainly at the following steps: (1) Final acetabular reaming, (2) acetabular cup placement, (3) trial stem insertion, (4) confirmation of leg length discrepancy after temporary reduction, and (5) after the final implant placement.
Postoperative program
All patients underwent gait rehabilitation with Full Weight Bearing from a day after the surgery and took edoxaban for 14 days to prevent deep vein thrombosis. They also took celecoxib for pain control.
Clinical evaluation
The operative time, intraoperative fluoroscopy time, blood loss, the presence of complications (postoperative infection, dislocation, and intraoperative postoperative fracture), and Harris hip score (HHS) of 1year after surgery in each group were retrospectively recorded. The patients had clinical and radiographic follow-up 1 month and 3 months after surgery, 1 year after surgery, and annually thereafter. The patient in these groups with the shortest follow-up period was 1 year after surgery.
Radiographic evaluation
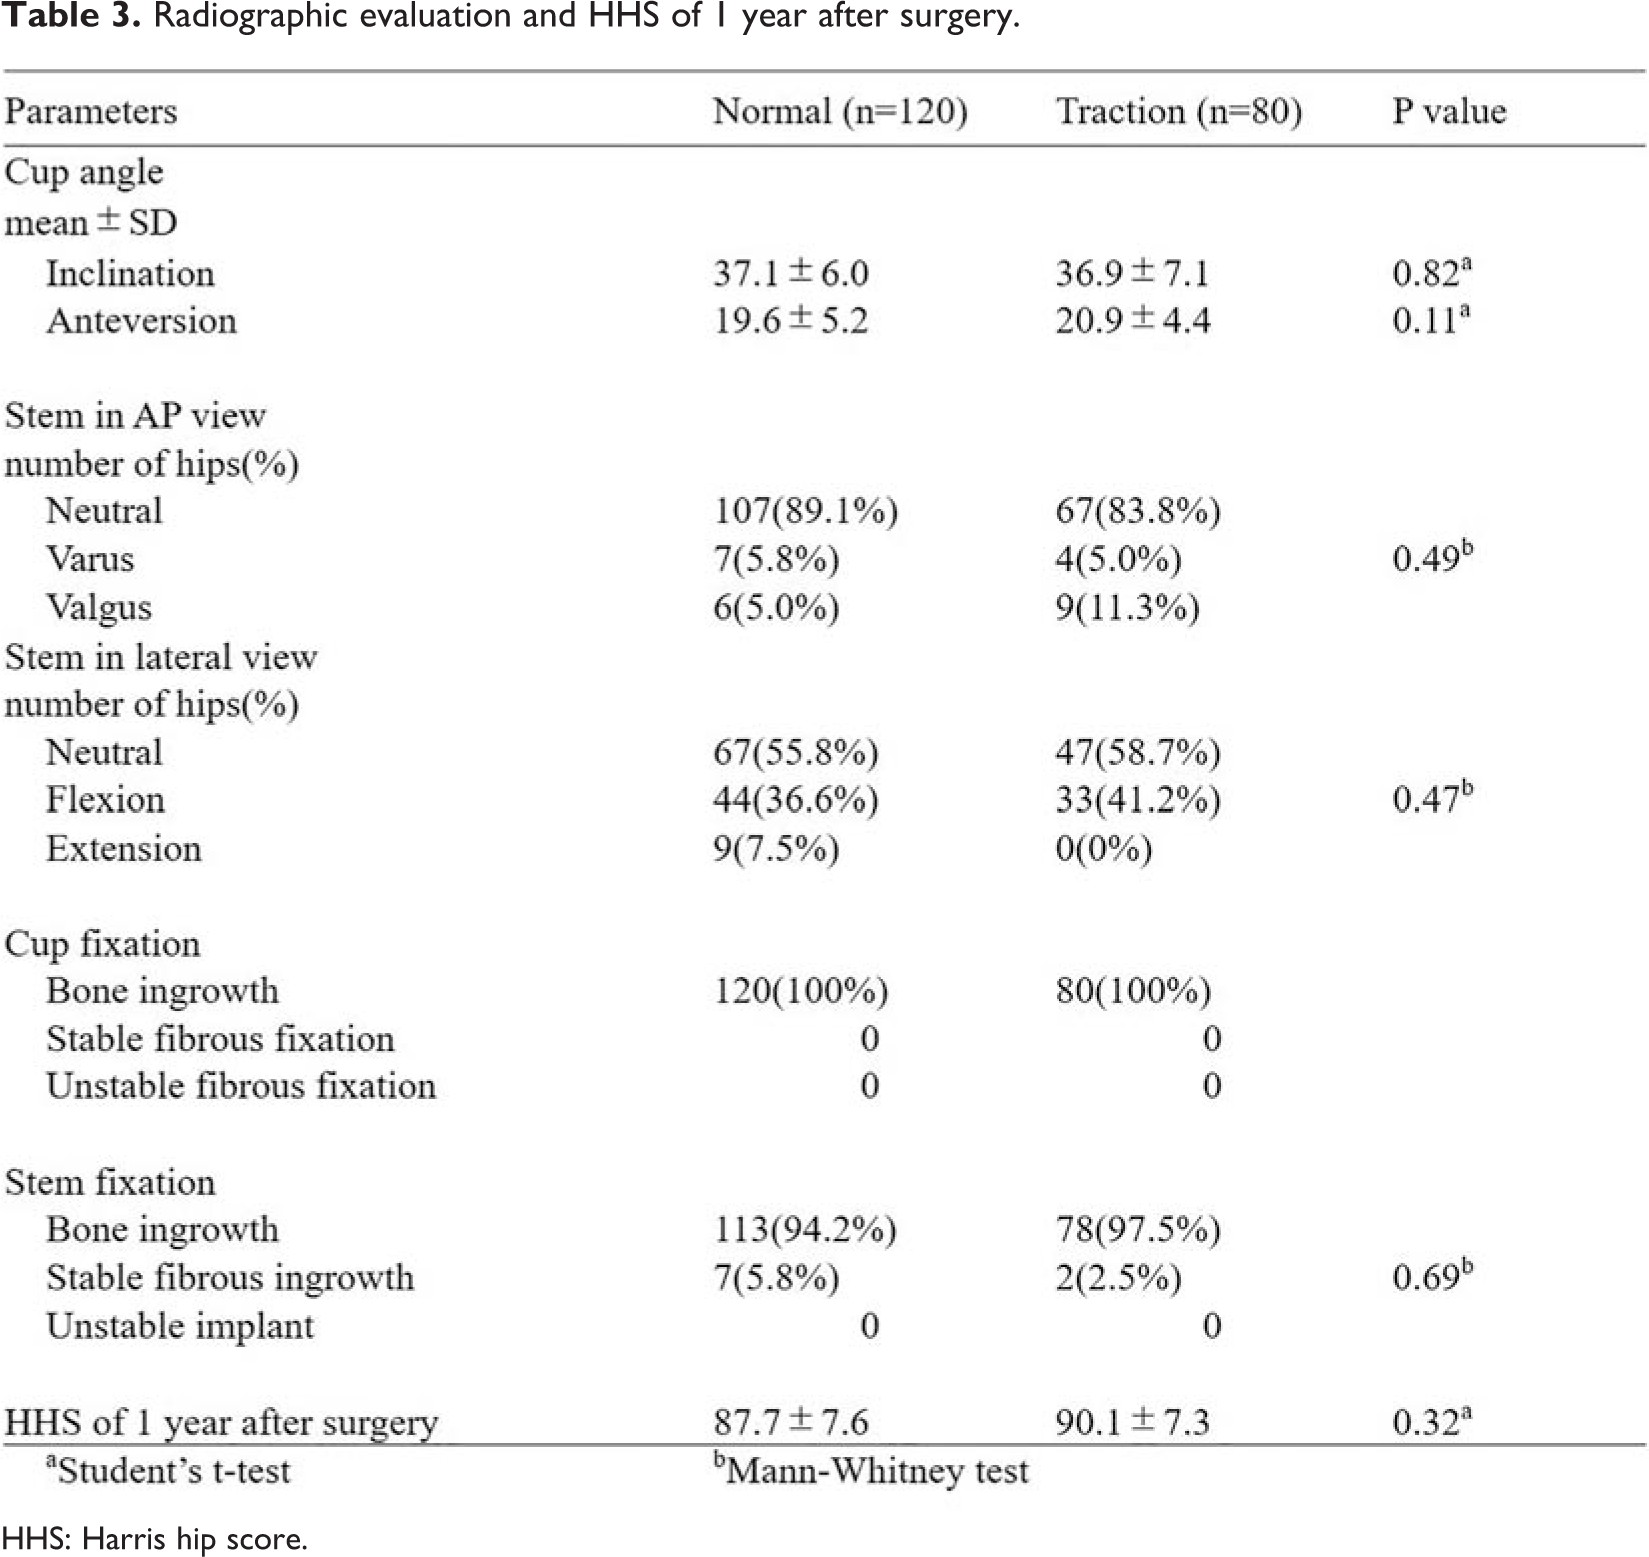
We evaluated Lauenstein and anteroposterior (AP) images in a recumbent position 8 weeks after surgery (Table 3). We used Lewinneck’s method 21 and Widmer’s method 22 to evaluate the cup inclination angle and the anteversion angle using the radiographs.
Stem alignment was evaluated via the angle formed between the long axis of the prosthesis and the long axis of the femur. 23 As previously described by Abe et al., 24 the alignment of the stem in the coronal plane was defined as neutral, valgus (≥3° medial deviation), or varus (≥3° lateral deviation). Using an X-ray profile view, the stem alignment in the sagittal plane was defined as neutral, extension (≥3° anterior deviation), or flexion (≥3° posterior deviation). The measurement was performed in a blinded fashion by TW who was not involved in the treatment. There was no difference in cup and stem position on AP and Lauenstein view between the traction and the normal group.
We evaluated radiographs of each patient 1 year after surgery to confirm cup and stem fixation (Table 3).The results of fixation of the cups were evaluated as stable bone ingrowth (radiolucency Ⅰ A: none, Ⅰ B: one zone, Ⅰ C: two zones), stable fibrous fixation (Ⅱ: complete radiolucent line < 2 mm at all zones), or unstable fibrous fixation (Ⅲ: progressive radiolucent line at zone Ⅲ, complete radiolucent line ≧ 2 mm at all zones, or cup migration) according to the radiographic classification of McPherson et al. 25
The results of fixation of the stems were evaluated as bone ingrowth (no subsidence and minimal or no radiopaque line around the stem), stable fibrous ingrowth (no progressive migration and extensive radiopaque line around the stem (<1.0 mm)), or unstable implant (progressive subsidence or migration and at least partially surrounded by divergent radiopaque line) according to the radiographic classification of Engh et al. 26
Statistical analysis
Continuous data were analyzed using nonparametric Mann–Whitney U-test and the Student’s t-test. The data grouped into categories were analyzed by the χ 2 test. In addition, to evaluate whether there was a difference in slope between the traction group and the normal group in changes over time in the operative time, fluoroscopy time, and blood loss, regarding the baseline value, group, number of measurements of operators, and interaction term between the group and number of measurements as fixed effects and operators as random effects, regression parameters of the interaction terms between the group and number of measurements, its 95% confidence interval, and p value of the regression parameters were estimated using a linear mixed model on the assumption of a random intercept. A p value <0.05 was considered significant.
Results
The patient background is shown in Table 1. Twenty-nine patients were male (normal group: 16, traction group: 13) and 171 were female (normal group: 104, traction group: 67). The mean age was 66.5 ± 11.9 years old in the normal group and 68.5 ± 12.0 years old in the traction group, the mean heights were 154.4 ± 6.3 cm and 155.0 ± 7.7 cm, respectively, the mean body weights were 56.9 ± 10.3 kg and 55.5 ± 13.0 kg, respectively, and the mean BMI was 23.8 ± 4.0 and 22.9 ± 4.5, respectively. No significant difference was noted in any of these items. The preoperative diagnosis was osteoarthritis of the hip in 162 (normal group: 101 (CROW grade I: 79, CROW grade II: 22), traction group: 61 (CROW grade I: 51, CROW grade II: 10)), rheumatoid arthritis in 3 (normal group: 1, traction group: 2), osteonecrosis of the femoral head in 23 (normal group: 16, traction group: 7), and femoral neck fracture in 12 (normal group: 2, traction group: 10). The preoperative HHS and ROM of the hip joint (flexion, abduction, adduction, internal rotation, and external rotation) were no significant difference between the two groups.
Patient characteristics and preoperative diagnosis, HHS, and ROM.


HHS: Harris hip score; ROM: range of motion.
The mean operative time was 120.6 ± 12.1 min and 114.6 ± 13.0 min in the normal and traction groups, respectively, with no significant difference between the two groups (p = 0.093) (Table 2). When the difference in slope of the operative time in the traction group was compared with that in the normal group using a linear mixed model, the estimated regression parameter of the interaction term between the group and number of measurements (95% confidence interval) was −0.4432 (−0.9492 to 0.0671) and the p value of the regression parameter was 0.089 (Figure 3(a)).
The comparison of mean operation time, mean fluoroscopy time, and blood loss volume. The mean operative time was no significant difference between the two groups (p = 0.093). The mean fluoroscopy time and the mean blood loss were significant difference between the two groups (p < 0.05).


The boldface means average of 2 groups and P values.

Time series graphs. (Thick solid line is the predicted value of normal group. Thick dotted line is the predicted value of traction group.) Each predicted value was determined from linear mixed-effects model. (a) The difference in slope of the operative time was no significant difference between the two groups (p value = 0.089). (b) The difference in slope of the fluoroscopy time was significant difference between the two groups (p < 0.05).
The mean fluoroscopy time was 1.1 ± 0.4 min and 0.7 ± 0.1 min in the normal and traction groups, respectively, demonstrating a significant difference between the two groups (p < 0.05). When the difference in slope of the fluoroscopy time in the traction group was compared with that in the normal group using a linear mixed model, the estimated regression parameter of the interaction term between the group and number of measurements (95% confidence interval) was 0.0227 (0.0065–0.0387) and the p value of the regression parameter was 0.0063 (Figure 3(b)).
The mean blood loss was 601.3 ± 129.3 mL and 397.6 ± 5.1 mL in the normal and traction groups, respectively, demonstrating a significant difference (p < 0.05). When the difference in slope of blood loss in the traction group was compared with that in the normal group using a linear mixed model, the estimated regression parameter of the interaction term between the group and number of measurements (95% confidence interval) was −5.3664 (−9.8485 to 0.9030) and the p value of the regression parameter was 0.0198 (Figure 4).

Blood loss volume graphs. (Thick solid line is the predicted value of normal group. Thick dotted line is the predicted value of traction group.) Each predicted value was determined from linear mixed-effects model. The difference in slope of the blood loss volume was significant difference between the two groups (p < 0.05).
Regarding complications, no intraoperative fracture, postoperative dislocation, postoperative infection, or reoperation due to any reason was observed in either group. The radiographic evaluation after surgery and HHS is shown in Table 3. There were no significant difference between groups regarding radiographic evaluation and HHS.
Radiographic evaluation and HHS of 1 year after surgery.

HHS: Harris hip score.
Discussion
In the early stages of DAA introduction to THA, there are reports that there is a high risk of complications such as femoral fractures and poor attachment of components, 5,11 –14 and it is pointed out that a learning curve exists. 19,20,27
The presence of a learning curve in 45% of studies has been pointed out by meta-analysis of adverse events of DAA. 17 The necessary number of surgeries to reduce the incidence of complications after introducing DAA was correlated with the experience of surgeons, and it significantly decreased after the first 40–100 procedures. 8,19,28,29 Referring to previous reports, we set the necessary number of procedures at 40 for the learning curve of DAA-THA after introduction using a normal operating table in our preceding study. 20 The number of procedures was also set at 40 in this study.
DAA is divided into methods using a normal operating table or traction table 5,7,10,12,13,16,19,28 (Table 4).
DAA is divided into methods using a normal operating table or traction table.


DAA: direct anterior approach.
The boldface values means result of total.
When the major complication rate requiring reoperation was compared between DAA using a normal operating table and using a traction table in previous studies on the DAA learning curve, the mean dislocation rate was 0.3% for DAA using a normal operating table and 1.0% for DAA using a traction table, being higher. Difficulty in assessing the ROM and stability of the hip joint is a disadvantage of DAA using a traction table compared with using a normal operating table, suggesting the association with the dislocation rate. We confirm the ROM and stability by removing the affected lower limb from the traction table after trial implant insertion. In addition, resuturing of the incised capsular ligament was standardized such that no dislocation occurred in both groups. The incidence of intraoperative fracture in previous studies was similar between the two groups. However, fracture around the ankle joint associated with the use of a traction table has been reported 5,10 and the cause was fracture when the hip joint was dislocated before osteotomy of the femoral neck. 5 We made modifications, such as the femoral head being removed after osteotomy of the femoral neck without dislocation, and when external rotation was applied to the hip joint, the operator retained the femur to prevent intraoperative fracture, including traction table-associated fracture.
Our facility had performed DAA-THA using a normal operating table. We confirmed and reported that the use of intraoperative fluoroscopy enabled accurate implant placement and surgical safety, reducing the incidence of complications such as postoperative dislocation and intraoperative fracture. 8 However, manual retention of the intraoperative hip joint position, which is important for successful stem insertion, requires an additional assistant during surgery and reproducibility of the position is poor, remaining an issue to be solved. Thus, we considered that the number of scrub assistants can be reduced and highly reproducible retention of the position is possible by the use of a traction table. And we hypothesized that shortening of the operative time and fluoroscopy time, and improvement of the postoperative outcome are possible using a traction table. Studies describing a similar effect 5,15,16 have been previously reported, but all these were single-arm studies with no comparative control. To our knowledge, there has been no study in which the DAA-THA learning curve was compared between DAA-THA using a normal operating table and a traction table employing the standardized procedure performed under the same instructor at the same facility. In our study, the operative time was slightly shorter in the traction group than in the normal group, and significant differences were noted in the fluoroscopy time and blood loss. In addition, when the difference in slope of change over time in the operative time between the normal and traction groups was investigated, the slope was negative in both groups, but no significant difference was noted. Suggesting that the effects of shortening the operative time with an increase in the number of procedures are equivalent regardless of the difference in the operating table when surgery is performed under the following conditions: establishment of exclusion criteria for DAA, use of intraoperative fluoroscopy, and attendance of a surgeon skilled in DAA as the first assistant. A significant difference was noted in the slope of change over time in the fluoroscopy time. Based on the parameter estimates, the fluoroscopy time became slightly shorter as the number of procedures increased in both groups, but the baseline fluoroscopy time was shorter and the fluoroscopy time reduction rate was smaller in the traction group than in the normal group. Thus, our study suggests that surgery can be performed with short fluoroscopy time from the beginning of introduction in the traction group. Using a traction table, the pelvis is stabilized by the perineal support and retention of the femoral position is stabilized, unlike when using a normal operating table. We presumed that the placement position can be more easily decided on a traction table because the C arm of the fluoroscopic device had to be appropriately placed in the target region at the five standardized timings, thereby affecting the fluoroscopy time.
A limitation of this study was the difference in the number of patients: 120 patients treated by three operators in the normal group and 80 patients treated by two operators in the traction group. However, comparison between DAA-THA using a normal operating table and a traction table has not previously been reported; therefore, we believe this study has sufficient value.
Conclusion
A normal operating table or a traction table was used when DAA-THA was introduced, and the outcomes, including intra- and postoperative complications, were compared between the two groups. At the facility with a surgeon skilled in DAA, the use of a traction table in DAA did not increase the complication rate compared with the use of a normal operating table when the exclusion criteria for DAA were set and surgery was performed using intraoperative fluoroscopy under supervision by a skilled surgeon.
Footnotes
Declaration of conflicting interests
The author(s) declared no potential conflicts of interest with respect to the research, authorship, and/or publication of this article.
Funding
The author(s) received no financial support for the research, authorship, and/or publication of this article.