
Abstract
Introduction:
The web version of Fracture Risk Assessment (FRAX) tool is widely used in many countries to predict the 10-year probability of major osteoporotic fracture (MF) and hip fracture (HF) rate. However, other FRAX tools, calculator older version (first generation), calculator new version (second generation), and application of mobile software had also been used in Japan.
Purpose:
The aim of this study is to investigate the consistency of results obtained from the four predicting tools for MF and HF rate in both male and female groups.
Methods:
The data were extracted from 2016 medical examination report of Japanese Ministry of Health of Labor and Welfare. The MF and HF rates were calculated from 40 to 90 years old under different risk factors using four FRAX tools while the consistency of predicting value was evaluated.
Results:
The predicted MF or HF rates were extremely similar among calculator new version, mobile software, and website version in each risk factors. On other hand, for calculator older version, the predicted MF or HF rates are a little higher than other versions. The significant difference is only present in patients aged 75 and above, and this exceeds the FRAX threshold older than 75 years old by Japanese Society for Bone and Mineral Research.
Conclusions:
The application of four FRAX tools generated consistent results in predicting the 10-year probability of major osteoporotic fracture and HF for clinical practice, which provides an effective evidence for clinical application.
Introduction
Osteoporosis is a skeletal disease characterized by low bone mass and reduced bone mineral density (BMD) with increasing risk of bone fragility and occult fracture. With the aging of the general population and prolonged life expectancy, osteoporosis has been associated with considerable morbidity and mortality in the elderly population. 1 Therefore, early screening with anti-osteoporosis treatment become even more important for the control of osteoporosis. 2 According to World Health Organization’s (WHO) classification, the osteoporosis was diagnosed by BMD value: osteoporosis was defined as T-score equal to or lower than −2.5 standard deviation (SD), osteopenia was defined as T-score lower than −1 and greater than −2.5 SD, and normal bone mass was defined as T-score equal to or above −1 SD. 3,4 In the past, the risk of osteoporotic fracture was predicted based on BMD value. However, Schuit et al. reported that BMD value alone could not precisely predict the risk of osteoporotic fracture. 5 Therefore, Fracture Risk Assessment (FRAX) tool (has been developed to estimate the 10-year risk of hip and major osteoporotic fractures (MFs), considering either BMD value or individual risk factors or by WHO since 2008. 6 Risk factors including age (40–90 years old), sex, height, weight, BMD, body mass index, long-term use of glucocorticoids, parental history of hip fracture (HF), history of fragility fracture, smoking, alcohol consumption (three or more units per day), secondary osteoporosis, and rheumatoid arthritis. 7,8 Factors mentioned above have been proved to be more accurately associated with the osteoporosis fractures rate. 9,10
According to WHO, the threshold of high risk for the MF is set at 20% or more and the high risk for HF is set at 3% or more. However, Japanese Society for Bone and Mineral Research (JSBMR) modified the threshold of MF to 15% or more (<75 years). 11,12 In addition, Japan Osteoporosis Foundation also adopted other portable tools, such as calculator older version (first generation), calculator new version (second generation), and application of mobile software, which are more convenient in clinical practice, to predict the fracture risk. Currently, they are widely used in clinical practice. Of interest, calculation of FRAX tools not only requires the abovementioned risk factors but also requires other coefficients and formula to calculate the MF and HF rates; these details of formula and coefficients are not disclosed. After the development of calculator older version (first generation), the new FRAX version from the Centre for Metabolic Bone Diseases (Sheffield University) was released. The new FRAX version was used to obtain updated MF and HF rates for Japanese patients, and the calculator new version (second generation) was developed. However, they did not announce the details of the changes in the coefficients and formula.
However, in 2012, a study performed by Hamaya et al. compared the accuracy of calculator older version versus website version in predicting the fracture risk (MF rate) and found consistency between the two methods under certain age-group. 13 One limitation of this study is that it did not compare the two methods on HF rate with consideration of both male and female groups. In addition, no studies reported the predictive accuracy with application of mobile software. Therefore, to determine the accuracy of the results, the aim of our study was to investigate the consistency of the four prediction tools within each individual age-matched group with similar risk factors for MF and HF in males and females.
Materials and methods
Population
The data were extracted from 2016 medical examination report of Japanese Ministry of Health of Labor and Welfare. The physiological parameters, including age, height, and weight, are listed in Table 1. The threshold was defined based on the previous study with T-score between −1.8 SD and −2.7 SD. Osteoporosis was defined as T-score equal to or lower than −2.7 SD, and osteopenia was defined as T-score lower than −1.8 and greater than −2.7 SD. The MF and HF rates were then calculated in groups with different T-scores with consideration of age, sex, and risk factors. The consistency of MF and HF rates generated by the four prediction tools, calculator older version, calculator new version, application of mobile software, and website version were further compared (Figure 1).
Data were extracted from 2016 medical examination report of Japanese Ministry of health of labor and welfare.

BMI: body mass index.

Flowchart of the accuracy of different FRAX tools in predicting fracture risk. FRAX: Fracture Risk Assessment.
Results
The MF group
The prediction of MF rates with different independent factors generated by calculator new version and website version were similar in male or female groups, that is, the calculator new version can be completely replaced by the website version. A subtle difference was observed between the website version and the mobile software (the mobile software version is slightly less than the website version). For calculator older version, the results are a little higher than other versions.
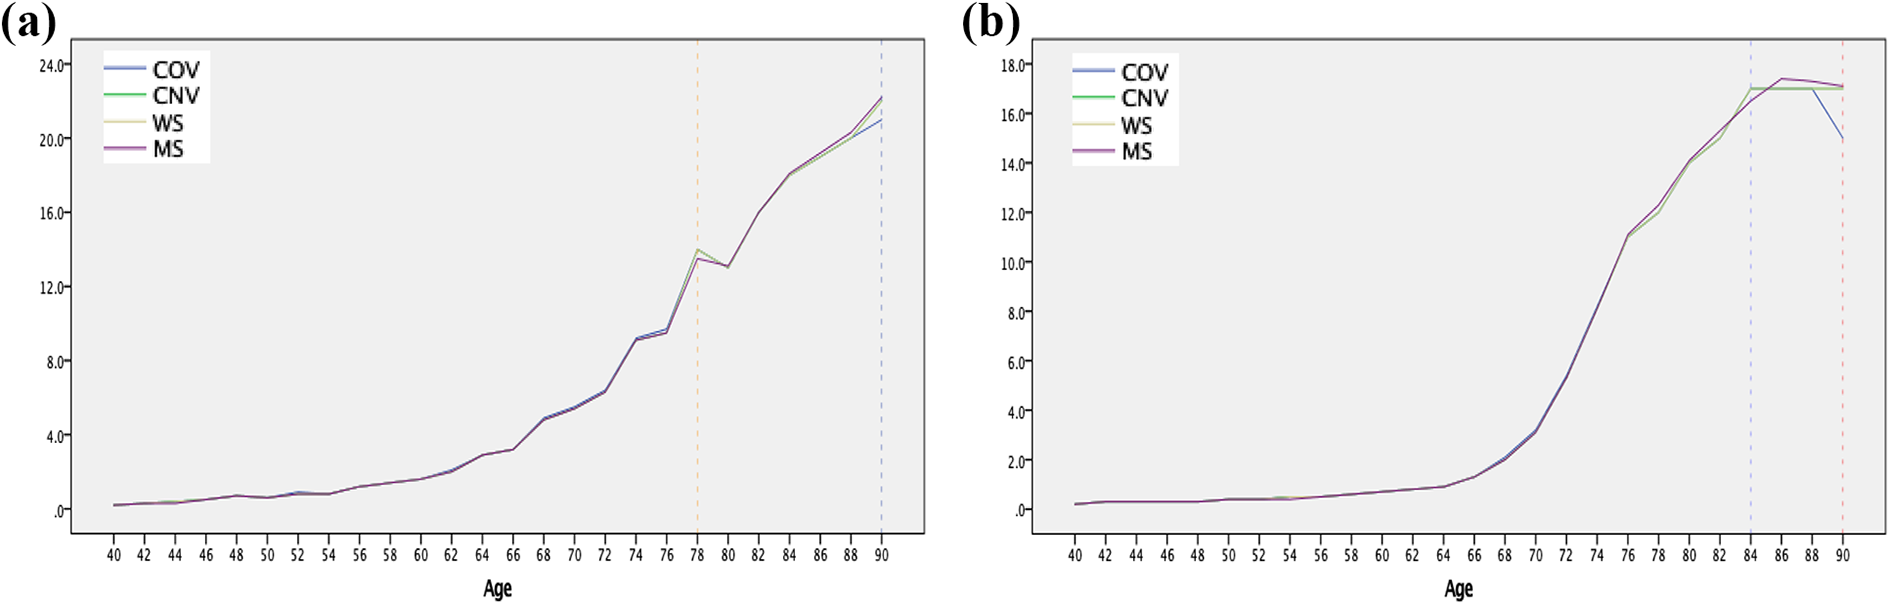
In the male group, basically, each calculation method shows almost the same results. The range of percent difference was from 0 to 0.4% between mobile software and website version. The range of percent difference was from 0 to 1% between calculator older version and website version tools under few risk factors at certain age (Figure 2(a) and (b)).

(a) In the MF of the male group, the most percent difference is equal to 1% at 72 years and 90 years between the calculator older version and the website version (T-score = −1.8 combined with factor of parent fracture) (blue dotted line). (b) The biggest percent difference is equal to 0.3% at 78 years and 80 years between the mobile software and the website version (T-score = −1.8 combined with factor of alcohol) (orange dotted line).
In the female group, likewise, the range of percent difference was from 0 to 0.5% between the website group and the mobile software group. The range of percent difference was from 0 to 2% between the calculator older version and the website version. Interestingly, the most percent difference (2%), which was relatively rare, was merely occurred at the age of 90, while most of the percent difference was from 0 to1% under few risk factors. (Figure 3(a) and (b)).

(a) In the MF of the female group, the biggest percent difference was 2% occurred at 90 years between the calculator older version and the website version (red dotted line); in addition, a subtle difference was 0.6% and 0.4% at 64 years and 76 years, respectively (orange dotted line) (T-score = −1.8 combine with factor of parent fracture). The biggest percent difference was 2% at 90 years (red dotted line). (b) The rarely percent difference was 1% at 70 years and 78 years (no BMD value combined with previous fracture) (blue dotted line).
The HF group
Remarkably analogous results were observed among calculator new version, mobile software, and website version in the male or female group, except for minor differences between the mobile software and the website version.
In the male group, between the calculator older version and the website version, most of the percent difference also ranged from 0 to 0.2% (Figure 4(a)), while the relatively high percent difference (0.5%) was merely observed under the factor of parent fracture at 76 years old and 82 years old (T-score = −1.8SD; Figure 4(b)).

(a) In the HF of the male group, there was no significant difference by four prediction tools, the percent difference was 0.1% at few ages (T-score = −2.7 and no factors). (b) The biggest percent difference was 0.5% over 75 years (red dotted line) (T-score = −1.8 combined with factor of parent fracture).
In the female group, the range of percent difference was from 0 to 1% between the calculator older version and the website version, with the biggest percent difference (2%) occurred at the age of 90 and most of the percent difference was from 0 to 0.3% (Figure 5(a) and (b)).
(a) In the HF of the female group, the biggest percent difference was 1% at 90 years (blue dotted line). The percent difference was 0.4% at 78 years (orange dotted line) (T-score = −1.8 combined with previous fracture). The biggest percent difference was 2% at 90 years (red dotted line). (b) The percent difference was 0.4% at 84 years (T-score = −1.8 combined with factor of parent fracture).
Discussion
With the prevalence of osteoporosis, morbidity of osteoporotic fracture was also increased substantially. Early anti-osteoporosis treatments have been reported to reduce the risk of osteoporotic fracture for patients. To prevent osteoporotic fractures, in recent years, many countries use clinical risk factors or BMD value generated by FRAX algorithm to predict fracture risk. Meanwhile, FRAX, a simple tool that is more convenient and practical for both physicians and patients, has also been proposed for resident physical checkup or primary screening of patients with osteoporosis. 14 As mentioned above, in Japan, there are four prediction tools that can predict risk of osteoporotic fracture; however, JSBMR does not have unified standard FRAX tool for clinical application. Moreover, the consistency of the four FRAX tools is largely unknown. To increase the accuracy of clinical application, this study is a straightforward, clear elucidation of consistency for four FRAX tools.
Previous study had shown a few differences between the calculator older version and the website version in predicting the 10-year probability of MF under few factors{, 2012 #722}. However, it does not seem to affect clinical practice, since the biggest difference (>2%) occurred only in patients over 75 years old. In our study, to evaluate the accuracy of the four methods, we determine the MF and HF rates by the four tools in male and female groups, respectively. Our results did not show complete consistency in four tools in predicting the fracture risk; nevertheless, the values of MF or HF were extremely similar among calculator new version, mobile software, and website version in both male and female groups. The biggest percent differences of MF (<0.5%) and HF (<0.2%) were observed only under merely few risk factors or over the age of 75 years. Besides, the biggest percent difference of MF was 1% (male group) or 2% (female group) between the calculator older version and the website version; however, it is worth noting that the majority of percent differences exceeds the age of FRAX threshold (75 years old) by JSBMR. Similarly, the most percent difference of HF was also observed in the older patients. Even though a few percent differences were shown in subjects under 75 years old, the percent difference was very low (between 0 and 1%) and relatively rare among different groups.
This study had several limitations, first, the study is mainly focused on evaluating the consistency of predicting risk, it does not reflect the real morbidly of osteoporotic fracture. Second, for prospective study, it is very difficult to collect the data of patients under same risk factors, therefore we have to extract data of patients from medical examination report and estimate the BMD value and risk factors. Third, the most percent differences were observed in patients over 75 years old, which did not seem to have significant difference in clinical practice; therefore, the statistical analysis was not performed.
Conclusion
Only a few percent differences were observed in four FRAX tools, as a matter of fact, almost all the percent differences were observed in elderly people (>75 years old). The clinical application of the four FRAX tools demonstrated no significant difference in predicting the 10-year probability of MF and HF.
Footnotes
Author contributions
NY designed this work and revised the manuscript. GX analyzed the work and wrote the manuscript. HT approved this work to study. KH, AT, SM, KI, YT, YA, HY, and SM analyzed data. All authors read and approved the final manuscript.
Declaration of conflicting interests
The author(s) declared no potential conflicts of interest with respect to the research, authorship, and/or publication of this article.
Funding
The author(s) received no financial support for the research, authorship, and/or publication of this article.