
Abstract
Purpose:
Although there has been research about the correlation between ankle injury and Y-balance test (YBT) conducted in other sports, there has been a lack of research on the correlation between ankle injury among baseball players and YBT scores or on differences in scores according to baseball positions. This study focused on professional baseball players as its subjects with the aims of analyzing the correlation between YBT and ankle injury and assessing differences in YBT between baseball positions.
Methods:
Age, height, weight, body mass index, and spine malleolar distance of 42 professional baseball players were measured. YBT measurements were performed using each foot in three distinct directions. YBT normalized reach distances, composite score, and reach asymmetry were analyzed.
Results:
The mean right posteromedial normalized reach distances for the player positions were significantly different between the pitchers (107.7%) and infielders (113.7%) (p = 0.028). For the composite score, the difference between the pitchers (92.3%) and infielders (95.0%) was statistically significant (p = 0.048). The anterior reach asymmetry was larger in the injured group than in the noninjured group (p = 0.041).
Conclusion:
This study shows that YBT can be used as a way of evaluating the injury of baseball players. It also shows the reference value of YBT according to position in professional baseball players. This study could be useful for the treatment of ankle injury of baseball players.
Introduction
Injury is an unavoidable aspect of competitive sports for athletes, and although medical treatments for injuries continue to advance, the frequency of injuries has not reduced. 1 This has led to active research to understand the etiology and mechanism underlying injury occurrence, with the aim of preventing injuries or aiding rapid recovery. 2
Ankle injuries account for the majority of cases of leg injuries among athletes. One of the most problematic ailments across various sports is the development of chronic ankle instability due to repeated ankle injuries; this is associated with poor balance in the legs. 3 The lower quarter Y-balance test (YBT) was developed and is a relatively convenient and affordable test that examines balance in three directions. Recently, there has been consistent research about the correlation between ankle injury and YBT results conducted in football 4,5 and volleyball players 6 and US National Collegiate Athletic Association (NCAA) Division 1 athletes. 7,8
Butler et al. 9 reported a research on the differences in YBT scores according to the competition level of baseball players, which was significant in establishing framework of reference with regard to using YBT for high school, college, and professional baseball players. However, there has been a lack of research on the correlation between ankle injury among baseball players and YBT scores or on differences in scores according to baseball positions.
Although ankle injury in baseball is less frequent than in other sports that require continuous running, such as football or basketball, ankle injury may cause both pitchers and fielders to temporarily withdraw from the sport. 10 –12 Furthermore, unlike other sports, baseball has very different sport characteristics depending on its play position. 13 –15
The purpose of this study is to analyze the correlation between YBT scores and ankle injury and assess differences in YBT scores between different baseball positions. We assume that the reference values of YBT will vary depending on the position of the baseball players.
Patients and methods
Participants
A total of 42 (N = 42) male players belonging to a single team within the Korea Baseball Organization were selected. Each player was classified according to his position as pitcher, infielder, or outfielder. The players were classified into injured and noninjured groups based on their history of foot and ankle injuries. Age, height, weight, body mass index (BMI), spine malleolar distance (SMD), handgrip strength, and direction of the dominant leg of the players were measured. Only players who were currently training and playing were included, and those with other existing injuries, complaints of dizziness, ear disorder, or difficulty in performing YBT were excluded from the study. This study was approved by the institutional review board of Asan Medical Center, and all participants read and signed an informed consent form before data collection.
Procedure of YBT
YBT measurements were performed using each foot in three distinct directions (anterior, posteromedial, and posterolateral), as described in previous studies. 16,17 The dominant leg is defined as the leg that the player usually uses to lightly kick the ball. The participant performed the test barefoot. Before the test, the examiner instructed the participant to follow three criteria: (a) to push the indicator as far away as possible with his foot while maintaining balance, (b) to not use momentum to move the indicator, and (c) to not step on top of the indicator while pushing it. The participant was required to always stand on one foot, and the long axis of the foot was directed along the anterior reach axis of the platform. The participant started YBT with six practice trials in each direction before undergoing the formal testing. The order of the practice was right anterior, left anterior, right posteromedial, left posteromedial, right posterolateral, and left posterolateral (Figure 1). The formal testing was conducted three times in each of the directions used during the practice. The rest time between each trial was approximately 20 s, which was the time taken by the examiner to record the data and return the indicator to its start position. In each trial, the reach distance was recorded to the nearest 0.5 cm, and the longest reach distance of the three formal trials in a given direction was used for the analysis. To account for the influence of height, the reach distances were normalized to each participant’s leg length by dividing the reach distance by the leg length and then multiplying it by 100. The leg length was measured from the anterior superior iliac spine to the inferior medial malleolus (SMD), while the participant was in a supine position. The composite score was calculated as the mean of the maximum normalized reaches across the three directions divided by 3 and multiplied by 100. 9 Reach asymmetry was calculated by taking the absolute difference in the maximum reach distance between the right and the left sides.
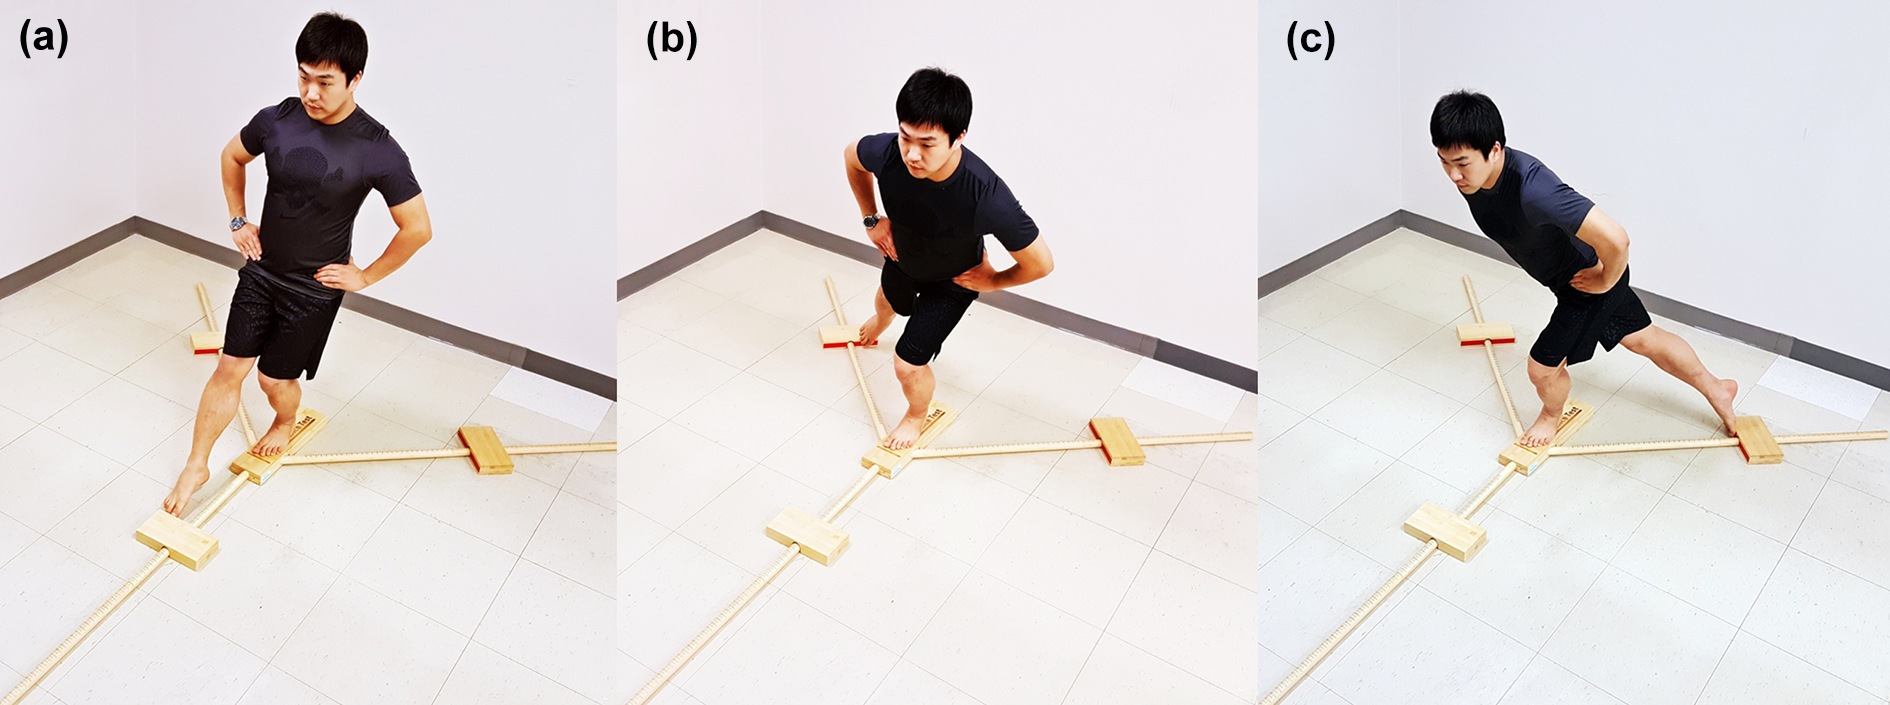
(a) Performing the left anterior reach test of the lower quarter YBT. (b) Performing the left posteromedial reach test of the lower quarter YBT. (c) Performing the left posterolateral reach test of the lower quarter YBT. YBT: Y-balance test.
Ankle injury
Ankle injuries were assessed and confirmed by taking the participant’s history based on the medical record data managed for the individual players. The injured group included participants who had sought care from one or more medical staff because of injuries to the foot and ankle and who had rested from training or playing for one or more days. The injuries were confirmed through the medical records (from simple radiographs, computed tomography, and magnetic resonance imaging).
Physical examination of the ankle
Ankle instability was assessed according to the result of the anterior drawer test (grade 0, 1, 2, or 3) 18 and the range of motion (plantar flexion and dorsiflexion) measured by two orthopedic surgeons (SGS and CHR) with 9 and 5 years of experience.
Statistical analysis
Statistical analysis was performed to determine the difference in results according to position, injury, dominant leg, and ankle instability.
Demographic data were analyzed according to player position and history of injury using analysis of variance (ANOVA) and independent-sample t-tests. YBT normalized reach distances, composite score, and reach asymmetry were analyzed according to player position using ANOVA, and differences between the injured and the noninjured groups in these parameters were analyzed using independent-sample t-tests. YBT normalized reach distance was analyzed according to the dominant leg of the pitcher and batter using independent-sample t-tests. YBT normalized reach distances, composite score, and reach asymmetry were analyzed according to ankle instability using Pearson’s correlation analysis. Statistical significance was set a priori at 0.05, and all analyses included a 95% confidence interval for statistical significance. The statistical analyses were performed using IBM SPSS version 21.0 (SPSS Inc., Chicago, Illinois, USA).
Results
Demographic and anthropometric data
The mean values of the parameters assessed in the participants were as follows: age, 27.5 (range 21 to 34) years; height, 1.84 (range 1.73 to 1.88) m; body weight, 85.2 (range 70.0 to 100.7) kg; BMI, 25.3 (range 22.7 to 28.8) kg/m2; and SMD (right, 94.7 cm; left: 94.8 cm). There were 19 pitchers, 16 infielders, and 7 outfielders, with no statistically significant differences in the composition of each group (Table 1). There were 19 injured players and 23 noninjured players, with no statistically significant differences in the composition of each group (Table 1). The injuries were ankle sprain in 14 participants, Achilles tendinitis in 2, ankle fracture in 1, accessory navicular syndrome in 1, and ankle bony impingement syndrome in 1.
Demographics based on position and injured player and noninjured player.a

SMD: spine malleolar distance; R: right; L: left; ANOVA: analysis of variance.
aData were analyzed by ANOVA test, independent-sample t-test.
Differences according to position
The mean right posteromedial normalized reach distances for the player positions were 107.7% for pitchers, 113.7% for infielders, and 111.7% for outfielders. The difference between the pitchers and the infielders was statistically significant (p = 0.028). For the composite score, the mean values were 92.3% for pitchers, 96.6% for infielders, and 95% for outfielders. The difference between the pitchers and the infielders was statistically significant (p = 0.048). There was no statistical significance between the player positions for the anterior and posterolateral normalized reach distances or for the left posteromedial normalized reach distance. The detailed results are presented in Table 2. There was no statistically significant difference between player positions for any direction of reach asymmetry (Figure 2).
Normalized reach distances according to position.a

R: right; L: left; ANOVA: analysis of variance.
aData were analyzed by ANOVA test.
bDifference between the two groups (p < 0.05).

Graph showing differences in reach symmetry in the lower quarter YBT between the pitchers, infielders, and outfielders. No significant differences were observed between the player positions (Y-axis: cm). YBT: Y-balance test.
Differences between the injured and the noninjured groups
There was no statistically significant difference between the injured and the noninjured groups for any direction of normalized reach distance or for the composite score. The detailed results are presented in Table 3. The mean reach asymmetry values for the injured and noninjured players were 5.3 cm and 2.6 cm for anterior, 5.5 cm and 3.9 cm for posteromedial, and 3.7 cm and 2.5 cm for posterolateral, respectively. In each direction, the reach asymmetry was larger in the injured group than in the noninjured group, but this difference was only significant for the anterior reach asymmetry (p = 0.041), wherein the difference between the groups was 2.7 cm (Figure 3).
Normalized reach distances between the injured player and the noninjured player.a
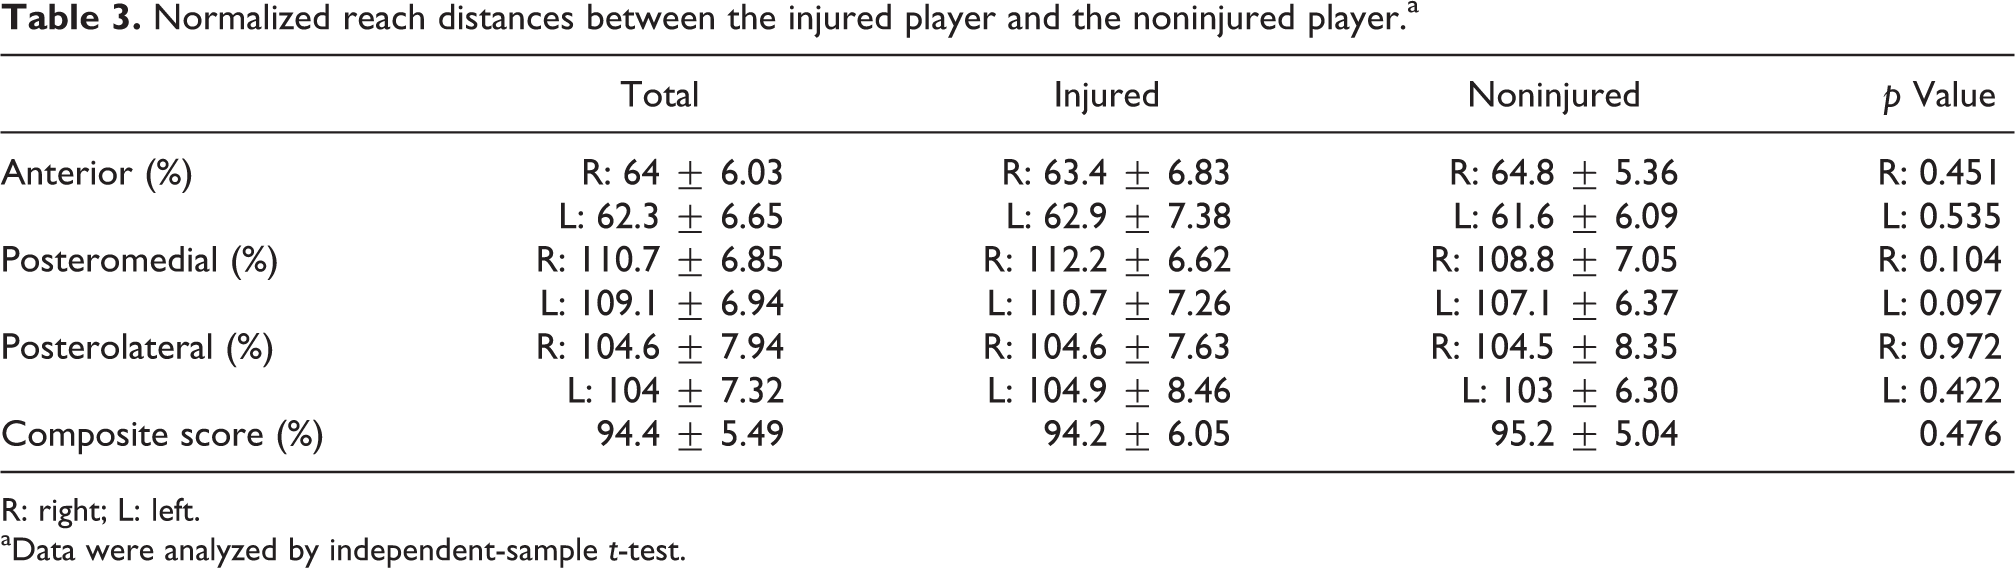
R: right; L: left.
aData were analyzed by independent-sample t-test.

Graph showing differences in reach symmetry in the lower quarter YBT between the injured and the noninjured player groups. The injured players exhibited greater anterior asymmetry compared with the noninjured players. (Y-axis: cm). YBT: Y-balance test.
Differences between the dominant and the nondominant legs
The mean normalized reach distances for the pitchers’ dominant and nondominant legs were 62.5% and 60.4% for anterior, 108.4% and 107.1% for posteromedial, and 103.5% and 101.9% for posterolateral, respectively (Table 4). For the batters, the mean values were 65.8% and 64.7% for anterior, 113.3% and 109.9% for posteromedial, and 106.9% and 104.4% for posterolateral, respectively (Table 4). There was no statistically significant difference between the dominant leg and the nondominant leg in either the pitchers or the batters (infielder and outfielder).
Difference in normalized reach distances on the Y-balance test according to the dominant leg pitcher and batter.a

aData were analyzed by independent-sample t-test.
Correlations with ankle instability and handgrip exercise results
There was no statistically significant correlation between the ankle instability results from the right and left anterior drawer tests and any direction of normalized reach distance, the composite scores, or reach asymmetry.
Physical examination
The mean ranges of motion of the participants were 18.8° dorsiflexion and 39.5° plantar flexion. The ankle drawer test classifications were G0 (right: 23, left: 32), G1 (right: 15, left: 8), and G2 (right: 4, left: 2). There were no statistically significant relationships between the physical examination results and YBT scores.
Discussion
In this study, professional baseball players underwent YBT, and the results were comprehensively analyzed with respect to history of ankle injuries, the players’ baseball positions, and differences between the players’ dominant and nondominant legs. In addition, this study sought to accrue reference data for YBT, which has been a neglected area of research to some extent. YBT provides a useful measurement of the functionality of the torso and legs and has the capacity to assess various elements in relation to the legs, including their range of motion, muscular strength, and neuromuscular control, as well as the tested individual’s lack of balance. 10,11 Injuries during sporting events can be prevented through appropriate preventative training; however, although some reports have indicated that YBT has the capacity for preemptively identifying individuals at risk of injury, previous research has been limited to analyses of football and volleyball players and general track and field athletes. 4,7,8,17
There have been two studies on YBT in relation to baseball players. Garrison et al. 16 compared YBT results between a baseball player suffering from ulnar collateral ligament tears (an injury in the arm as opposed to the leg) and a player without any injury, showing a statistically significant difference between them. Although this study did not investigate correlations with ulnar collateral ligament injury, there was no significant correlation between the handgrip strength and the YBT score. Therefore, it could be inferred that ankle balance has little direct relevance to muscular strength of the arms. Butler et al. 9 analyzed the correlation between high school, college, and professional baseball players and the players’ YBT scores and reported that the anterior normalized reach distance of the high school baseball players was higher than that of the college or professional baseball players. In contrast, the posteromedial and posterolateral normalized reach distances and the composite scores of the professional baseball players were significantly higher than those of the high school or college baseball players. In the present study, the normalized reach distance demonstrated a similar trend to that in the study by Butler et al. It is therefore deemed to be an appropriate parameter for use as reference data in future studies.
Among the previous studies on the YBT, those conducted by Smith et al. 7 and Wright et al. 8 selected over 50% of their research subjects among track and field athletes, whereas the subjects in the studies by Plisky et al. 17 and Butler et al. 4 largely consisted of football and basketball players. In comparison to track and field athletics, basketball and football entail more explosive directional changes, frequent jumps, and movements in the frontal plane; therefore, they pose a greater risk of acute injury as opposed to overuse injury. Such differences in movements between various sports may create differences in sources of injury and YBT outcomes. 1,19 The present study demonstrated that baseball fielders scored higher than the pitchers in the composite score and posteromedial normalized reach distance; this may be because of the higher frequency of directional changes and explosive movements. Among the fielders, the infielders, who require faster reflexes, recorded significantly higher results in terms of the composite score and posteromedial normalized reach distance. This indicates that when presenting normal reference data for YBT for baseball players, it is absolutely necessary to present separate values for each position, unlike in other sports.
Thorpe and Ebersole 5 reported that among female football players, there was no difference in star excursion balance test (SEBT) results between the dominant and the nondominant legs. Hudson et al. 6 also found no difference in the YBT normalized reach distance between the dominant and the nondominant legs. From the YBT results of young, healthy men and women, Alnahdi et al. 20 found that there was a statistically significant difference in the posteromedial normalized reach distance between the dominant and the nondominant legs among men but no difference among women. However, the results of the present study showed no statistically significant difference between the dominant and the nondominant legs in terms of the YBT normalized reach distance among the pitchers and batters. Unlike other sports, baseball was analyzed under the premise that there may be a difference in terms of ankle injury and balance between the pitcher’s pivot foot and his/her opposite foot when pitching; however, in practice, no significant difference was observed. For batters, it was assumed that there may be a difference in the YBT scores between the forward foot and the rear foot on the batter’s box, but again there was no statistically significant difference. This implies that compared to basketball, volleyball, or football, baseball does not entail a higher likelihood of dominant leg injury or a difference in balance; this observation may provide a valuable reference in the future for the rehabilitation or training of players recovering from ankle injury.
Since 2006, various studies have reported research regarding the prediction of injuries using a balance test. Initially, SEBT was used, with YBT gradually becoming more prominent. Plisky et al. 17 reported that when SEBT yielded an anterior left–right difference of over 4 cm and an overall score below 94%, the risk of injury among high school basketball players significantly increased in comparison to that in the control group. Butler et al. 4 reported that for YBT composite scores below 89.6%, the risk of injury among college football players was significantly higher than that for the control group, although the left–right differences showed no correlation with injuries. Smith et al. 7 reported that when the anterior left–right difference was over 4 cm, the risk of injury among NCAA Division 1 athletes significantly increased in comparison to the control group, although the composite score showed no correlation with injuries. Wright et al. 8 reported that the YBT results of NCAA Division 1 athletes were not correlated with injuries. In addition, Butler et al. 4 reported that among football players, previous leg injuries showed no correlation with YBT results. The present study found that professional baseball players with past ankle injuries showed an anterior left–right difference of 5.3 cm, which was significantly different from the 2.6-cm difference shown by those without any injury; however, the composite scores showed no significant difference. This demonstrated that in baseball, similar to other sports, the anterior left–right difference measured with YBT reflected past ankle injuries. Because this study analyzed correlations with YBT results based on the existence of previous ankle injuries, it naturally differed from previous research to some extent.
Although this study also conducted YBT in practice and physically examined the participating athletes 1 year later to verify their injury status, the frequency of ankle injury in baseball is lower than that in other sports, such as football or basketball. It was determined that it would be difficult to analyze these injury results meaningfully; therefore, these results have not been included in the article. A larger scale future study could potentially identify a correlation between YBT results and subsequent sports injuries.
There was no direct correlation demonstrated between the YBT scores and the presence of instability assessed through a physical examination of the ankles. Because the ankle physical examination was a static examination, the results may be interpreted as signifying that ankle instability had no direct impact on the YBT results, which reflected the dynamic status. Further research on the relationship between physical examinations and YBT is needed.
Although there are previous report that 90% of ankle sprain do not require surgery, 21 recently, new surgical methods for ankle instability have been introduced. 22,23 An ankle sprain in athletes, including baseball players, is a very common injury, but there is debate about whether conservative or surgical treatment is needed. Comparing the results of conservative treatment or surgery after ankle injured athletes, the results of the treatment can be objectively evaluated by YBT. 24 –26 The most common treatment for acute ankle injuries in athletes is bracing or taping. It is also interesting to analyze the effect of bracing or taping by performing YBT.
This study had some limitations. First, the number of research subjects was relatively small and included in only one baseball team. Second, the study was unable to verify whether aspects such as rehabilitation training for injured athletes led to an improvement in the YBT scores and whether this allowed the prediction of the probability of the future recurrence of injuries. Additional analysis regarding this issue is needed, alongside ankle rehabilitation exercises. Third, subgroup analysis of different ankle injuries was not performed because of small sample size.
In conclusion, this study on professional baseball players succeeded in showing differences in YBT results and establishing reference values in relation to the players’ positions and injury status. In addition, the results confirmed that anterior left–right differences in the YBT results may be utilized as an indicator that reflects injury status in baseball. Based on the outcomes of this study, restoring balance in training and rehabilitation following ankle injuries will be an important task.
Footnotes
Acknowledgements
The authors thank all on-site physicians who worked as field doctors. The authors also thank all staff and players of LG twins for the kind cooperation for this study.
Declaration of conflicting interests
The author(s) declared no potential conflicts of interest with respect to the research, authorship, and/or publication of this article.
Funding
The author(s) disclosed receipt of the following financial support for the research, authorship, and/or publication of this article: This work was supported by a grant (2018-0808) from the Asan Institute for Life Sciences, Asan Medical Center, Seoul, Korea.