
Abstract
Purpose:
Pelvic position on the sagittal plane is usually evaluated with the pelvic sagittal inclination (PSI) angle from a single radiograph. However, the reproducibility of pelvic positioning has not been investigated, and thus, the validity of measuring the PSI from a single film/time point is not understood. Herein, the reproducibility of a patient’s pelvic positions in supine and standing postures was analyzed.
Methods:
A total of 34 patients who underwent either a pelvic osteotomy or total hip arthroplasty were enrolled in this study. Preoperative radiographs in both supine and standing postures were acquired twice (first X-ray and second X-ray) within 6 months; preoperative computed tomography (CT) images of the full pelvis were also acquired in a supine posture (preop-CT). To eliminate measurement variability, each PSI was automatically measured from radiographs and CT images through the use of CT segmentation and landmark localization followed by intensity-based 2D-3D registration. The absolute difference of PSI among each image was calculated and the intra-class correlation coefficient (ICC) in each posture was also analyzed.
Results:
The median absolute differences of PSI in the supine posture were 1.3° between the first and second X-rays, 1.2° between the first X-ray and preop-CT, and 1.3° between the second X-ray and preop-CT. The median absolute difference of PSI in the standing posture was 1.5°. The ICC was 0.965 (95% CI: 0.939–0.981) in supine and 0.977 (95% CI: 0.954–0.988) during standing.
Conclusions:
Pelvic positions in supine and standing postures are reproducible. Thus, measuring the PSI from a single radiograph is reliable.
Introduction
Often, a single radiograph of the hip is acquired for measuring cup alignment after total hip arthroplasty (THA). However, the orientation of the cup measured on the radiographic plane is sensitive to changes in pelvic sagittal inclination (PSI) angle. 1 –4 Several reports to date have measured the PSI on radiographs in supine, standing, and sitting postures to understand the rotational change of the pelvis among these postures. 3,5 –14 Furthermore, some reports have measured the longitudinal change of the PSI after hip surgery. 11,12,15 PSI measurements in these reports are based on an assumption that a single radiograph is representative of the position of the pelvis in each body posture, regardless of the physical condition of the pelvis and technique employed to instruct patients as to the posture they should adapt during the acquisition of the film. However, very little is known regarding the variability of a patient’s pelvic positions on the radiographic plane in each posture. Presumably, the validity of a single measurement of the PSI will be low if the variability of a patient’s pelvic position is larger than the real change of the PSI. The objective of this study was to assess the reproducibility of a patient’s pelvic position on the radiographic plane in supine and standing postures by comparing the PSI angle in each posture at different preoperative time points. We hypothesized that PSI in both supine and standing postures is highly reproducible.
Materials and methods
Institutional review board approval for this retrospective study was obtained. Patients who underwent primary THA or hip osteotomy between January 2016 and March 2017 were included. Specifically, those patients who had an anteroposterior radiograph acquired in both supine and standing postures at two time points (first X-ray and second X-ray) with an interval of less than 6 months were considered. Preoperative computed tomography (CT) images of the hip were also acquired for CT-based navigation surgery, and a total of 34 patients (5 men, 29 women, age: 64 ± 11 years, mean ± standard deviation [SD]) were included in this study. The primary indication for surgery was hip osteoarthritis (Table 1). Radiographs were acquired with a median interval of 10 weeks. Preoperative CT images were acquired for purposes of CT-based navigation surgery (preop-CT), and were obtained at a median interval of 10 weeks from the first X-ray (Table 1). Both radiographs and CT images in the supine posture were acquired with the patient in a relaxed position; radiographs were obtained in the standing posture without the use of ambulatory aids, with the patient’s hands crossed in front of their chest.
Patient demographics and X-ray characteristics.

THA: total hip arthroplasty; DDH: developmental dysplasia of the hip; CT: computed tomography; IQR: interquartile range.
aValue expressed as median (IQR).
The PSI in the supine posture was measured from the first X-ray, second X-ray, and preop-CT. Here, the PSI was defined as the angle between the anterior pelvic plane (APP), which is a plane created from the bilateral anterior superior iliac spines (ASISs) and the pubic tubercle, 16 and the horizontal line of the body 10 (Figure 1). The PSI in the standing posture was measured from the first and second X-rays and was set as the angle between the APP and the line perpendicular to the floor, as has been done by others 3,6,7,10 –14 (Figure 1). The value was set as positive if the pelvis was tilted anteriorly from the APP and was set as negative if the pelvis tilted posteriorly from the APP.
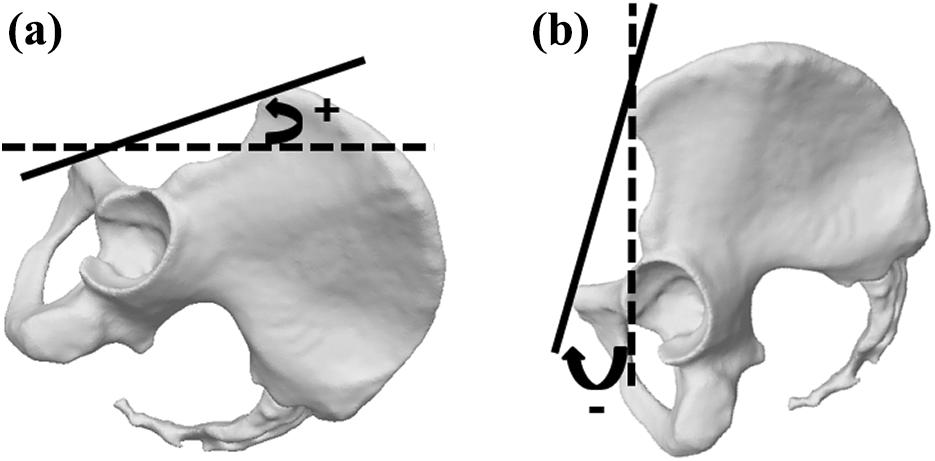
3D model generated from CT images showing PSI. The PSI in supine posture (a) was defined as the angle between the APP (black solid plane) and the horizontal line of the body (dotted black line). The PSI in standing posture (b) was defined as the angle between the APP (black solid plane) and the line perpendicular to the horizontal surface (black dotted line). The value was set positive for anterior rotation and was set negative for posterior rotation. CT: computed tomography; PSI: pelvic sagittal inclination; APP: anterior pelvic plane.
To eliminate inter- and intra-observer variations in measurements, the PSI was measured from the CT images and radiographs with the use of the fully automated method 14 ; this technique automatically segments the bone region, identifies anatomical landmarks from the CT images, and measures the PSI from radiographs using intensity-based 2D-3D registration. Briefly, the PSI in preop-CT was measured by automatically identifying the bilateral ASISs and pubic tubercle from the CT images with the use of a hierarchical and conditional statistical shape model of the pelvis, 17 and the PSI in first and second X-rays was measured with the use of an intensity-based 2D-3D registration method that was evaluated elsewhere. 18,19
After the PSI in the supine posture was measured from the first X-ray, second X-ray, and preop-CT, the difference in the absolute value was calculated and the difference among each measurement was analyzed as was the intra-class correlation coefficient (ICC). The PSI in the standing posture was also measured from the first and second X-rays and the difference in the absolute value was calculated along with the ICC of the two measurements. The angular change of PSI from the supine to standing posture was also measured in both the first and second X-ray and their absolute difference was also calculated.
To clarify which factors led to the variation of the PSI in each position, the difference in supine PSI between the first and the second X-ray was compared with that in the standing posture using the Pearson correlation coefficient. The effect of the time interval between the first and the second X-ray on PSI variation was also analyzed.
The accuracy of the 2D-3D registration was evaluated by radiographs that were synthetically generated from a CT image data set. A total of 1000 digitally reconstructed radiograph (DRR) images were generated from one CT data set and Poisson noise was added to the DRRs to simulate physical phenomenon in the X-ray imaging process of the radiographs. 20 The CT images were iteratively translated and rotated along the axes of the pelvis in 3D space (x-axis: horizontal axis of the pelvis, z-axis: vertical axis of the pelvis, and y-axis perpendicular to x- and z-axes) to represent radiographs at various pelvic positions. 2D-3D registration was conducted with each DRR image, and then the translational errors in each axis after 2D-3D registration were evaluated against the reference standard position at which each DRR was generated. 20
Normality tests were performed for the PSI measurements with the Kolmogorov–Smirnov test. The differences of PSI in the supine posture among the three images (first X-ray, second X-ray, preop-CT) were compared using a general liner model with repeated measures. When the values were normally distributed, data were expressed as average (±SD), the difference between the two groups was compared using the Student’s t-test, and correlations were performed using the Pearson correlation coefficient. When values were not normally distributed, data were expressed as median (interquartile range [IQR]), the difference between the groups was computed using the Mann–Whitney U-test, and correlations were calculated using the Spearman rank test. The values of p < 0.05 were considered to represent significant differences and correlations. Statistical analyses were performed with SPSS statistical software version 23 (IBM Japan, Tokyo, Japan). A post hoc power analysis was conducted with G*Power software. 21
Results
The average PSI in the supine posture was 4.1° (±8.2°) in the first X-ray, 4.4° (±8.1°) in the second X-ray, and 4.3° (±7.8°) in the preop-CT (Table 2). There were no significant differences among the three groups (p = 0.70). The median absolute differences of PSI were 1.3° between the first and the second X-ray, 1.2° between the first X-ray and the preop-CT, and 1.3° between the second X-ray and the preop-CT (Table 2). There were only a cumulative total of two cases (6%) which showed a difference of more than 5° among the three measurements (one case between the first X-ray and the preop-CT, and another case between the first and the second X-ray: Figure 2); the maximum difference was 5.1°. The ICC of the three measurements was 0.965 (95% CI: 0.939–0.981). The average PSI in the standing posture was −4.1° (±10.9°) in the first X-ray and −3.4° (±11.1°) in the second X-ray (Table 2). There was no significant difference between the PSI of the first and the second X-ray (p = 0.15). The median difference in the absolute value of the two measurements was 1.5° with a maximum difference of 7.5°. There were only three cases (9%) which showed a difference of more than 5° (Figure 2). The ICC of the two measurements was 0.977 (95% CI: 0.954–0.988). Using the effect sizes calculated from the sample data (supine: 0.11, standing: 0.25), the power for the differences between PSI measurements was 0.99 for supine and 0.21 for standing. For the standing position, 124 cases were required to reach a power of 0.8.
Results of the PSI measurements.

N/A: not applicable; PSI: pelvic sagittal inclination; CT: computed tomography; SD: standard deviation; IQR: interquartile range.
aValue expressed as mean ± SD.
bValue expressed as median (IQR).

Correlation plots showing the relationship between PSI measured on the first X-ray to that measured on the second X-ray or preop-CT in standing or supine postures. Correlation plots of the PSI in the supine posture between first and second X-rays (a), correlation plots of the PSI in the supine posture between preop-CT and first X-ray (b), and correlation plots of the PSI in the standing posture between first and second X-rays (c). Circle dots indicate each case and the cross marks indicate the case in which a difference of ≥5° was observed. PSI: pelvic sagittal inclination; CT: computed tomography.
By comparing the change in PSI from the supine to standing posture, the change in the first X-ray was −8.2° (±5.6°) while it was −7.9° (±5.2°) in the second X-ray. There was no significant difference between them (p = 0.52), and their median absolute difference was 1.4° (IQR: 0.6–2.4°).
In the analysis of the factors, there was no significant correlation between the variation of PSI in the supine posture and the variation of PSI in the standing posture (r = 0.27, p = 0.13). By comparing the PSI difference between the first and the second X-ray with the median interval (10 weeks), no significant differences were observed in the variation of PSI in both supine and standing postures (Table 3).
Effect of the interval between the first and the second X-ray on PSI variation.a
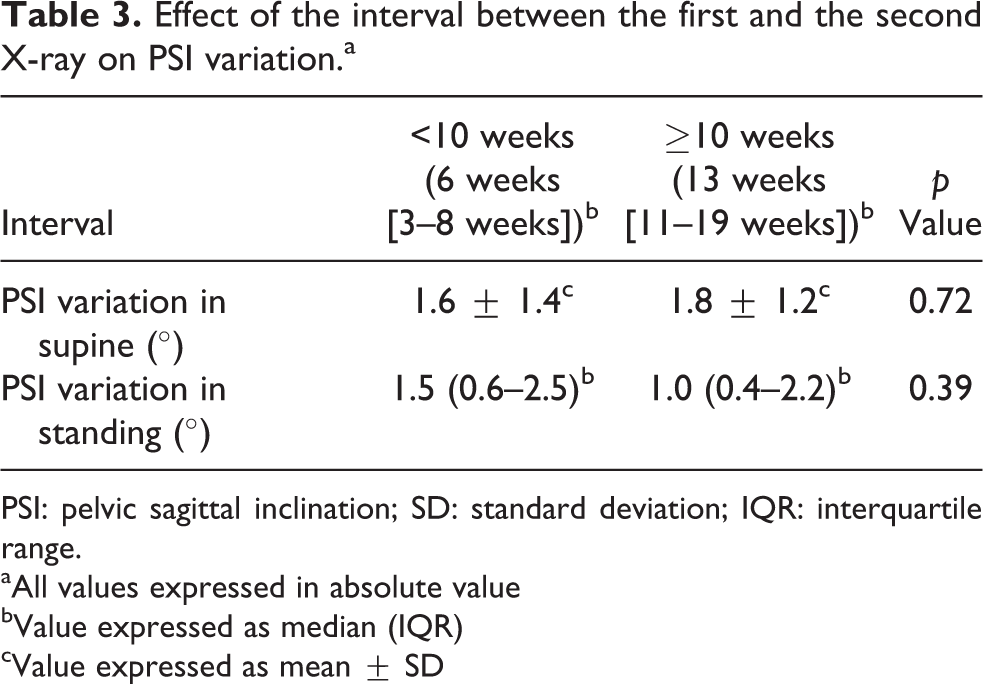
PSI: pelvic sagittal inclination; SD: standard deviation; IQR: interquartile range.
aAll values expressed in absolute value
bValue expressed as median (IQR)
cValue expressed as mean ± SD
In the accuracy evaluation experiment, the average translational error measured along the x-, y-, and z-axes were 0.016 ± 0.026 mm, 0.158 ± 0.238 mm, 0.068 ± 0.024 mm, respectively. The rotational error along the x-axis, which represented the error on the sagittal plane of the pelvis, was 0.023 ± 0.068°, and the rotational errors around the y- and z-axes were 0.005 ± 0.008° and 0.021 ± 0.028°, respectively. All data generated from analysis are available from the corresponding author upon request.
Discussion
Several studies have measured the PSI in supine, standing, and sitting postures, 3,5 –14 and many factors such as age, spinal deformities, and disease type have been reported to correlate with PSI. 4,5,8,13,14 However, little is known regarding the reproducibility of PSI measurements on radiographs, which depends on two major factors: (1) measurement variation and (2) positioning variation of the pelvis against the radiographic plane while acquiring images. Thus, to evaluate the variation of the patient’s pelvic position, it is required to minimize the influence of the measurement variation. Typically, methods to measure the PSI from radiographs require human intervention (e.g. selecting ASISs and pubic tubercles from the lateral view of the pelvis 1,3 –6,8,9,15 or defining the shape of the pelvic foramen from an anteroposterior view of the pelvis 7,10 –13 ), which lead to observer variability (ICCs of 0.84–0.91 4,8 ). To this end, we evaluated the reproducibility of pelvic positioning in the supine and standing radiographs by measuring the PSI at two different time intervals using a fully automated computer measurement system.
Overall, we found that there was only a small difference in PSI in the same posture between two successive images. We also found excellent ICCs in PSI measurements in both supine and standing postures. As we employed an automatic measurement technique, it is most likely that these small differences arise from subtle differences in the manner in which the patient was positioned during acquisition of the film, differences in the physical condition of the patient’s pelvis and hip, or some combination thereof. According to two prior computational simulation studies, 1,2 a change of 1° in PSI can be calculated as a change of 0.7–0.8° in cup anteversion with a corresponding change of 0.3° in cup inclination. Therefore, the median variation of PSI between the first and the second X-ray in the supine posture (1.3°) can be calculated as a difference of 0.9–1.0° in anteversion and a difference of 0.4° in inclination; the variation in standing posture (1.5°) can be calculated as a difference of 1.1–1.2° in anteversion and a difference of 0.5° in inclination. Collectively, this suggests that measurement of the PSI from a single supine or standing film will be valid for evaluating the orientation of the acetabulum. Several studies reported a wide variability in the measurement of the PSI in both supine and standing postures with a larger variability during standing posture. 3,7,14 One report, which included 1517 cases, found that the difference in the type and/or position of the images (supine: CT images, standing: radiographs) may be one of the reasons for the variation to be larger in standing. 3 In contrast, our results indicate that the pelvic position in the standing posture is essentially as reproducible as the supine posture, which may be caused by differences in positioning at the time the film is acquired. All X-ray technicians at our institute request that the patient stands relaxed with their hands crossed in front of their chest when acquiring standing X-ray, which we believe is comparable to the usual standing posture and has a minimal effect on PSI, rather than their hands on the back of their head, 3 which may lead to lumbar lordosis and variation in the PSI.
Limitations
To the best of our knowledge, this study is the first to report the reproducibility of the pelvic positions by using a fully automated measurement system that avoids inter- and intra-observer variations. However, there are some limitations that warrant discussion. First, the number of the subjects was limited (indicated by the statistical power of less than 0.8 in the standing position), and there was some variation in the intervals in which the images were acquired. Nevertheless, the differences in the median absolute difference among the measurements were small (less than 2°) and likely not clinically relevant. In addition, as all films were acquired within 6 months, we would anticipate that differences in the PSI would not be sensitive to the time interval. Still, it may be useful to extend this analysis to a larger cohort in the future with strictly enforced time intervals between when the films are acquired. Another potential limitation was that the PSI was only measured in the preoperative period. There may be differences in the PSI when comparing films that were both obtained during the postoperative period.
Conclusions
The patient’s pelvic positions in the supine and standing postures on the radiographic planes are highly reproducible during the preoperative period, at least when obtained within 6 months. Therefore, we recommend that a single film be acquired to measure the PSI when surgery is anticipated within 6 months from acquisition of the first film.
Footnotes
Acknowledgement
The authors would like to thank Dr. Andrew E. Anderson for his help in editing this article.
Declaration of conflicting interests
The author(s) declared no potential conflicts of interest with respect to the research, authorship, and/or publication of this article.
Funding
The author(s) disclosed receipt of the following financial support for the research, authorship, and/or publication of this article: This research was supported by the International Collaborative Research Program: Strategic International Research Cooperative Program (SICP) (Strategic Japanese-Swiss Cooperative Research Program) from AMED, MEXT/JSPS KAKENHI (grant no. 26108004), and JST PRESTO (grant no. 20407).