
Abstract
Purpose:
The purpose of this article is to compare the predictive power of two models trained with computed tomography (CT)-based radiological features and both CT-based radiological and clinical features for pathologic femoral fractures in patients with lung cancer using machine learning algorithms.
Methods:
Between January 2010 and December 2014, 315 lung cancer patients with metastasis to the femur were included. Among them, 84 patients who underwent CT scan and were followed up for more than 3 months were enrolled. We examined clinical and radiological risk factors affecting pathologic fracture through logistic regression. Predictive analysis was performed using five different supervised learning algorithms. The power of predictive model trained with CT-based radiological features was compared to those trained with both CT-based radiological and clinical features.
Results:
In multivariate logistic regression, female sex (odds ratio = 0.25, p = 0.0126), osteolysis (odds ratio = 7.62, p = 0.0239), and absence of radiation therapy (odds ratio = 10.25, p = 0.0258) significantly increased the risk of pathologic fracture in proximal femur. The predictive model trained with both CT-based radiological and clinical features showed the highest area under the receiver operating characteristic curve (0.80 ± 0.14, p < 0.0001) through gradient boosting algorithm.
Conclusion:
We believe that machine learning algorithms may be useful in the prediction of pathologic femoral fracture, which are multifactorial problem.
Introduction
Pathologic femoral fractures due to lung cancer decrease the quality of life and increase the mortality in patients with lung cancer. Prophylactic surgery of impending fracture improves the quality of life and minimizes surgery-associated complications that often occur in patients who sustain a fracture and are subsequently bedridden. 1,2
However, early surgery for bone metastasis in the femur is controversial. The one reason is that most cases of bone metastasis can be controlled with conservative treatments such as radiation therapy and chemotherapy. 3,4 Another reason is that the assessment methods for fracture risk are still inaccurate.
The accuracy of the canonical Mirel’s scoring system was reportedly less than 50%. 5 Computed tomography (CT)-based structural rigidity analysis was recently developed and showed better performance; however, its accuracy was still as low as 63%. 6,7 Previous studies enrolled patients with femoral metastasis derived from diverse cancers, which often resulted in different clinical courses during the progression of disease. More importantly, clinical features such as body weight, height, and response to chemotherapy or radiation therapy were affinitive to metastatic femoral fractures. Thus, only the image-based analysis for predicting fractures may have limitations.
Machine learning algorithms are computational learning methods that aid in decision-making by analyzing data. These algorithms have shown better performance in predictive models because they improve accuracy by combining many features that are effective but statistically insignificant. We hypothesized that machine learning algorithms will improve the predictive accuracy of fracture in the metastatic femur by combining CT-based radiological features with clinical features. In this study, the power of predictive model for pathological fracture trained with CT-based radiological features was compared to those trained with both CT-based radiological features and clinical information.
Methods
The institutional review board approved this retrospective Health Insurance Portability and Accountability Act (HIPAA)-compliant study and waived informed patient consent (2016-06-086).
Patients
Between January 2010 and December 2014, 761 lung cancer patients were diagnosed with bone metastasis through pathological or clinical confirmation. Of these, 315 patients had bone metastasis to the proximal femur. The patients who underwent CT scan and were followed-up for more than 3 months were included in this study. To avoid the bias due to surgical decisions, we excluded the patients who underwent surgery without imaging evidence of fractures, which is impending fractures. Among 315 patients, 154 patients performed CT scan. Thirty-seven patients were excluded because they died within 3 months after CT scan, and 33 patients were excluded because the quality of their CT images was not appropriate for bone evaluation. Thus, 84 patients were ultimately enrolled in this study.
Outcome measure
The study cohort was followed-up for at least 3 months after CT scan. A pathological fracture was defined when the fracture occurred within 3 months after CT scan. We considered the patients who underwent chemotherapy within 3 months before CT scan as the recent chemotherapy group and who underwent radiation therapy for a metastatic lesion of the proximal femur as the radiation treatment group. Based on simple radiographs, an osteolytic group was defined when radiolucency in the lesion was increased compared to that on the contralateral side. The amount of cortical disruption and the character of pain were not evaluated to avoid inter-/intra-observer errors.
CT protocol and evaluation
CT scans were performed with a GE LightSpeed RT 16 system (GE Healthcare, Milwaukee, Wisconsin, USA), from the lower lumbar to the distal femur level, with 120 kVp, tube current of 250 mA, and slice thickness of 5 mm.
The density and length of the lesion, density of affected bone and contralateral bone, relative density of the affected bone, extent and severity of cortical disruption, and distance between the tumor center and body midline were measured and evaluated by a musculoskeletal radiologist using a picture archiving and communication system (Centricity Radiology RA 1000, GE Healthcare, Chicago, Illinois, USA).
The density of the lesion was measured by placing a free-hand drawn region of interest in the lesion at the slice of the largest lesion. The length of the lesion was represented by multiplying slice thickness by the number of affected slice. The density of affected bone and contralateral bone was defined as the Hounsfield unit of the entire area of affected bone including both the cortical bone and bone marrow at the slice of the largest lesion and that of the same slice in the contralateral limb, respectively. The relative density of the affected bone was defined as the ratio of the density of affected bone to contralateral bone (Figure 1).
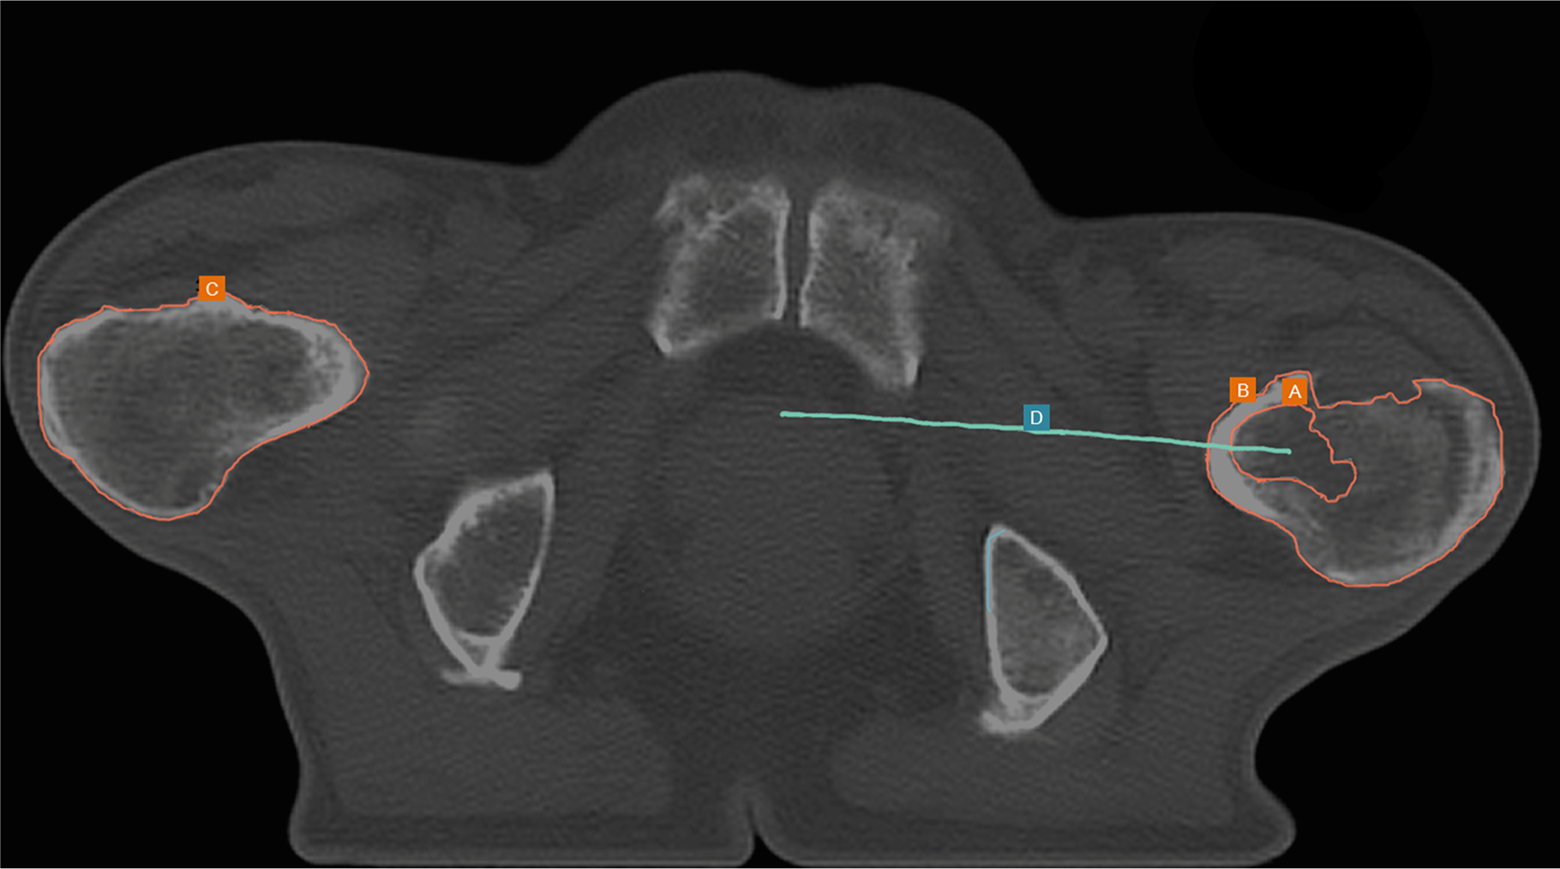
Extraction of radiological features from CT scan. (a) Density of the lesion. (b) Density of the affected bone. (c) Density of the contralateral bone. (d) Distance between the tumor center and body midline. CT: computed tomography.
The extent of cortical disruption was graded into four grades: grade 1, cortical disruption involving <25% of the entire perimeter at the slice showing the highest grade; grade 2, cortical disruption between 25% and 50% of the entire perimeter; grade 3, cortical disruption between 50% and 75% of the entire perimeter; and grade 4, cortical disruption involving >75% of the entire perimeter.
The severity of cortical disruption was classified as grade 1 when the outer cortex is intact or grade 2 when the full thickness of cortical bone is destructed. The distance between the tumor center and body midline was the shortest distance between the tumor center and the line connecting the symphysis pubis and the sacral center.
Analysis pipeline
We extracted radiological features from CT scan and clinical features from the known independent variables that were expected to affect either tumor progression or mechanical loading including simple radiograph (Table 1).
CT-based radiological features and clinical features.

CT: computed tomography; HU: Hounsfield unit.
All CT-based radiological and clinical values were preprocessed using L2-normalization and the outcomes were labeled with binary features. If a patient developed pathologic fracture within 3 months after CT scan, the outcome was labeled as 1. If a patient did not have fracture within 3 months after CT scan, the outcome was labeled as 0.
We performed predictive analysis with the data of 84 patients and 16 different features. After the normalization of features, the data set was randomly split into 85% train set and 15% test set using N = 100 bootstrap resampling. The classifiers were optimized by correcting hyperparameters with five-fold cross-validation. The optimized classifiers were trained with the bootstrap train samples and tested with the corresponding bootstrap test samples. The process was performed iteratively across all 100 bootstrap resampled data to evaluate the predictive power of each classifier (Figure 2).

Pipeline of data analysis. Prediction analysis was performed on the data of 84 patients and 16 different features. The data set was randomly split into 85% train set and 15% test set using N = 100 bootstrap resampling. The classifiers were optimized by correcting hyperparameters with five-fold cross-validation. The optimized classifiers were trained with the bootstrap train samples and tested with the corresponding bootstrap test samples. The process was performed iteratively across all 100 bootstrap resampled data to evaluate the predictive power of each classifier.
Machine learning classifier
The classifiers used for the current study included AdaBoost, support vector machine (SVM), gradient boosting (GB), linear discriminant analysis (LDA), and random forest. Each classifier was optimized by correcting hyperparameters by means of five-fold cross-validation with the training data set. The optimized hyperparameters of each classifier were listed in Table 2. Python 2.7.3 (Python Software Foundation, Beaverton, Oregon, USA) with the scikit-learn, Matplotlib, SciPy, and NumPy packages was used for the study. 8
Optimized supervised learning algorithms used for training.a
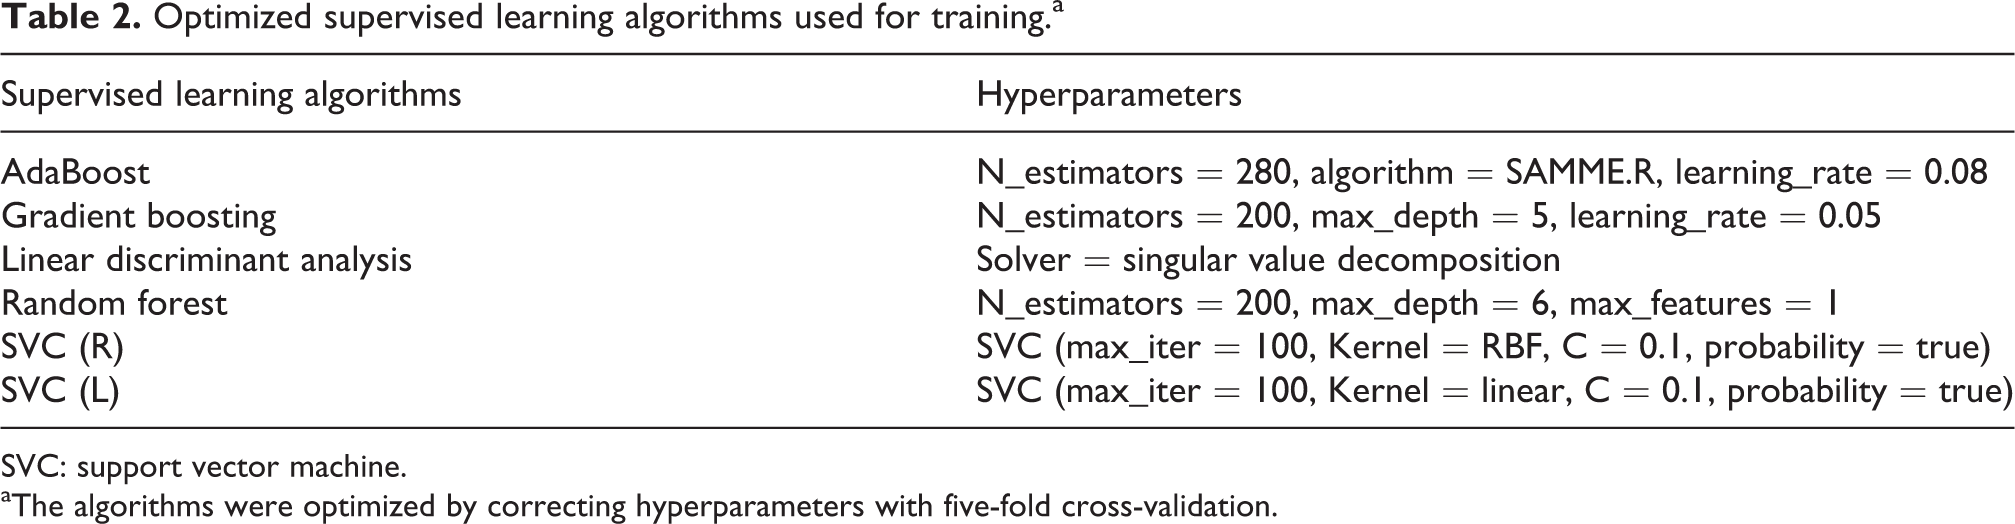
SVC: support vector machine.
aThe algorithms were optimized by correcting hyperparameters with five-fold cross-validation.
Statistical analysis
To identify clinical risk factors for pathologic fracture, logistic regression analysis was performed. Clinical features were used as independent variables and multivariate logistic regression was performed with MedCalc (version 12.7; MedCalc Software, Ostend, Belgium). We evaluated the predictive performances of the predictive models by the receiver operating characteristic (ROC) analysis, and we compared the areas under the ROC curve (AUC) of combination of CT-based radiological and clinical features with only CT-based radiological features. The AUC of each classifier was evaluated and compared among each other using the Mann–Whitney test. 9 To predict fracture, we analyzed the ROC curve of the best classifier and determined the cutoff value by maximizing accuracy. Based on the optimal cutoff value, we evaluated sensitivity and specificity. All variables with p < 0.05 were considered to be statistically significant.
Results
Patient population
The mean age of the patients in this study was 64.07 years. Thirty-two patients were female and 52 patients were male. Six patients had small cell lung cancer, and the other 78 patients had non-small cell lung cancer. All patients had bone metastasis in the proximal femur; 43 metastases were on the right femur, 28 were on the left femur, and 13 were on the bilateral femurs. The average Karnofsky performance status score in patients was 70 of 100; no patients scored under 30 or could not walk. Fifty-two patients had chemotherapy within 3 months. Of these, 30 patients had molecularly targeted therapy and 22 patients had treatment with conventional agents. Seventy-seven patients had external beam radiation therapy on the femoral lesion during the follow-up period (Table 3).
Demographic characteristics of the study population.

RT: radiation therapy.
Clinical risk factors for fracture in the metastatic proximal femur: Descriptive analysis using multivariate logistic regression analysis
To identify clinical risk factors for pathologic fracture in the proximal femur within 3 months, we performed logistic regression analysis. In multivariate logistic regression, female sex (odds ratio = 0.25, p = 0.0126), osteolysis (odds ratio = 7.62, p = 0.0239), and absence of radiation therapy (odds ratio = 10.25, p = 0.0258) significantly increased the risk of pathologic fracture in proximal femur.
Predictive analysis with machine learning algorithm: Comparison of combination of CT-based radiological and clinical features versus only CT-based radiological features
The optimized classifiers were trained with the bootstrap training samples and tested with the corresponding bootstrap test samples. In the group of the predictive models trained with CT-based radiological features, LDA showed the highest AUC (0.62 ± 0.19). In the group of the predictive models trained with CT-based radiological and clinical features, GB showed the highest AUC (0.80 ± 0.14; Figure 3). The best predictive models of both groups were compared using the Mann–Whitney test. The GB predictive model trained with CT-based radiological and clinical features showed significantly higher accuracy (0.76 ± 0.13; p < 0.0001) and AUC (0.80 ± 0.14; p < 0.0001) compared to accuracy (0.62 ± 0.03) and AUC (0.62 ± 0.19) of the LDA predictive model trained with CT-based radiological features (Figure 4). Based on the ROC curves of GB predictive model, we found the cutoff value was 0.65. Based on the cutoff value, the specificity was 80% and the sensitivity was 65%.

Predictive performances of the predictive models: combination of CT-based radiological and clinical features versus only CT-based radiological features. (a) ROC curve of predictive model trained with CT-based radiological features and clinical features. (b) ROC curve of predictive model trained with only CT-based radiological features. CT: computed tomography; ROC: receiver operating characteristic; SVM: support vector machine; LDA: linear discriminant analysis; GB: gradient boosting; RF: random forest.

Comparison of two machine learning classifier: gradient boosting versus linear discriminant analysis. (a) ROC curve of gradient boosting and linear discriminant analysis. (b) Box-and-whisker graph for AUC of gradient boosting and linear discriminant analysis. The AUC of the gradient boosting model was significantly higher than that of the other classifiers (p < 0.0001). ROC: receiver operating characteristic; AUC: area under the ROC curve; GB: gradient boosting; LDA: linear discriminant analysis.
Discussion
Machine learning algorithms combine many features together and construct an optimized mathematical equation to predict the target with least error. They can suggest an optimal direction within numerous dimensions that are not apparent to humans. Thus, machine learning algorithms should be useful in determining an optimal approach to multifactorial events such as pathological fractures.
In this study, we were able to combine CT-based radiological and clinical features together to predict pathological femoral fractures using machine learning algorithms. We demonstrated that predictive power of one predictive model trained with only CT-based radiological features using machine learning algorithms was similar with previous CT-based structural rigidity analysis, which showed 63% predictive accuracy. However, we demonstrated that the other predictive model trained with combination of CT-based radiological and clinical features showed superior predictive power for pathologic femoral fracture.
The GB is an ensemble method that uses multiple learning algorithms to obtain better predictive performance. The GB generates a predictive model through sequential education of decision tree. The sequential tree modifies the prediction errors of the previous tree to improve a predictive accuracy. In this study, through comparison analysis, we demonstrated that the GB was the best classifier for prediction of pathologic femoral fracture from five machine learning methods (AdaBoost, SVM, GB, LDA, and random forest).
Meanwhile, recent predictive models for pathologic fractures due to metastatic bone tumors were based on heterogeneous data from various types and locations of cancers. 10 –13 To reduce the bias caused by the heterogeneity of study group, we only studied a homogeneous group limited to patients with lung cancer. Furthermore, the location of metastasis was restricted to the proximal femur, which is the most vulnerable site to pathologic fractures. We believed that reducing heterogeneity was important to improve the accuracy of the outcome.
Conclusion
We found that the predictive model trained with combination of CT-based radiological and clinical features had superior predictive power for pathologic femoral fractures in patients with lung cancer. We believe that machine learning algorithms may be useful in the prediction of pathologic femoral fracture, which are multifactorial problem.
Footnotes
Declaration of conflicting interests
The author(s) declared no potential conflicts of interest with respect to the research, authorship, and/or publication of this article.
Funding
The author(s) received no financial support for the research, authorship, and/or publication of this article.