
Abstract
Preoperative prediction of hamstring tendon lengths and graft diameter for anterior cruciate ligament (ACL) reconstruction enables better preoperative planning. Presently, no study exists for Indian population where both derivation and verification of a mathematical equation for accurate prediction of hamstring graft dimensions have been done. This study was conducted in two phases: First phase (derivation cohort): devoted to the study of correlation of length of hamstring tendons and graft diameter with various anthropometric measurements in 123 patients undergoing ACL reconstruction. Length of semitendinosus (ST) was observed to have a strong correlation with leg length (r = 0.719), whereas that of gracilis (G) had a strong correlation with patient height (r = 0.768). Quadrupled diameter (QD) had a strong correlation with patient height and thigh length (r = 0.685 and 0.680, respectively). Using Pearson correlation coefficient, multiple stepwise linear regressions, and analysis of variance test, predictive equations were developed to predict the length of ST and G and QD. Second phase (verification cohort): This was a blinded prospective study done on 300 patients to further authenticate and test the accuracy of equations developed. Here, a steady correlation was found between the observed and predicted values of length of ST, G and QD, with correlation coefficients being 0.838, 0.847, and 0.767, respectively. Thus, we can safely conclude that clinically measurable anthropometric variables can reliably predict hamstring graft dimensions. This is likely to prove useful in better preoperative planning of ligament reconstructions.
Introduction
The most common surgical treatment of an anterior cruciate ligament (ACL)-deficient knee is reconstruction of the ligament by using an autograft, either a quadrupled semitendinosus and gracilis (STG) tendons-free hamstring graft, or a free “bone patellar tendon bone”(BPTB) graft. 1 In recent times, hamstring graft has gained wide popularity as it provides comparable stiffness and tensile properties in addition to better cosmesis and decreased donor site morbidity (i.e. anterior knee pain, kneeling discomfort) as compared to BPTB graft. 2,3 Availability of improved fixation devices like EndoButton and tight rope has also encouraged the use of hamstring graft. 4 However, there are concerns associated with the harvesting of STG graft. There is a substantial variability in the length of tendons being harvested and, hence, the diameter of the graft. 5 Since graft strength is directly related to cross-sectional area of the graft, a minimum of 7 mm of graft diameter has traditionally been recommended for the success of ACL reconstruction. 2,6 Moreover, revision ACL surgeries pose a bigger challenge where a larger-diameter graft is required. 7
In such situations, preoperative prediction of graft dimensions can prove to be useful. If the surgeon could reasonably predict that a patient’s hamstring graft would fall below a certain threshold, alternative graft choices could be undertaken before harvest. Previously, authors have attempted to find out the correlation of size of hamstring autograft with various anthropometric measurements. Some studies have also suggested equations for the same, but none of the studies have done blinded verification of the equations being derived. 2,4,6 –10 Since tendinous structures show variability in people of different ethnicities and racial origins, 11 this being the only study deriving and verifying an equation based on anthropometric measurements in Indian population can prove useful in preoperative prediction of graft dimensions in Indian scenario.
With this background, the present study was conducted to explore any relationship between anthropometric variables like height, weight, leg length, thigh length, and normal (contralateral) thigh circumference and length of semitendinosus and gracilis tendons as well as quadrupled STG graft diameter and to develop an equation using the strongly correlated predictor variables. The predictive equation was then put to test in a sizeable number of patients to test its accuracy and reliability.
Materials and methods
The present study was approved by the Institutional Ethics Committee. It was conducted in two phases.
Phase 1 (derivation cohort)
One hundred and twenty-three patients (108 males and 15 females) with chronic ACL insufficiency were included in this phase. Patients with open physis, bilateral ACL injuries and wasting of the normal (contralateral) thigh due to other reasons or generalized muscle wasting were excluded from the study. Preoperatively, various anthropometric variables including height, weight, leg length, thigh length, and contralateral thigh circumference of all the patients were measured. Leg length was measured from anterior superior iliac spine (ASIS) to medial malleolus (MM), thigh length from ASIS to lateral joint line (LJL), and thigh circumference was measured 15 cm proximal to the superior pole of patella on the normal (contralateral) thigh. Contralateral side was used for thigh circumference measurement as ipsilateral thigh muscles usually get wasted post ACL injury.
Intraoperatively, lengths of STG tendons were recorded on the graft harvesting board by splaying the tendons on board without any kinks in the same. The length of tendons has been calculated from the margin of severed insertions of STG tendons from their attachment on tibia (without raising the periosteal sleeve from the tibia) to the edge of the thinnest tail of the aponeurotic end (Figure 1).

Lengths of semitendinosus and gracilis tendons measured on graft harvesting board.
Diameter of the quadrupled STG graft was then measured using sizing tubes calibrated to 0.5 mm (Smith and Nephew Ltd., Mumbai, India; Figure 2). All measurements were taken immediately after harvesting the tendons before storing them in the moist gauge piece to avoid the confounding effect of swelling/drying of tendons after storage.

Quadrupled graft being passed through 0.5 mm incremented sizing tubes.
Statistical analysis
Bivariate correlation coefficient (Pearson r coefficient) was calculated to know the correlation between preoperative individual clinical anthropometric predictor variables and intraoperative graft measurements (outcome variables). Then, we calculated the regression coefficients using multiple linear regressions and analysis of variance (ANOVA) test was used to define which preoperative parameters had a stronger predictive role. A predictive equation was then developed from this data to predict the length of semitendinosus and gracilis tendons and quadrupled diameter of the graft.
Because of gross discrepancy in the sample size of males and females (108 vs. 15), nonparametric statistical test (Mann–Whitney test) and Wilcoxon test were used for comparing the difference of various variables among both the genders. Furthermore, Fisher r-to-z transformation was used to calculate value of z for the predictor and outcome variables in order to know the significance of difference of values of variables among the two genders. Finally, the accuracy of equations was tested by calculating the 95% confidence intervals of the difference in the standard errors of means of observed and predicted values.
Phase 2 (verification cohort)
This consisted of a blinded prospective study conducted on 300 patients of ACL injury with inclusion and exclusion criteria similar to that of phase 1 (derivation cohort). One co-investigator (same in all the patients but other than the one who did measurements in the first part of the study) had examined all the subjects preoperatively and recorded the anthropometric measurements as required in the equations derived from the first part of the study for prediction of graft size. The blinded principal investigator (same as in phase 1) operated upon all 300 patients and recorded the observed values of graft size in the operating room. Observed and predicted data were recorded separately. This phase of the study aimed at authenticating the equations derived in the first part.
Statistical analysis
The data was statistically analyzed using Pearson correlation coefficient (r) to see the correlation between observed and predicted values. Frequency tables were drawn by defining the frequency intervals of 10 mm (difference between observed and predicted values) for lengths of ST and G and frequency intervals of 0.5 mm for quadrupled diameter (QD) to know the percentage of subjects falling into each frequency interval. Bland and Altman charts were used to know the 95% confidence intervals of the difference between the observed and predicted values.
Results
Phase 1 (derivation cohort)
There were 108 males and 15 females with an average age of 27 years (range 18–42 years). Details of anthropometric measurements are given in Table 1.
Mean values of various anthropometric variables in 123 patients.
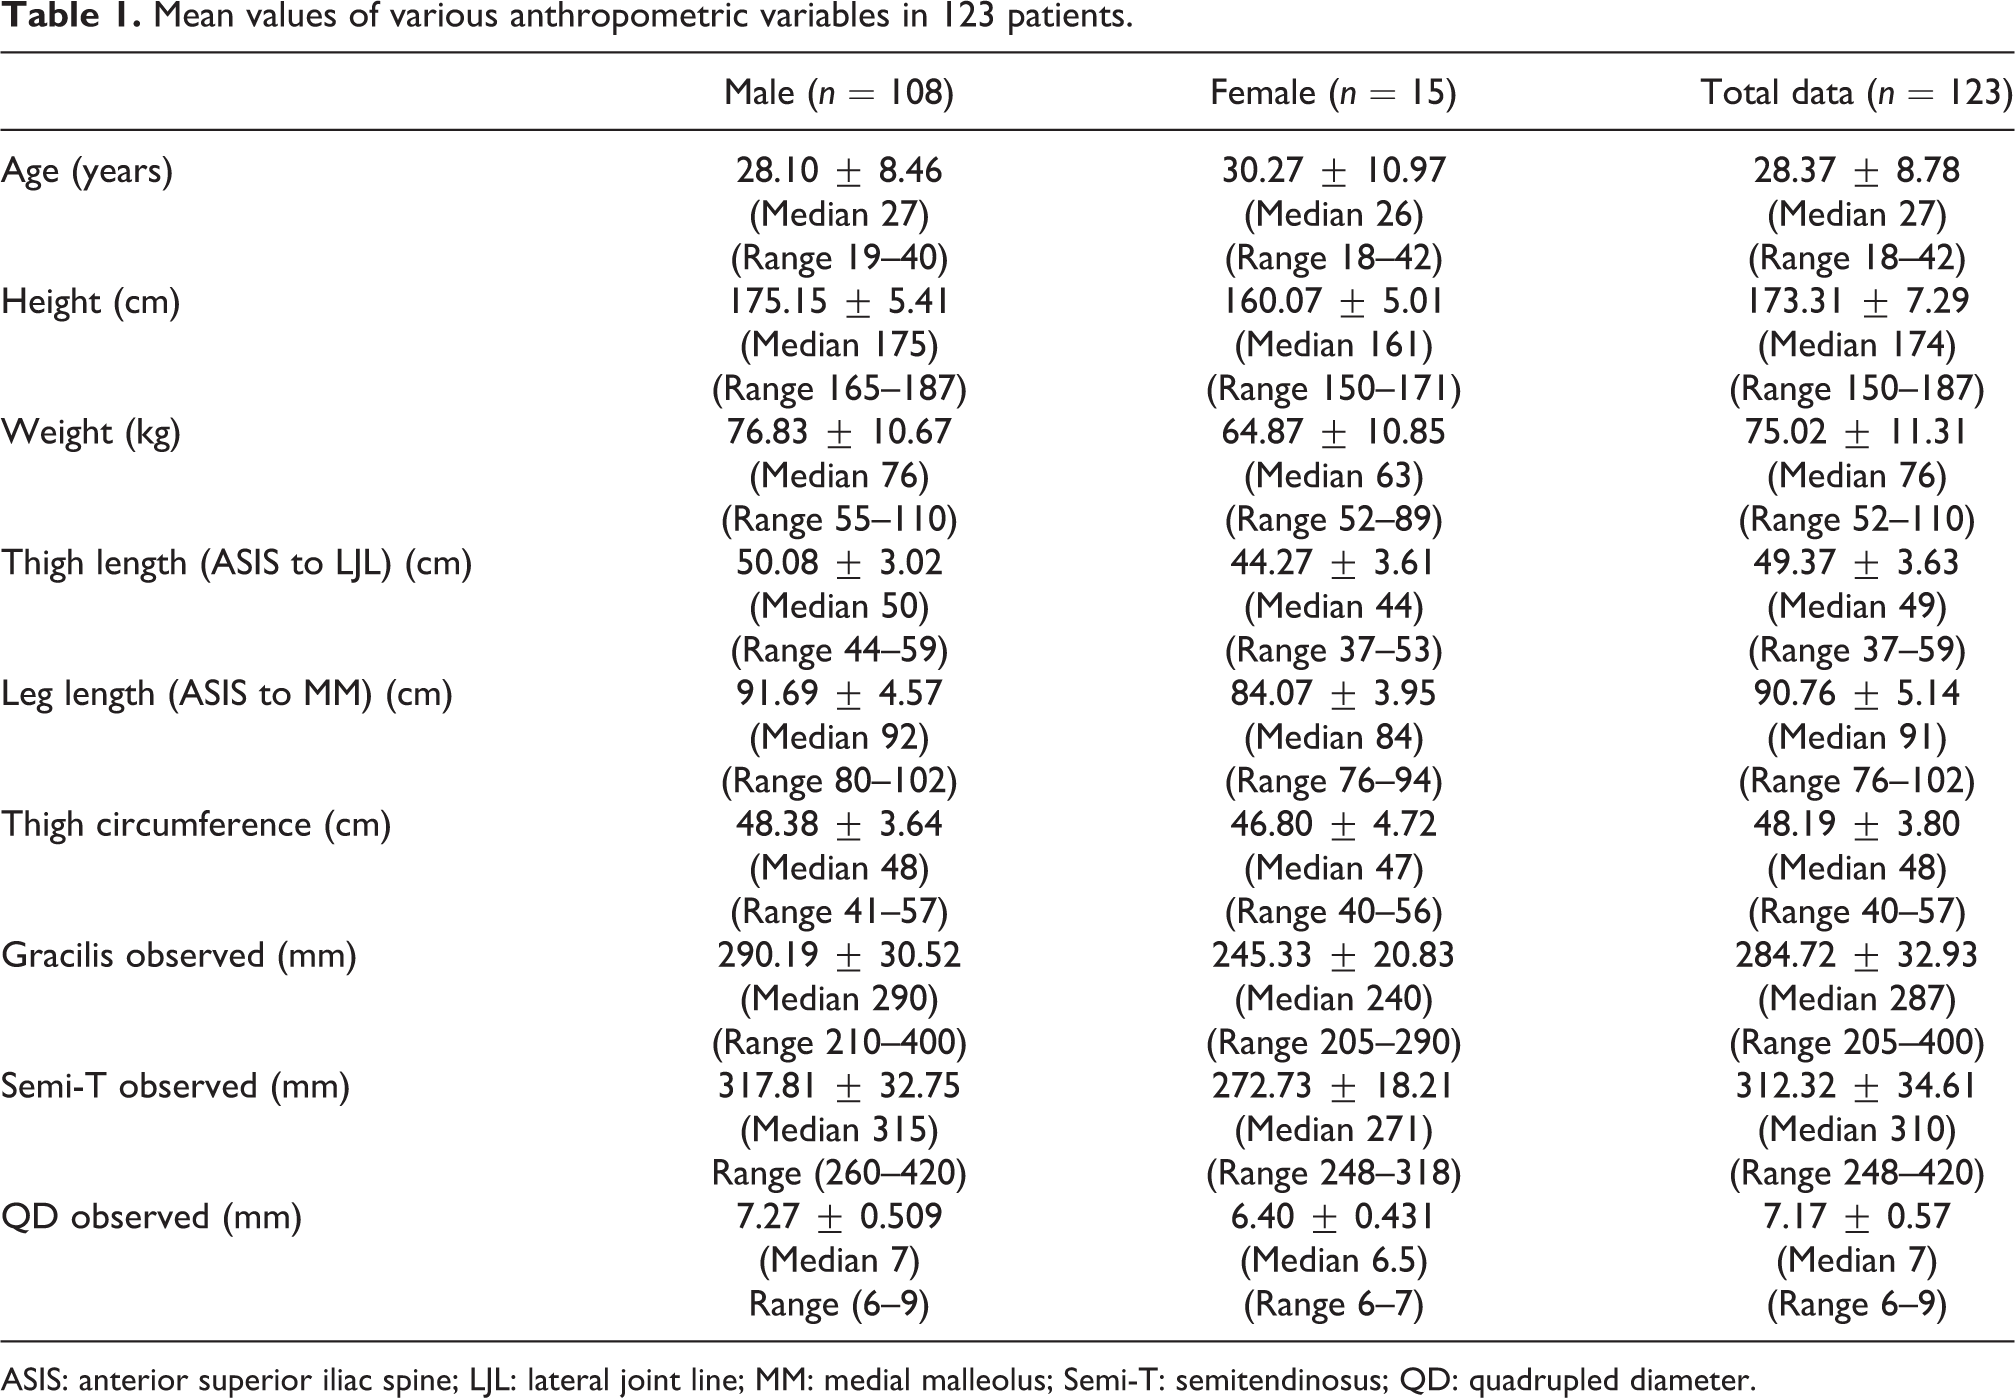
ASIS: anterior superior iliac spine; LJL: lateral joint line; MM: medial malleolus; Semi-T: semitendinosus; QD: quadrupled diameter.
Through regression analysis, all the outcome variables were observed to have a significant positive relationship with all the predictor anthropometric variables (Table 2).
The correlation values (Pearson coefficient, r) of all the predictor variables in relation to the outcome variables and also the z values to know the significance of gender effect on various variables.

F: Female; M: Male; G: gracilis; ST: semitendinosus; QD: quadrupled diameter; NS: nonsignificant, z: Fischer r to z transformation test.
aSignificant correlation (p < 0.05).
bStrongly significant correlation (p < 0.01).
However, variables with stronger predictive values arrived using the ANOVA test included: leg length (r = 0.719) for semitendinosus (ST); height (r = 0.768) for gracilis (G); and height and thigh length (r = 0.685 and 0.680, respectively) for QD; weight showed medium correlation with ST, G, and QD (r = 0.428, 0.476, and 0.447, respectively) and thigh circumference showed weak correlation with ST, G, and QD (r= 0.253, 0.300, and 0.325, respectively). Using the positive correlations, the following equations were developed:


Finally, 95% confidence interval of difference in the standard error of means of observed and predicted values from the evolved equations was calculated to be –4.18938 to +4.09054 for ST, –3.62712 to +3.76887 for G, and −0.02570 to +0.11523 for QD. Figures 3 to 5 show the pattern of actually observed and subsequently calculated values from the equations for the measurements of ST, G, and QD, which gives an insight into the deviation of individual values in 123 patients. Since these predicted measurements were calculated retrospectively after deriving the equations from the actual observed values, no blinding could be observed. Thus, the second phase of the study was performed to remove this bias and further authenticate our equations.
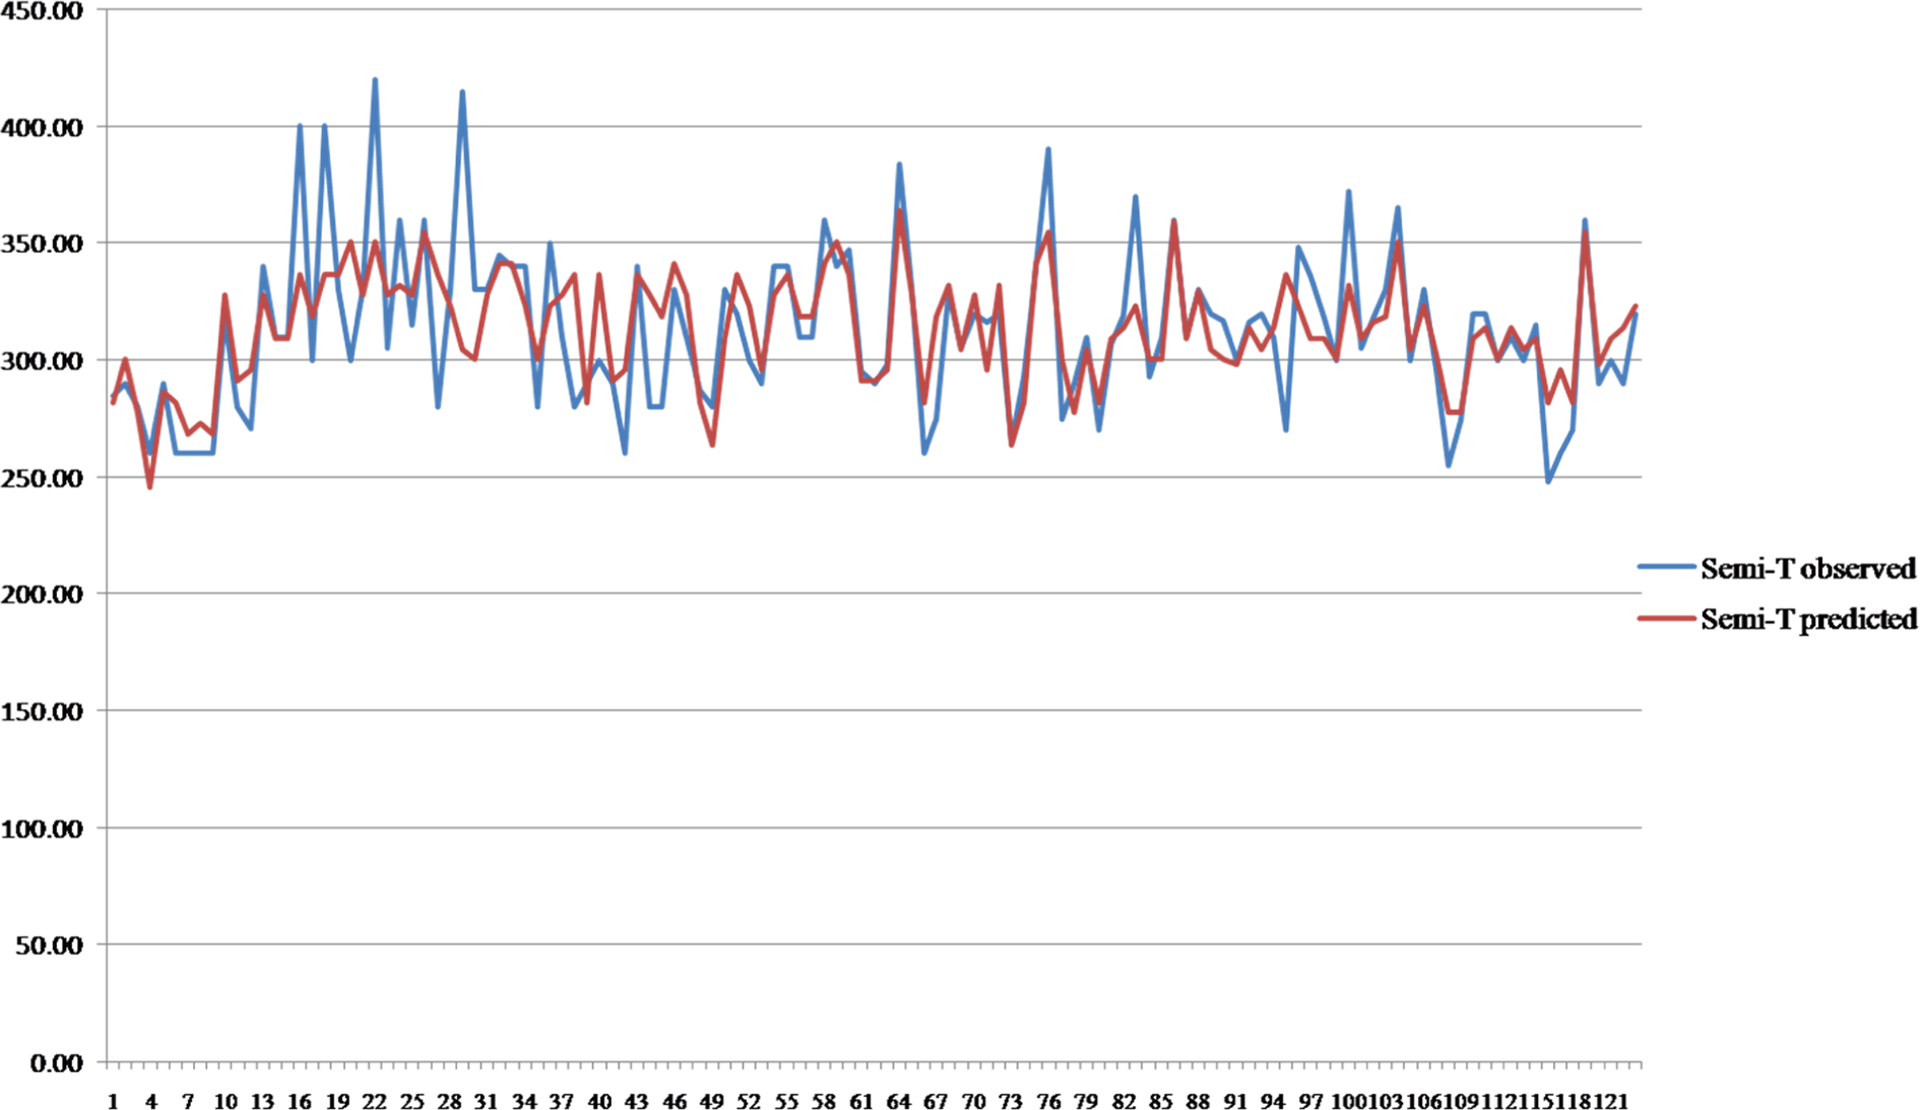
Correlation between observed and predicted length of semitendinosus in 123 patients in the first phase of the study.

Correlation between observed and predicted length of gracilis in 123 patients in the first phase of the study.

Correlation between observed and predicted diameter of quadrupled STG graft in 123 patients in the first phase of the study. STG: semitendinosus and gracilis.
Phase 2 (verification cohort)
Three hundred patients (206 males and 94 females) with an average age of 27 years (16–46 years) were included. Details of anthropometric measurements are given in Table 3. Intraoperative measurements of graft parameters as against the predicted ones from the equations are tabulated in Table 4.
Mean values of various anthropometric variables in 300 patients.

ASIS: anterior superior iliac spine; LJL: lateral joint line; MM: medial malleolus; QD: quadrupled diameter.
Paired sample statistics in 300 patients in v cohort.
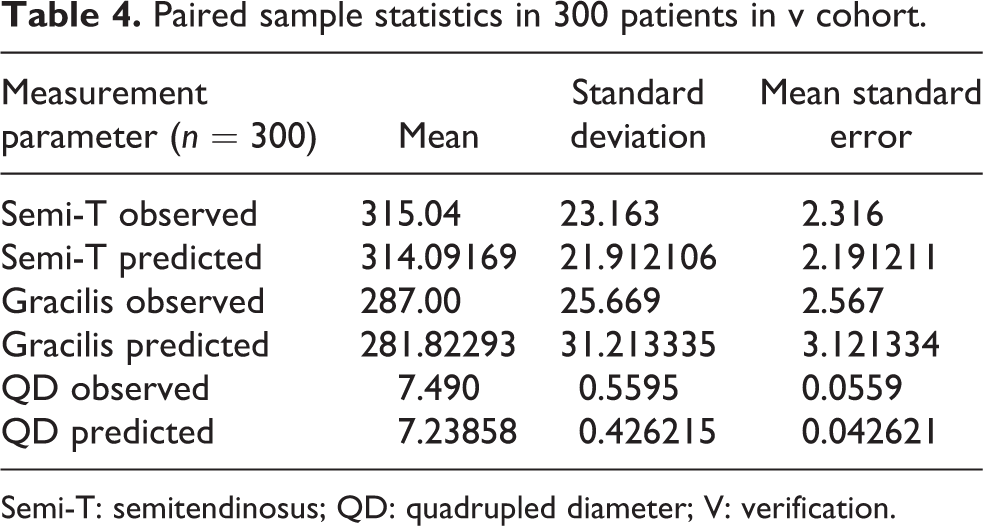
Semi-T: semitendinosus; QD: quadrupled diameter; V: verification.
Paired sample correlations of observed and predicted values in 300 patients in the second phase of the study.

Semi-T: semitendinosus; QD: quadrupled diameter.
Figures 6 to 8 show the graphic representation of correlation between observed and predicted values in 300 patients.

Correlation between observed and predicted semitendinosus length in 300 patients in the second phase of the study.

Correlation between observed and predicted gracilis length in 300 patients in the second phase of the study.
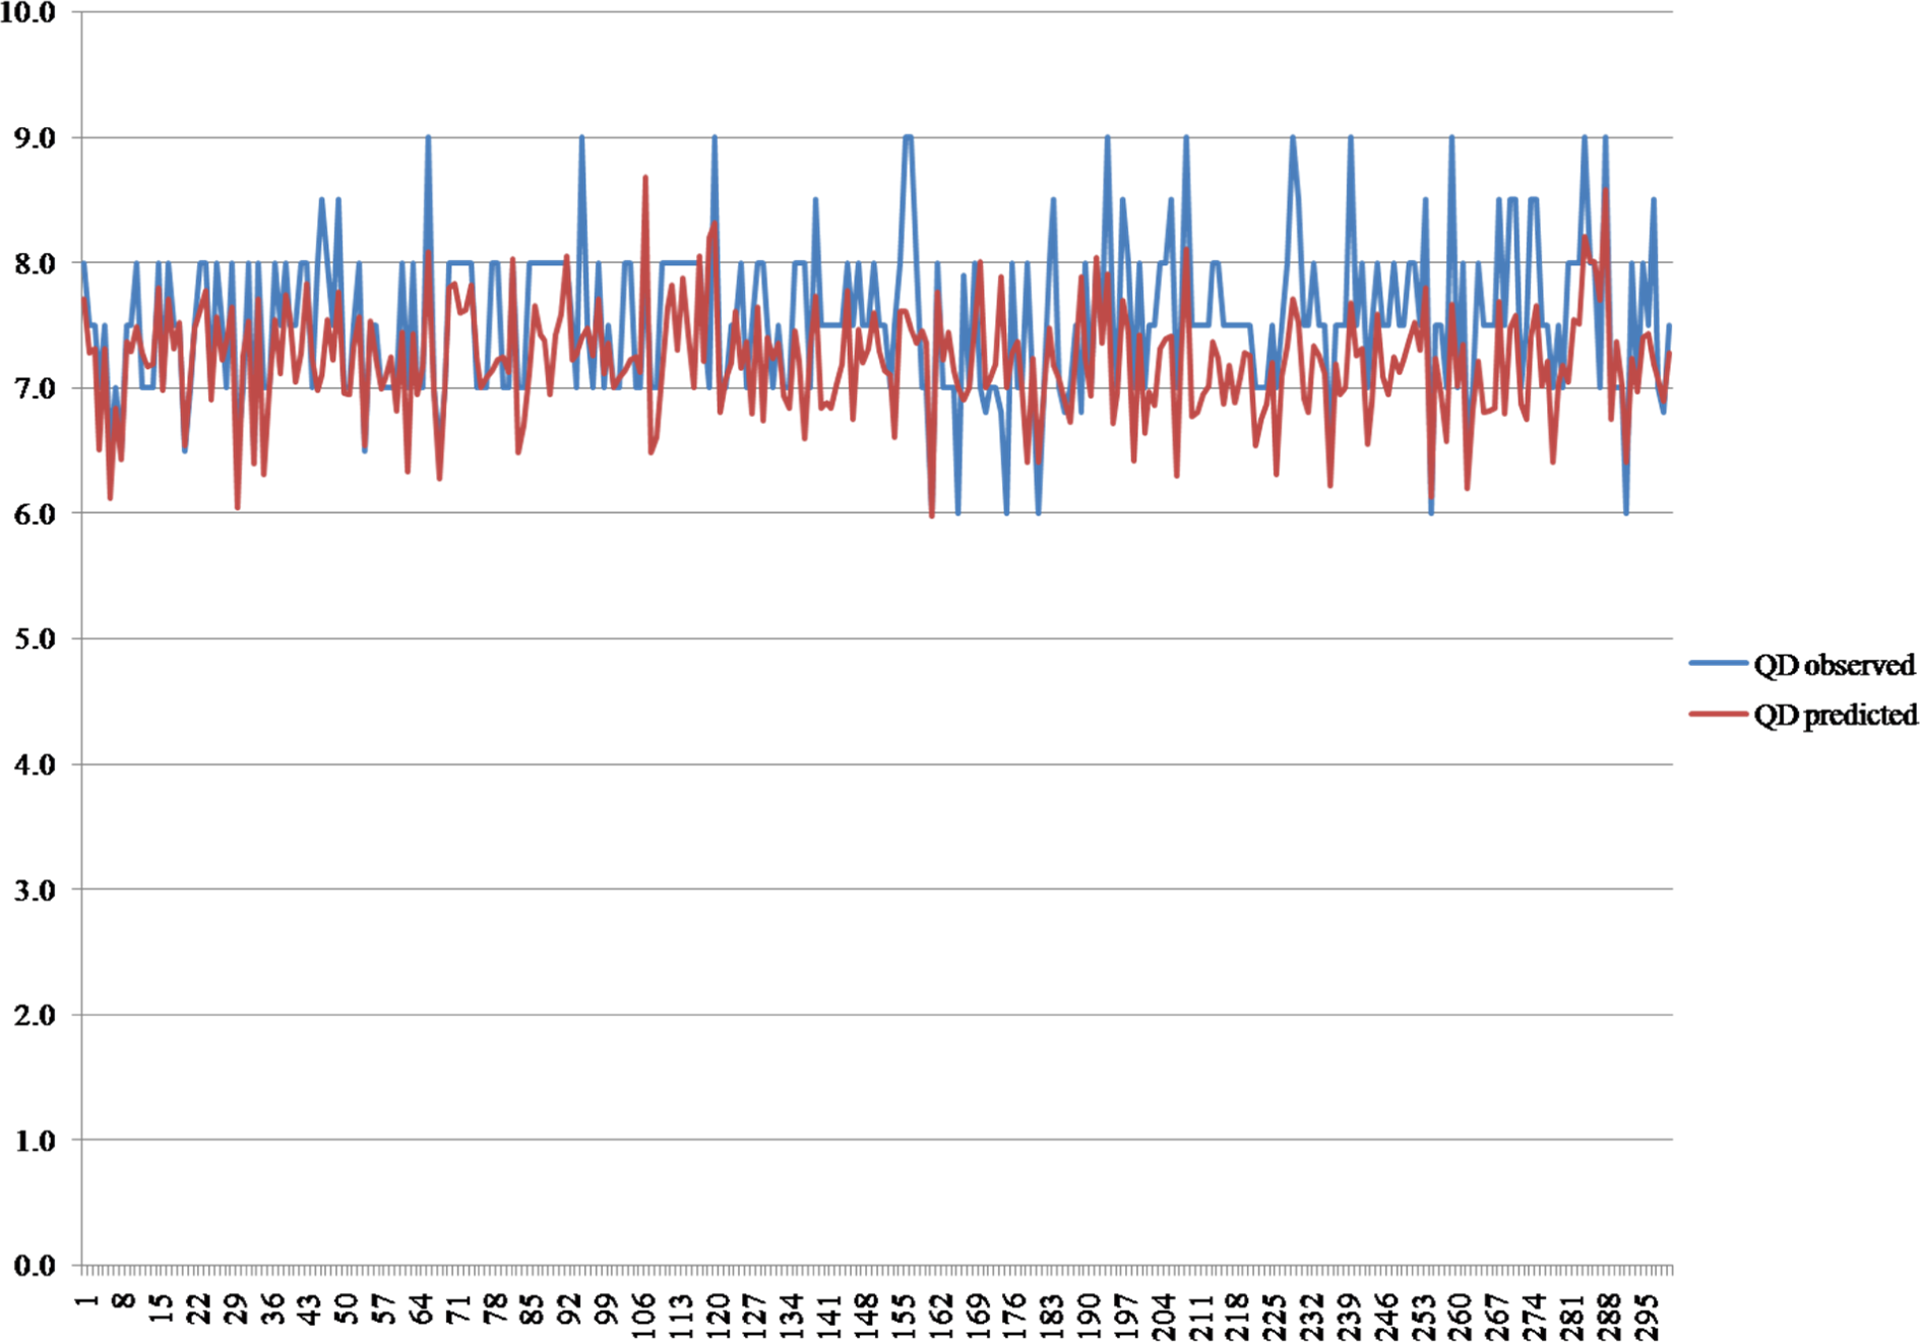
Correlation between observed and predicted quadrupled STG graft diameter in 300 patients in the second phase of the study. STG: semitendinosus and gracilis.
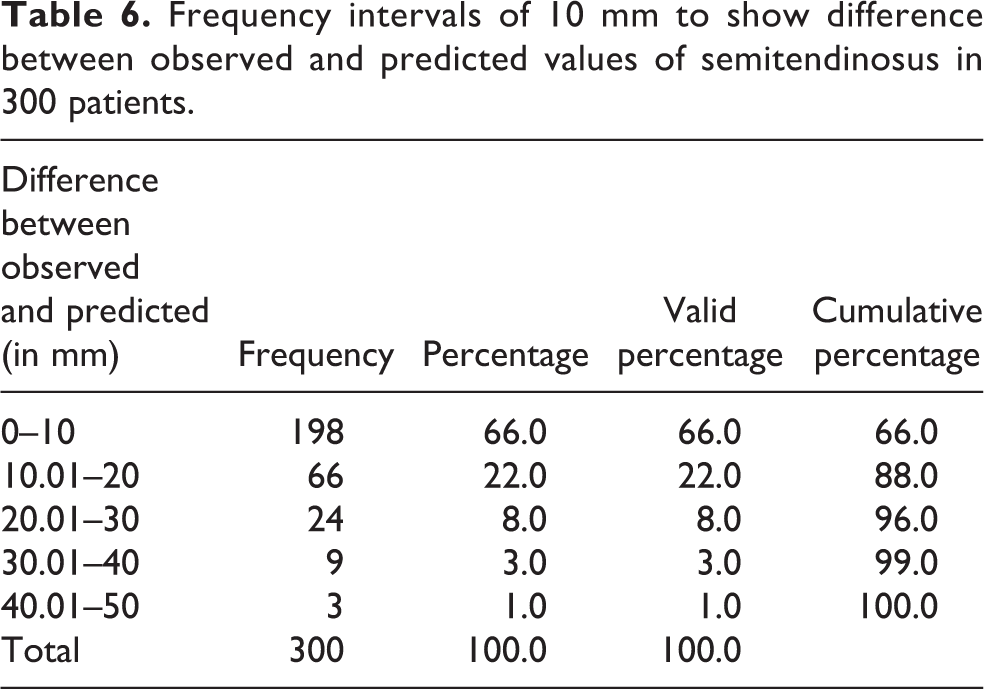
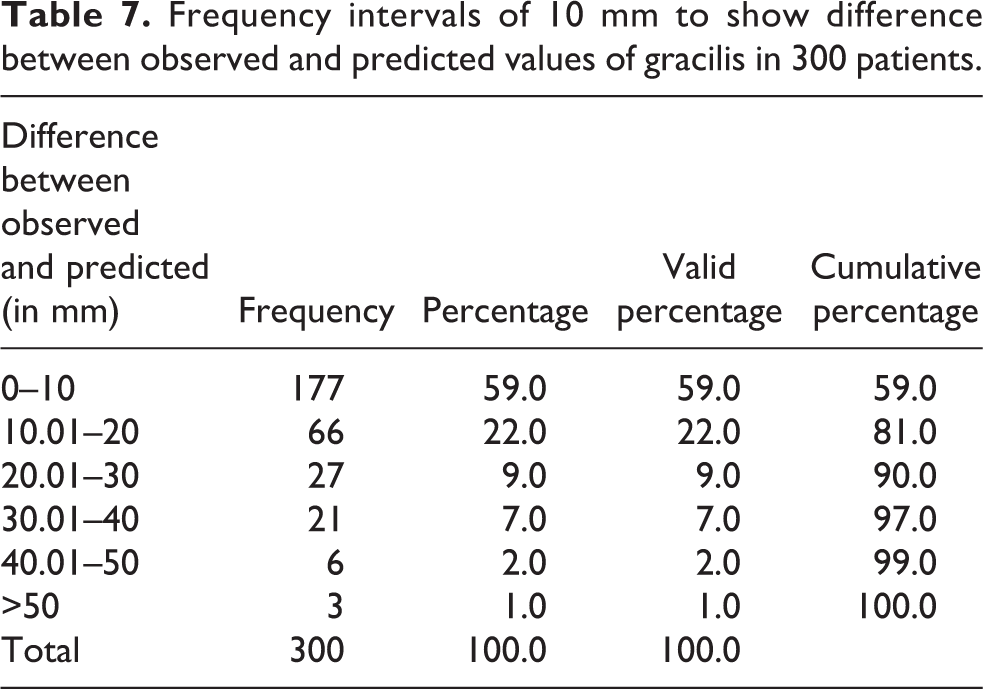
Difference between the observed and predicted values for ST was less than 10 mm in 66% of patients and less than 20 mm in 88% of patients; 96% of the observed values of ST were within 30 mm of predicted ones (Table 6); 59% of patients had observed values of G within 10 mm of the predicted ones whereas 81% of patients had a difference between observed and predicted values of less than 20 mm; 90% of observed values of G were within 30 mm of the predicted ones (Table 7).
Frequency intervals of 10 mm to show difference between observed and predicted values of semitendinosus in 300 patients.
Frequency intervals of 10 mm to show difference between observed and predicted values of gracilis in 300 patients.
Of the patients, 81% had observed QD within 0.5 mm of the predicted one, whereas 96% of patients had a difference of 1 mm between observed and predicted values (Table 8).
Frequency intervals of 0.5 mm to show difference between observed and predicted values of quadrupled diameter in 300 patients.

Bland and Altman graph for ST showed that 95% of the observed lengths of ST were within −31.2 mm and +27.2 mm of the predicted values (Figure 9).

Bland–Altman graph showing 95% CI for ST length in 300 patients. CI: confidence interval; ST: semitendinosus.
Bland and Altman graph for G showed that 95% of the observed lengths of G were within −24.4 mm and +31.2 mm of the predicted values (Figure 10).

Bland–Altman graph showing 95% CI for G length in 300 patients. CI: confidence interval; G: gracilis.
Bland and Altman graph for QD showed that 95% of the observed graft diameters were within −0.57 mm and +1.23 mm of the predicted ones (Figure 11).
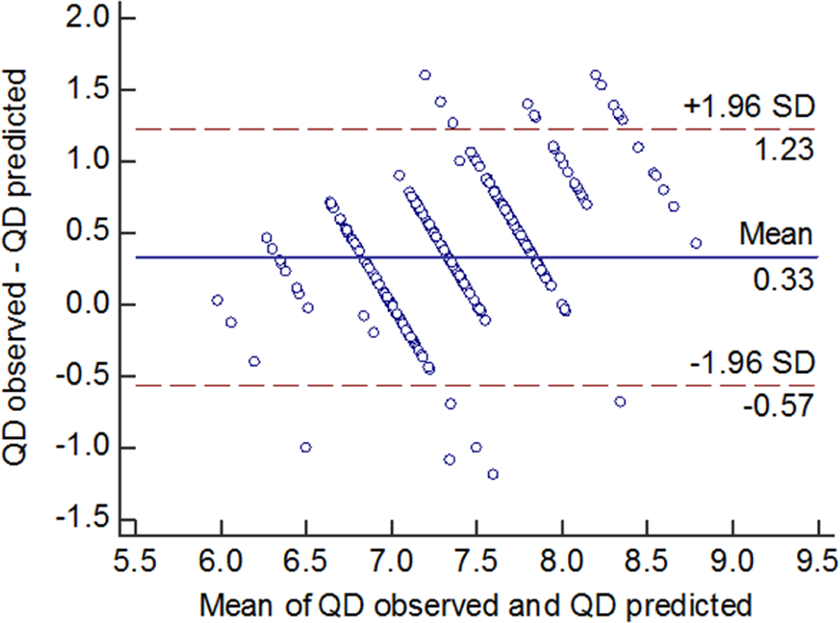
Bland–Altman graph showing 95% CI for QD in 300 patients. CI: confidence interval; QD: quadrupled diameter.
Discussion
In the literature, there are studies which have correlated graft size with various anthropometric measurements such as age, gender, height, weight, BMI, leg length, thigh length, and thigh circumference. 2,4,6 –10 The correlation of height with hamstring graft size is most consistent in literature. 2 Some of the authors have also proposed an equation for preoperative prediction of hamstring graft size. Tuman et al. 9 and Treme et al. 8 predicted an equation for expected graft diameter with patient’s height being the sole variable. This study was based on anthropometric measurements in Caucasian population. Goyal et al. 2 used the equation derived by Tuman et al. and did a study in Indian scenario. Tendinous structures are known to present variably in subjects of different ethnicities and racial origins. 11 Hence, Asif et al. proposed the first predictive equation based on anthropometric data collection in Indian population. 12 However, none of the studies have come up with a blinded verification cohort to test the accuracy of equation being derived. To address this lacuna in world literature, we conducted a second phase (blinded verification cohort) of the study to determine the authenticity and accuracy of our equation. Statistically, we found excellent correlation between the predicted and observed values of all three outcome variables, that is, the length of ST and G and the QD.
Additional strength of our study in comparison to the study of Tuman et al., Treme et al., and Asif et al. lies in the inclusion of a larger data of 123 patients in the first phase and 300 patients in the second phase, in comparison to 106, 50, and 46 patients in their studies, respectively.
In our study, all the grafts were harvested by the same surgeon and all the anthropometric measurements were made by the same observer in the first phase of the study and by another observer in the second phase. The reason for changing the observer was to find out any interobserver variations in the measurements of predictor variables that could affect the values of outcome variables. The results of the second phase of the study being similar to the first phase show that our equation can reasonably predict the values of length of ST, G, and QD preoperatively.
The strength of our study also lies in its prospective nature, allowing us to consider multiple clinical determinants at the same time and helping in establishing the strongest correlation between predictor variables and the size of graft statistically.
The weakness of the study lies in the inclusion of small female sample size, 15 and 27, in the first and second phases of the study, respectively, in comparison to 55 and 21 females in the studies by Tuman et al. and Treme et al., respectively. Furthermore, in contrast to these studies, we did not observe any separate correlation on the basis of gender; we specifically analyzed the effect of gender on the correlation coefficients (Pearson r) by finding out the z values by using Fisher r to z transformation and found no significant difference in the correlation of various predictor variables on the basis of gender (Table 2). However, we are of the opinion that to verify it further, more studies with larger number of females may be undertaken to know if there is actually any effect of gender.
Although we have tried to define the end points of harvested tendons, there can still be some variation in the technique of harvesting tendons by individual surgeons. Thus, applicability of our observations to other surgeons further needs to be studied in different regions of the world to validate whether the change of harvesting surgeon significantly affects the prediction of the equation and also to get an insight into the ethnic differences between the various races, as tendinous structures are known to present variably in subjects of different ethnicities and racial origins.
Having an idea about the length of hamstring tendons preoperatively can be helpful in harvesting only one tendon (instead of two), if the single tendon is long enough to give an adequate diameter of the quadrupled/tripled graft especially in cases of multiple ligament reconstruction and the saved tendon can be utilized later for future revision surgeries or for reconstructive procedures around the elbow or ankle joint. Also, the residual function of saved hamstring tendon may hasten the recovery process which can prove to be a boon for a sportsperson.
Studies show that hamstring harvest may decrease hamstring muscle strength for up to 9 months after surgery and may prove limiting to the athletic patient. 13 Scar formation, pain, operating time, and infection risk may also potentially be lowered by an accurate prediction of hamstring graft diameter, as we can preoperatively opt for alternative graft options in patients with a predicted hamstring graft diameter of less than 7 mm.
Therefore, the mathematical equations derived and also verified with prospective data in a blinded fashion in the present study can help in better preoperative planning of ligament reconstructions.
Conclusion
Present study showed that clinically measurable anthropometric variables can reliably predict hamstring graft dimensions. The length of ST had a strong correlation with leg length, whereas that of G had a strong correlation with height. QD had a strong correlation with height and thigh length. Since the correlation between observed and predicted values was strong in the blinded verification cohort, we can safely conclude that the predictive equations can reasonably predict the length of ST, G and QD preoperatively. This is likely to prove useful in better preoperative planning of ligament reconstructions.
Footnotes
Declaration of conflicting interests
The author(s) declared no potential conflicts of interest with respect to the research, authorship, and/or publication of this article.
Funding
The author(s) received no financial support for the research, authorship, and/or publication of this article.