
Abstract
Purposes:
When the evaluation of patellar instability is examined from the aspect of the conical-cylindrical anatomy of the tibia, metric measurement parameters such as the tuberositas tibia (TT)–trochlear groove (TG) and patellar tendon (PT) insertion–trochlear groove (TG) distances are not sufficient. We asked whether defined angular parameters reveal the rotational movement of the tuberositas tibia on the tibia shaft, additional to the metric parameters and there is a correlation between the metric and angular parameters.
Methods:
19 patients with patellar instability and 22 patients without patellar instability were evaluated. For all patients, two angle and three length parameters were evaluated on the slices taken. Evaluations were made of the TT-TG, the midpoint of the PT insertion-TG distances, the anatomic midpoint of the dome of the TT-TG, the TG-PT angle, and the TG-dome angle (DA). The Pearson correlation test was used for the statistical analysis of correlations between groups.
Results:
A statistically significant increase was determined in the patellar instability group in the TG-DA and TG-PT angle values compared to the group without patellar instability (p < 0.05). In both groups, a positive and strong correlation was determined between the TT-TG and the TG-PT and dome of the TT-TG distances, but no statistically significant correlation was determined between the tuberositas TT-TG and TG-PT angle and TG-DA.
Conclusion:
Metric parameters may not be sufficient alone in the evaluation of patellar instability. Metric parameters should be supported by additional angular parameters which reveal the rotational movement of the TT on the tibia shaft.
Introduction
The four main elements which have an effect on patellar instability are lower extremity alignment, articular geometry, muscle, and ligamentous stabilizers. The underlying reasons are multifactorial and it is difficult to determine the main reason, 1 –7 which explains the ongoing controversy on the evaluation of instability and the treatment algorithm. Despite this controversial and complex situation, there are a basic limited number of surgical treatments which can be applied, of which, distal alignment applied either alone or combined, is the most important treatment step. 2,5,8 –10 The decision for distal alignment surgery is currently made on the criteria of an increased tuberositas tibia–trochlear groove (TT-TG) distance measured in the computed tomography (CT) and magnetic resonance imaging (MRI) evaluation. 2,3,5,11 –13 Here, there is a significant problem of the anatomic landmarks to be used in the measurement of this distance, for which, to date, various measurement methods have been proposed. 11,14 Another significant problem is the limit value of the distance and standardization.
Although the relationship of the tuberositas tibia with the tibia, which is a cylindrical bone, is not only linear, the single-axis TT-TG distance measurement maintains its importance in the decision for surgical treatment and the selection of the type of surgical procedure. 3,4,11,12,15,16 Despite its extensive use, in cases where the TT-TG distance is <20 mm, it may not be able to explain other cases seen to have instability. 17,18
In the current study, it was attempted to answer the following questions: (1) Are metric parameters alone sufficient in the evaluation of patellar instability? (2) Can angular parameters be defined which will reveal the rotational movement of the tuberositas tibia on the tibia shaft, additional to the metric parameters? And (3) Is there a correlation between the metric and angular parameters?
Materials and methods
Approval for this prospective study was granted by the local institutional review board. The study was started with a total of 44 patients, 22 with patellar instability (group I) and 22 without patellar instability (group II). During the follow-up period, three patients were lost from the instability group. Thus, final evaluation was made of a total of 19 patients with patellar instability and 22 patients without patellar instability. The instability group (group I) consisted of 13 females and 6 males with a mean age of 27.2 years (range, 19–50 years). At least one of the lateral patellar luxation, positive persistent apprehension sign, patellar incongruence (assessed by patellar tilt >20° and patellar subluxation) with cases were evaluated. Patients with a rheumatoid base, advanced stage gonarthrosis or patellar chondromalacia, congenital knee pathologies, advanced level ligament injuries, a history of septic arthritis, or Osgood–Schlatter sequelae were excluded. The group with no instability (group II) consisted of 15 females and 7 males with a mean age of 28.7 years (range, 19–45 years). There was no difference between the groups in terms of demographic characteristics of the patients (p > 0.05; Table 1). The patients with no instability included in the study were enrolled from those aged 19–50 years who presented at the polyclinic because of grades 1 and 2 chondromalacia, meniscopathy, baker cyst, and patellar tendinopathy.
Demographic data of the patients.a

BMI: body mass index.
aData are expressed as mean ± SD.
All examinations were performed on a 1.5 T whole body MRI system (Excite, General Electrics, Milwaukee, Wisconsin, USA) with a 33 mT/m maximum gradient capacity. Coronal, axial, and sagittal slices were obtained of all the patients with the knee in 30° flexion. Mechanisms were used conforming to the MRI to hold the knee in 30° flexion (Figure 1). Axial T2 fat-saturated turbo spin-echo sequence was used for measurements.

The apparatus conforming to the MRI, which was used to hold the knee in 30° flexion. MRI: magnetic resonance imaging.
All the radiological data of the patients was input to the picture archiving and communication system. To calculate the angles and lengths, the images were laid over each other using a photoshop program (Adobe Photoshop® CS4 and Adobe InDesign®). For all patients, two angle and three length parameters were evaluated on the slices taken at 30°. Evaluations were made of the TT-TG, the midpoint of the patellar tendon insertion-trochlear groove (PT-TG), the midpoint of the dome of the tuberositas tibia-trochlear groove (TD-TG), the trochlear groove-patellar tendon angle (GPA) and the trochlear groove-dome angle (GDA).
The TT-TG distance was assessed according to the Schoettle et al. method. 11 The first transverse craniocaudal image that depicted a complete cartilaginous trochlea was used to determine the deepest point within the trochlear groove. A line was drawn through the deepest point of the trochlear groove perpendicular to the posterior condyle tangent. A second line was drawn parallel to the trochlear line through the most anterior portion of the tibial tubercle. The distance between the two lines represented the TT-TG distance (Figure 2(a)). The PT-TG distance was measured between the deepest cartilaginous point of the trochlear groove and the center of the patellar tendon insertion on the tibial tuberosity. The mediolateral center of the patellar tendon at its insertion on the tibial tubercle on the most proximal MR image slice was selected as the tibial reference point for PT-TG distance (Figure 2(b)). The TD-TG distance was measured between the deepest cartilaginous point of the trochlear groove and the midpoint (not the most anterior point) of the dome of the tuberositas tibia. The widest section of the tuberositas tibia on the transverse slice was taken for evaluation (Figure 2(c)). The GPA was defined by measuring the angle between the line drawn to the deepest point of the cartilaginous trochlea from the posterior condylar axis and the perpendicular line drawn to the patellar tendon sectional axis at the patellar tendon insertion point (Figure 3(a)). The GDA was defined by measuring the angle between the line drawn to the deepest point of the cartilaginous trochlea from the posterior condylar axis and the perpendicular line drawn to the anatomic midpoint from the line joining the tibia and the dome of the tuberositas tibia (Figure 3(b)). The measurements were made by a senior radiologist (B.S.) and a senior orthopaedic surgeon (A.D.) independently of each other, both using a photoshop image program (Adobe Photoshop CS4 and Adobe InDesign software).

(a) Technique for measuring TT-TG distance. A line was drawn through the deepest point of the cartilaginous trochlear groove perpendicular to the posterior condyle tangent. A second line was drawn parallel to the trochlear line through the most anterior portion of the tibial tubercle. The distance between the two lines represented the TT-TG distance. (b) Technique for measuring TT-PT distance. The PT-TG distance was measured between the deepest cartilaginous point of the trochlear groove and the center of the patellar tendon insertion on the tibial tuberosity. (c) Technique for measuring TD-TG distance. The TD-TG distance was measured between the deepest cartilaginous point of the trochlear groove and the midpoint (not the most anterior point) of the dome of the tuberositas tibia. TT-TG: tibial tubercle–trochlear groove; TT-PT: tibial tubercle–patellar tendon; TD-TG: tuberositas tibia-trochlear groove; PT-TG: patellar tendon insertion-trochlear groove.
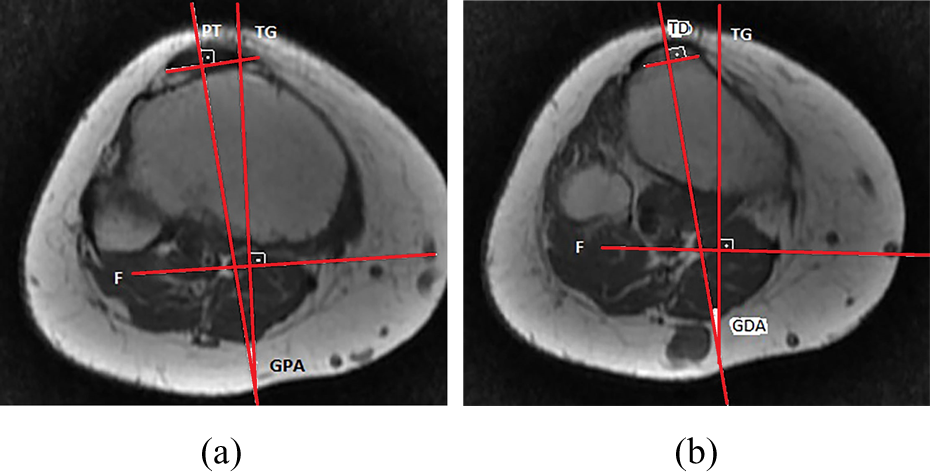
(a) Technique for measuring GPA angle. The angle between the line drawn to the deepest point of the cartilaginous trochlea from the posterior condylar axis and the perpendicular line drawn to the patellar tendon sectional axis at the patellar tendon insertion point. (b) Technique for measuring GDA angle. The angle between the line drawn to the deepest point of the cartilaginous trochlea from the posterior condylar axis and the perpendicular line drawn to the anatomic midpoint from the line joining the tibia and the dome of the tuberositas tibia. GPA: trochlear groove-patellar tendon angle; GDA: trochlear groove-dome angle.
Sample size was estimated using the dome angle as a primary effect variable. A difference was assumed of 10° in the mean values and 10° in the standard deviation (SD) values for each group. The group sample sizes of 22 and 22 achieved a power of 0.90 to detect a difference of 10° between the two groups with estimated group SD of 10 for each group and with a significance level (α) of 0.05 using a two-sided, two-sample test. Statistical calculations were performed using SPSS 20.0 software (SPSS Inc., Chicago, Illinois, USA). All data were calculated as mean ± SD. The Pearson correlation test was used for the statistical analysis of correlations between groups. Intraobserver interclass correlation coefficients (ICC) and interobserver ICC were assessed. A value of p < 0.05 was accepted as statistically significant.
Result
A statistically significant increase was determined in the group I in the GDA and GPA values compared to the group II (p < 0.05). The TT-TG distance was mean 12.64 ± 3.02 mm in the group II and mean 22.42 ± 8.6 mm in the group I, respectively. In the comparison of the two groups, the TT-TG distance was statistically significantly greater in the group II (p < 0.05; Table 2).
Comparison of the metric and angular parameters between two groups.
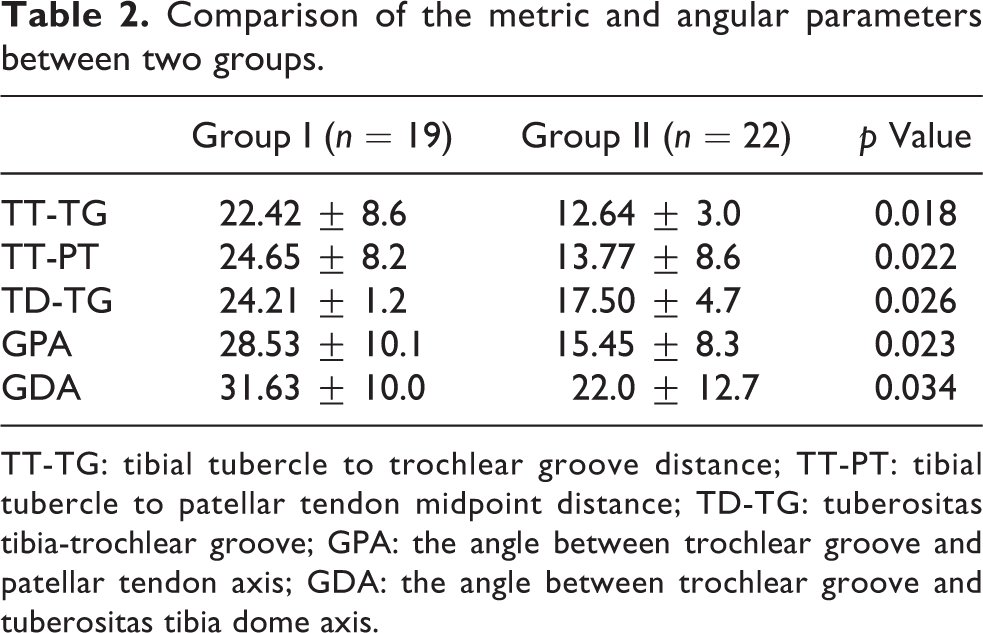
TT-TG: tibial tubercle to trochlear groove distance; TT-PT: tibial tubercle to patellar tendon midpoint distance; TD-TG: tuberositas tibia-trochlear groove; GPA: the angle between trochlear groove and patellar tendon axis; GDA: the angle between trochlear groove and tuberositas tibia dome axis.
In the group II, a positive and strong correlation was determined among the TT-TG, PT-TG, and TD-TG distances, but no statistically significant correlation was determined between the TT-TG and angular parameters (GPA and GDA; Table 3). In the group II, a positive and strong correlation was determined between metric parameters (TT-TG, PT-TG, TD-TG distances), but no statistically significant correlation was determined between the metric and angular parameters (GPA and GDA; Table 4). For the reliability of the measurements of the study, the interobserver ICC was 0.81 for TT-TG distance, 0.87 for PT-TG distance, 0.79 for TD-TG, 0.87 for GPA, and 0.93 for GDA. The intraobserver ICC was 0.87 for TT-TG distance, 0.91 for PT-TG distance, 0.85 for TD-TG, 0.94 for GPA, and 0.96 for GDA. Intra- and interobserver agreements were good and reliable for the measurements.
Correlation analysis of the group II.

TT-TG: tibial tubercle to trochlear groove distance; TT-PT: tibial tubercle to patellar tendon midpoint distance; TT-TD: tibial tubercle to tuberositas tibia apex of the dome; GPA: the angle between trochlear groove and patellar tendon axis; GDA: the angle between trochlear groove and tuberositas tibia dome axis.
Correlation analysis of the group I.

TT-TG: tibial tubercle to trochlear groove distance; TT-PT: tibial tubercle to patellar tendon midpoint distance; TT-TD: tibial tubercle to tuberositas tibia apex of the dome; GPA: the angle between trochlear groove and patellar tendon axis; GDA: the angle between trochlear groove and tuberositas tibia dome axis.
Discussion
The most significant finding of this evaluation of patellar instability was that the TT-TG distance alone could not be the measurement criteria and was accompanied by an angular change. In addition to this important finding, the study also showed that without correlation to the TT-TG distance value, the increase in the GPA and GDA angle values could be effective in the evaluation of patellar instability. The TT-TG distance is used as criteria to decide the severity of the instability and whether to apply surgery. A TT-TG distance of >20 mm is accepted as directly related to patellar instability and an indication for distal alignment surgery. 5,9 Studies in literature on the TT-TG distance have obtained different results. Some previous studies have shown no difference between two groups. 4,8 Although the TT-TG distance is used in the evaluation of patellar instability to make the decision for alignment surgery, quantitative evaluation has been shown to be very difficult in literature. 19,20 In the normal population, the TT-TG distance has been reported to be mean 13 mm. 5,8 In the current study, it was found to be mean 12.64 ± 3.02 mm in the group without instability (group II). If the threshold value is taken as 20 mm in general, even with the same measurement techniques, different values of TT-TG have been given in literature as the threshold value of instability. 2,12,21 In a study by Park et al. 21 of patients with patellar dislocation, the mean TT-TG distance was found to be 13 mm. Although this value was found to be statistically significantly higher than that of the group without instability in that study, it was reported to be a much lower value than that of previous studies. 21 There have been many studies in literature which do not conform with the criteria of a threshold value of 20 mm. 4,8,11 It has also been shown that these values may change according to whether the evaluation is by MRI or CT. 3 Again because of differences in the measurement points selected, standardized measurement of the TT-TG distance has not yet been achieved. 8,22 Changes may be seen according to the patient’s age, gender, and height. 5,8
Rather than the TT-TG distance, the PT-TG distance measurement can be used as a more functional measurement. The PT-TG distance uses the center of the patellar tendon insertion and is typically a few millimeters greater than the TT-TG distance. 16 In the current study, the change in the TT-TG distance and the change in the PT-TG distance were found to be correlated and the values were consistent with those in literature. Determination of the most prominent point of the tibial tuberosity is a matter of debate. 11,20 In addition, in the measurement of the PT-TG distance, because of the wide insertion of the patellar tendon, it is not specific at what level the midpoint should be measured. Therefore, in the determination of instability, which is a dynamic problem, in the current study, it was attempted to determine the location where the patellar tendon was fully held. Rather than defining the most prominent point of the tibial tuberosity according to the femoral condylar axis, in the current study, the midpoint of the TT was taken as the basis. Due to patellar tendon isometry, the measurement of the midpoint of the dome was thought to be more appropriate from a functional angle. From this, the midpoint of the dome of the tibial tuberosity was identified. When the anatomically most prominent point of the tibial tuberosity was used as a landmark, the TD-TG distance values were found to be mean 17.50 ± 4.7 mm in the group without instability and 24.21 ± 1.2 mm in the instability group, respectively. The changes between the two groups in the TD-TG value were seen to be similar to the changes in the TT-TG and PT-TG values. Therefore, it can be considered that the TD-TG point could be used as an alternative landmark.
In a study by Izadpanah et al., 18 it was reported that with weight-bearing when the image was taken at 0° in the MRI evaluation, the TT-TG distance was significantly reduced, but this change did not occur at 30°. Therefore, it was recommended that MR images are taken at 30° to discount the effects of muscles. 18 When the angular changes are examined, no statistically significant difference was determined within either group. However, there were significant differences between the two groups. A significant increase was determined in the angular parameters of the instability group. As the difference in the angular parameter values between the two groups was significant, these angular values were independent of the linear values (TT-TG, PT-TG, and TD-TG). The rotational change together with lateralization in instability was seen to be significant. In addition, there were cases in the instability group with normal and low TT-TG values. The common feature of these patients was the high angular values. As stated above, this was probably related to associating instability only to lateralization and overlooking the rotational component. To the best of our knowledge, there is no previous study in literature which has determined this.
A significant limitation of this study was the small number of patients. In addition, although there was a significant increase in the instability group, no angular base value was formed for cases which crossed the instability threshold. As the group II included patients with no patellar instability but with other knee joint pathologies, further studies with a control group of individuals with no knee complaints and not diagnosed with any knee joint pathology would provide a more generalized result.
Conclusion
A practical and reproducible method of measuring the TT-TG distance based upon a specific and reliable landmark in the tibia has been described in this study. However, because of different threshold values of TT-TG distance, it should not be considered for use alone. Metric parameters change independently of angular parameters in cases both with and without instability. Therefore, as a second variable to metric parameters, support is required with angular parameters.
Footnotes
Acknowledgments
We thank Dr Deniz Sokmen Ciliz and Dr Erman Ceyhan for their helps and contribution to the present study.
Declaration of conflicting interests
The author(s) declared no potential conflicts of interest with respect to the research, authorship, and/or publication of this article.
Funding
The author(s) received no financial support for the research, authorship, and/or publication of this article.