
Abstract
Introduction
In 2018, the United States spent $3.6 trillion on health care, totaling 17.7% of the national gross domestic product. 1 National surgical expenses have been reported to be as high as $572 billion in 2005 with projections to be >$900 billion in 2025. 2 Despite increasing national surgical expenditures, however, the average reimbursement for common reconstructive plastic surgery procedures decreased by 14% from 2000 to 2019. 3 Studies in other surgical specialties report similar findings with declining charges and payments to physicians for common operations.4–6 While the discrepancy between increasing national surgical spending and decreasing plastic surgery reimbursement rates has been demonstrated,3,7 there is almost no data on how these national financial trends have translated to specific plastic surgery procedures.
Reduction mammaplasty (RM), or breast reduction, is one of the most frequently performed operations in plastic and reconstructive surgery. According to statistics published by the American Society of Plastic Surgeons, more than 100,000 breast reduction procedures were performed in 2020 alone. 8 Numerous studies have investigated the cost-effectiveness and optimization of RM9,10; however, little is known about trends in physician and facility charges and reimbursements related to this common operation in recent years.
Evidence suggests that the clinical volume of specific procedures in plastic surgical practices is directly affected by reimbursement rates. 11 Given the well-documented clinical benefit and cost-effectiveness of RM,9,10,12,13 it is important to understand current trends in how this common operation is charged and reimbursed to ensure that it remains accessible to patients. In this study, we seek to shed light on the trends of charges and payments for ambulatory RM for both facilities and physicians. We hypothesized that reimbursement rates would be disproportionately increased for facilities compared to physicians based on current national trends in increasing national expenditures and decreasing operation reimbursements.
Methods
We utilized the PearlDiver patient records database (PearlDiver; http://www.pearldiverinc.com) to access the Medicare Standard Analytic Files. The database contains patient demographic characteristics, concomitant diagnoses, and associated cost data for patients with the International Classification of Diseases, Ninth Revision (ICD-9) diagnoses and procedures, or current procedural terminology (CPT) codes. The Standard Analytic Files dataset includes all Medicare beneficiaries from 2005 to 2014 with claims billed in fee-for-service Medicare.
Study Group
The dataset was queried for patients who underwent breast reduction using CPT code 19318. Each operative procedure was analyzed and tracked for an associated same-day anesthesia CPT code (CPT-00400, anesthesia for procedures on the integumentary system on the extremities, anterior trunk, and perineum; not otherwise specified; CPT-00402, reconstructive procedures on the breast [eg, reduction or augmentation mammoplasty, and muscle flaps]). The data was then filtered to identify both physician charges and payments for surgeon and anesthesia CPT codes and the associated facility charges and payments for these CPT codes. In this study, “charges” refer to the initial monetary value in dollars billed to the insurance agency (ie, Medicare) by the health care provider (eg, surgeon, anesthesiologist, or facility); “payments,” on the other hand, refer to the final monetary reimbursement rendered to the provider by Medicare as deemed appropriate based on its facility and physician fee schedules. To meet inclusion criteria, the patient record must include complete charge and payment data (surgeon CPT physician charge and payment, anesthesia CPT code physician charge and payment, and all CPT code hospital/facility charge and payment data points), and have valid age, gender, and region data. CPT codes were selected to identify charges and payments as Medicare utilizes CPT codes for ambulatory procedures, whereas inpatient procedures are typically coded with ICD-9, procedure codes. age, gender, geographical region, and Charlson comorbidity index (CCI) were assessed over the study period. All charge and payment data were adjusted for inflation and converted to 2014 dollars using consumer price index values available from the U.S. Bureau of Labor Statistics. 14
Two important values were calculated to allow comparison of hospital/facility and physician financial data: (1) the charge multiplier (CM), which is the ratio of hospital to surgeon charges, and (2) the payment multiplier (PM), which is the ratio of hospital to surgeon payments. 4 These calculated ratios reflect charges or payments by the hospital as a function of physician charges or payments, respectively. This ratio-based analysis accounts for factors, including regional cost differences or expenses, with the assumption that these factors equally influence charges and payments for both the hospital and physician. Between 2005 and 2014, the CM and PM trends were then identified for all patients undergoing the indicated outpatient reduction mammoplasty (RM) procedure and compared using a linear regression analysis. Trends in these ratios for individual regions (Northeast, Midwest, South, and West) were also evaluated and compared using a linear regression analysis. For all statistical comparisons, P < .05 was considered significant. All statistical analyses were completed using JMP 15.2.1 software (SAS Institute Inc.).
Results
Our review of Medicare Standard Analytic Files yielded 1001 patients who underwent breast reduction between 2005 and 2014. Patient age, geographical region, and CCI are reported (Table 1). The annual number of RMs performed remained relatively stable over the study period, as did the average patient CCI value (Table 1). Similarly, patient age remained stable over the study period, though the representation of certain regions fluctuated year-to-year (Table 1).
Ambulatory Breast Reduction Patient Profiles by Year.
Abbreviations: CCI, Charlson comorbidity index; SD, standard deviation.
Data presented are numbers and (%) values. Unknown values are represented with “#.”
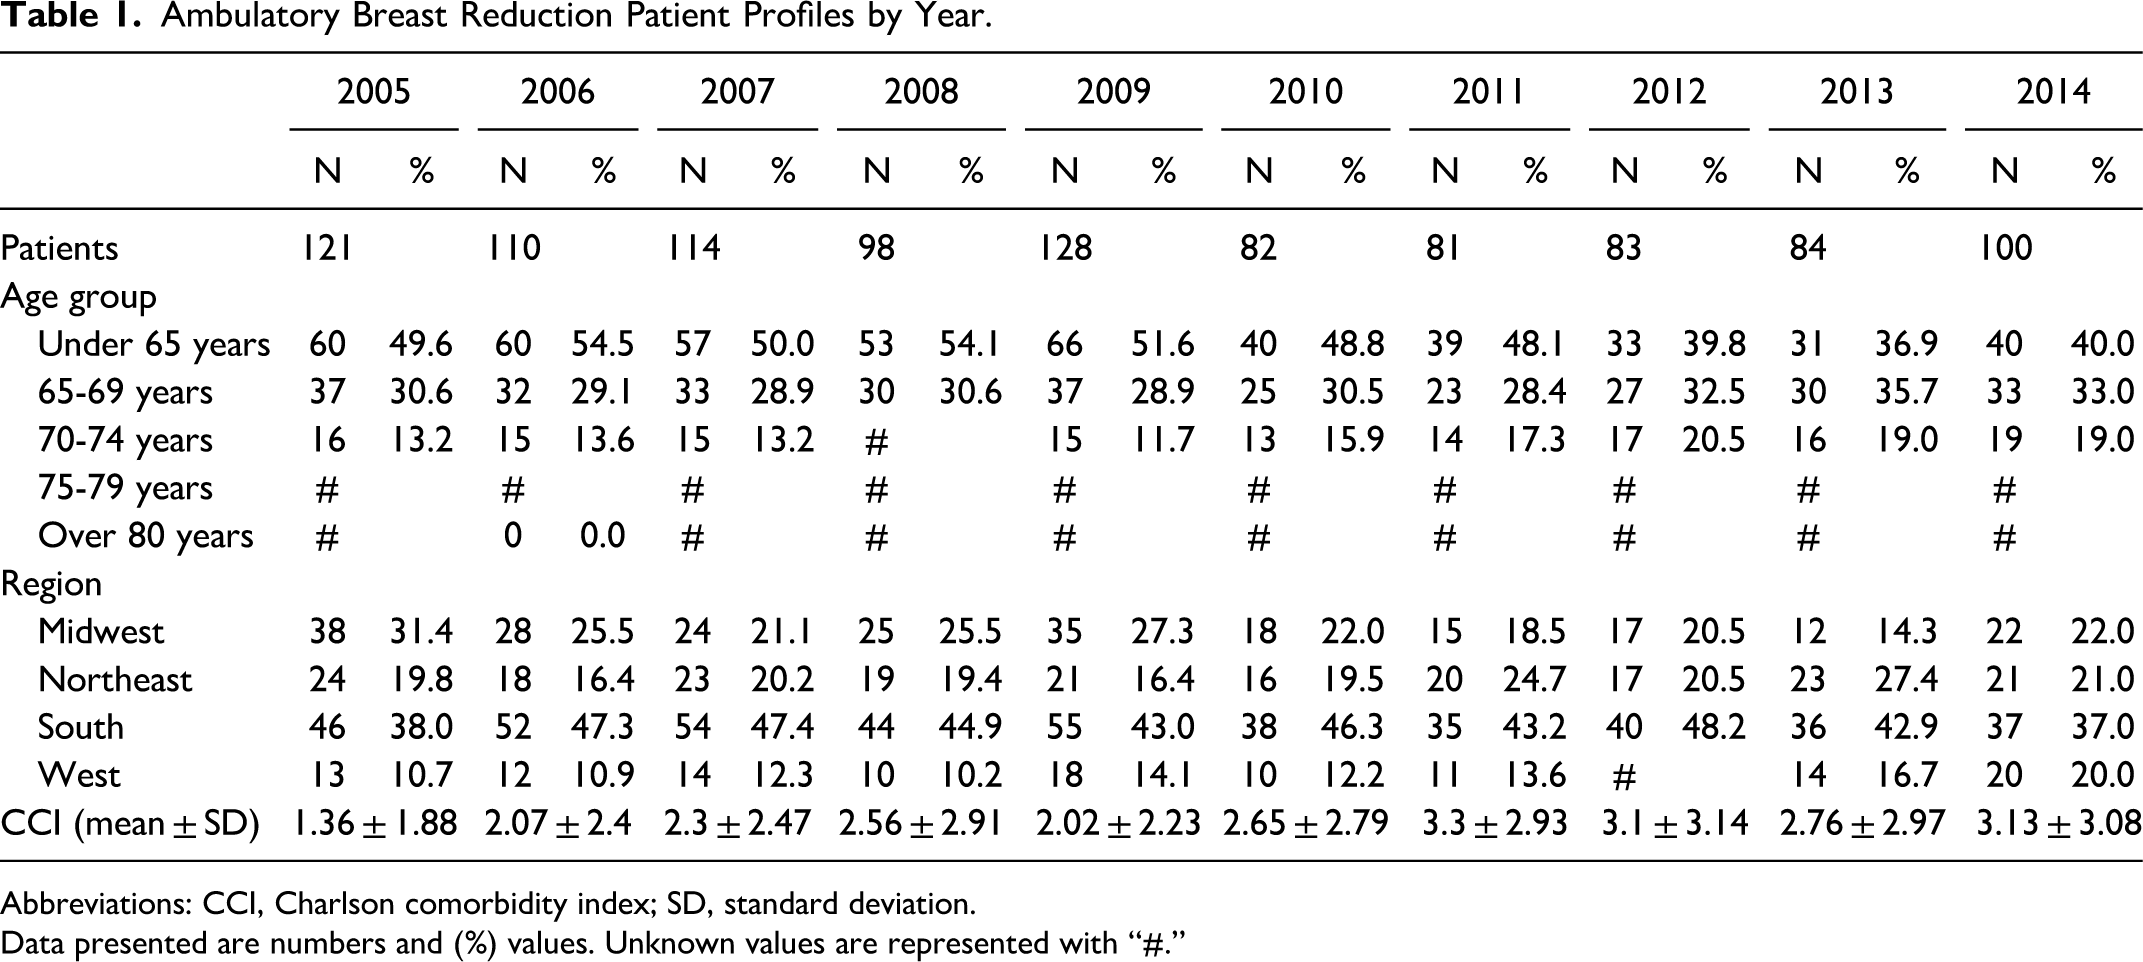
Our data indicate that from 2005 to 2014, the facility charge for RM per patient in inflation-adjusted dollars increased from $8477 to $11,102 (31% increase; p < .0005); the surgeon charge increased from $7088 to $7199 (2% increase; p = .0009); and the anesthesiologist charge increased from $2271 to $2380 (5% increase; p < .0005) (Figure 1).
Reduction mammoplasty (RM) charges per patient for facilities, surgeons, and anesthesiologists.
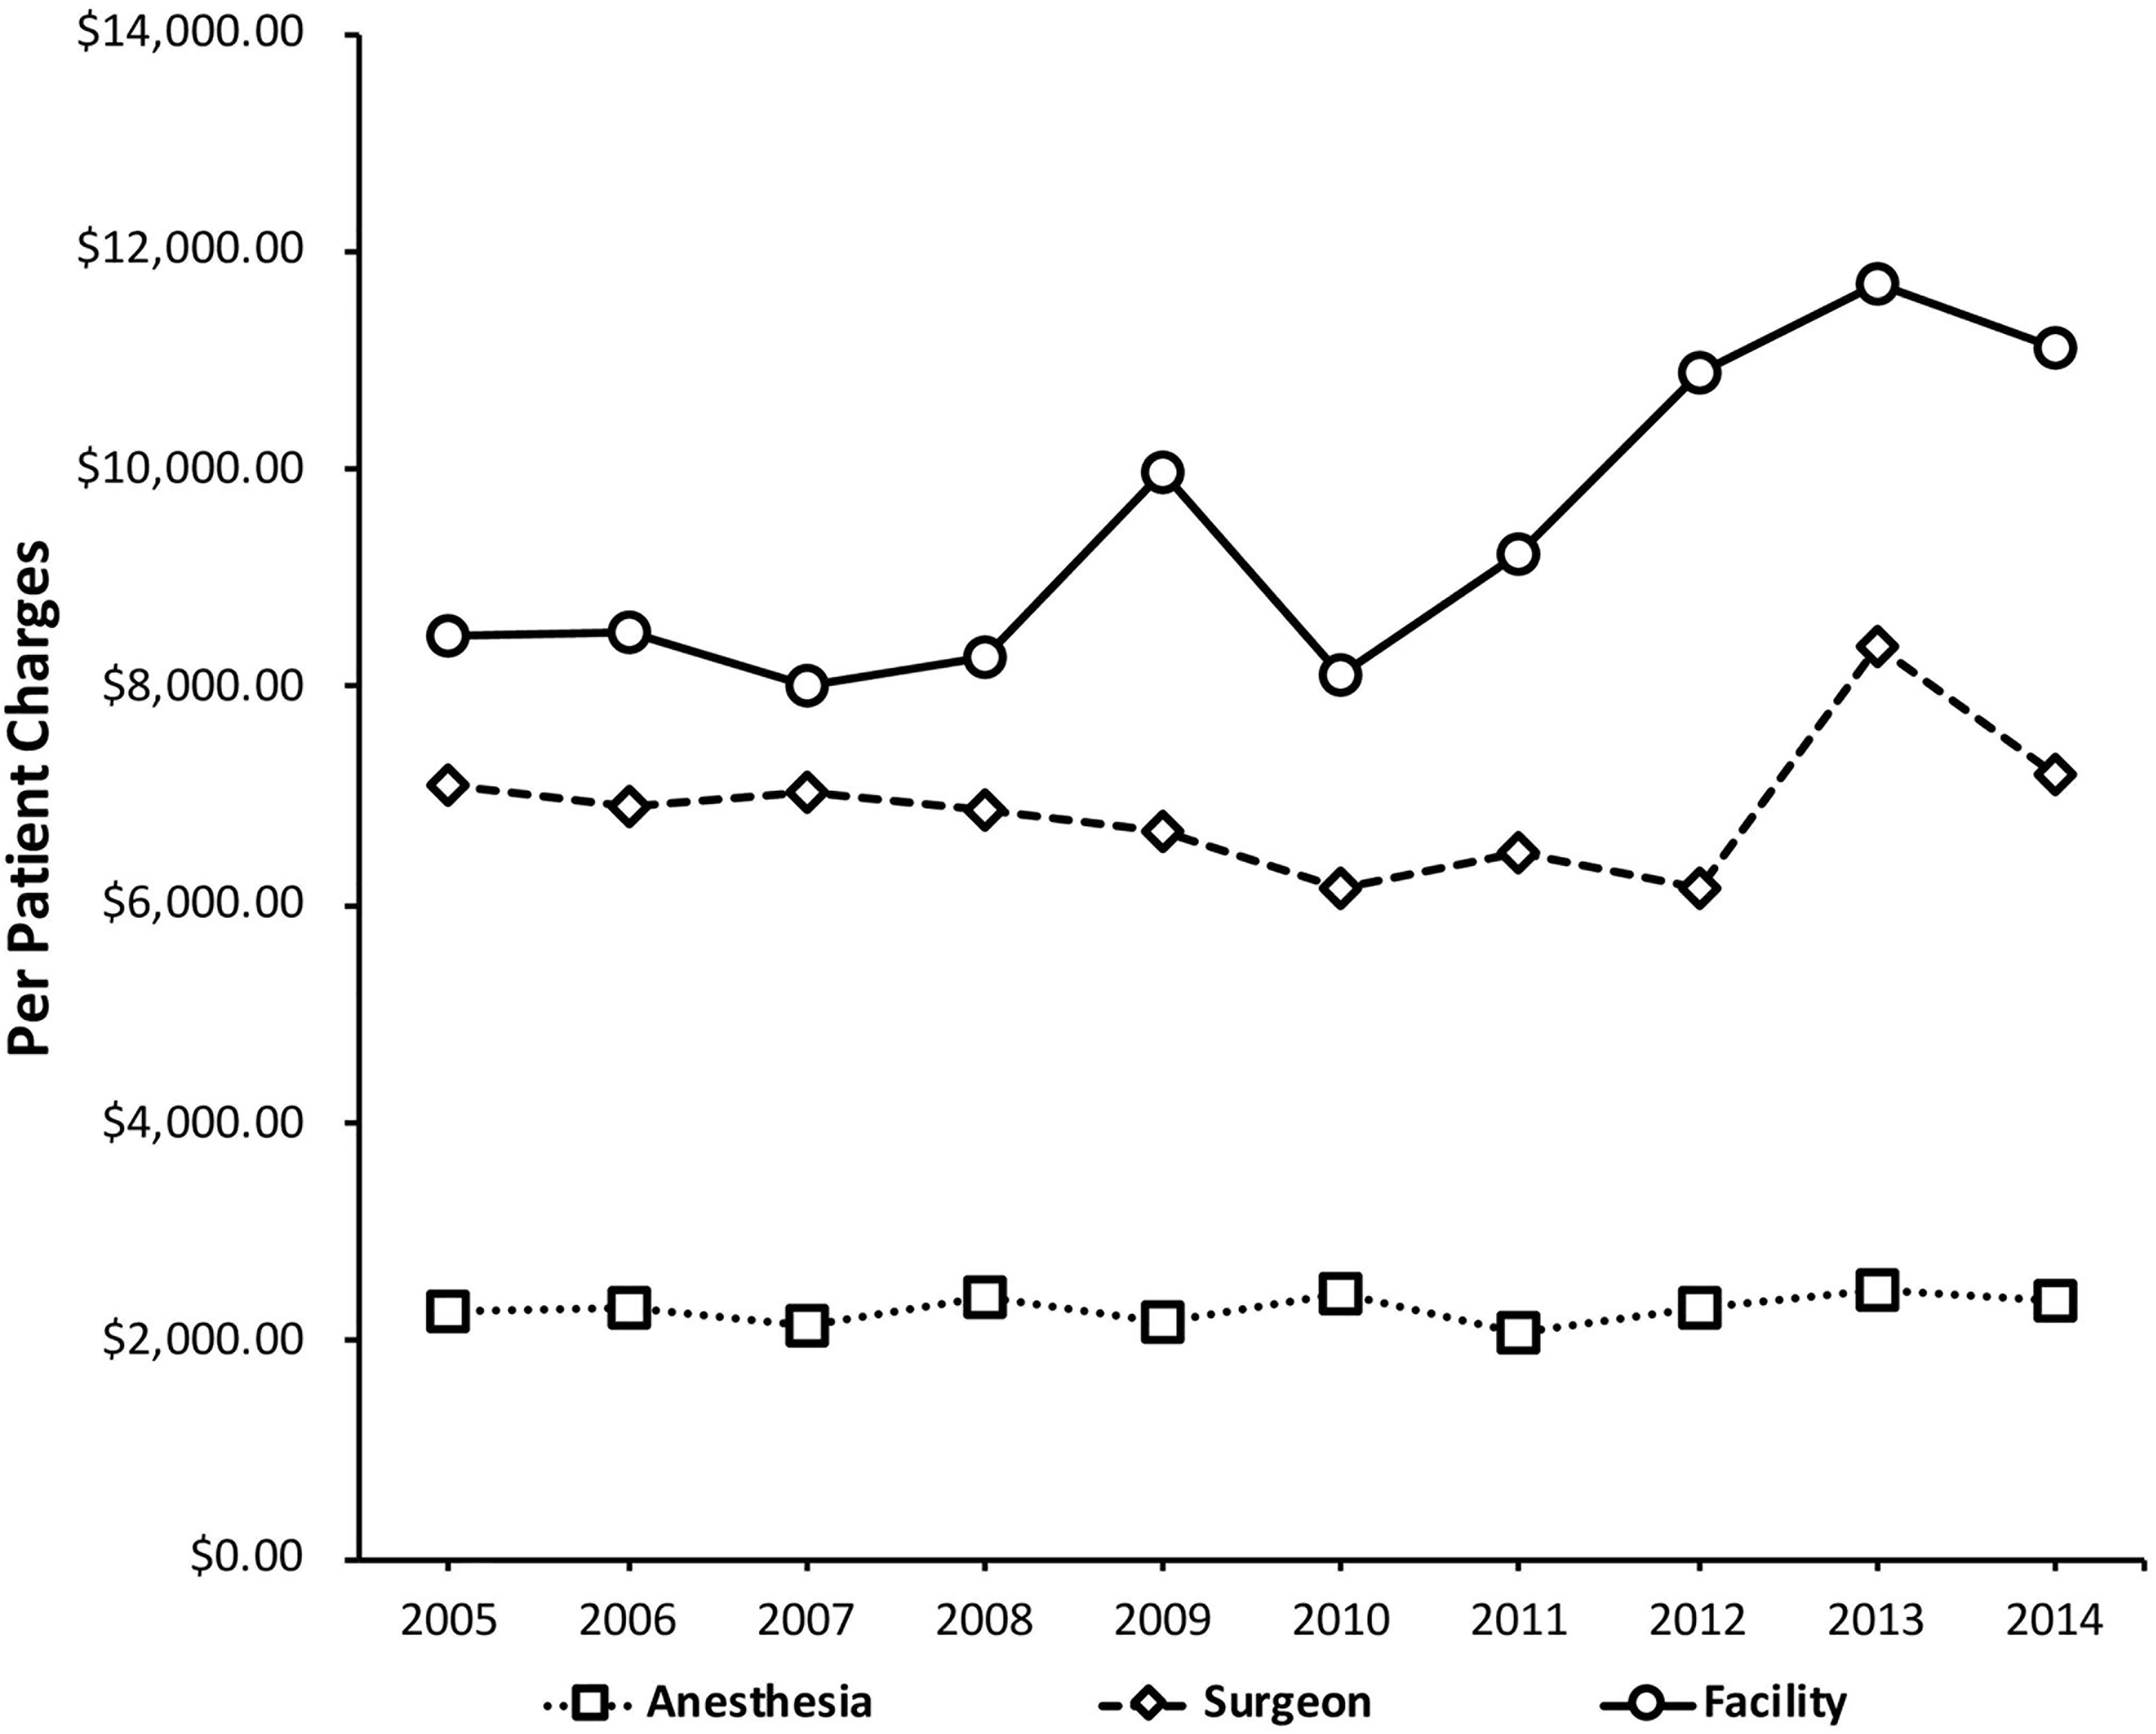
During this same period, the patient payment to the facility per RM increased from $3661 to $3930 (7% increase; p < .0005); the surgeon payment decreased from $1178 to $1002 (15% decrease; p < .0005); and the anesthesiologist payment decreased from $324 to $292 (10% decrease; p < .0005) (Figure 2).
Reduction mammoplasty (RM) payments per patient for facilities, surgeons, and anesthesiologists.
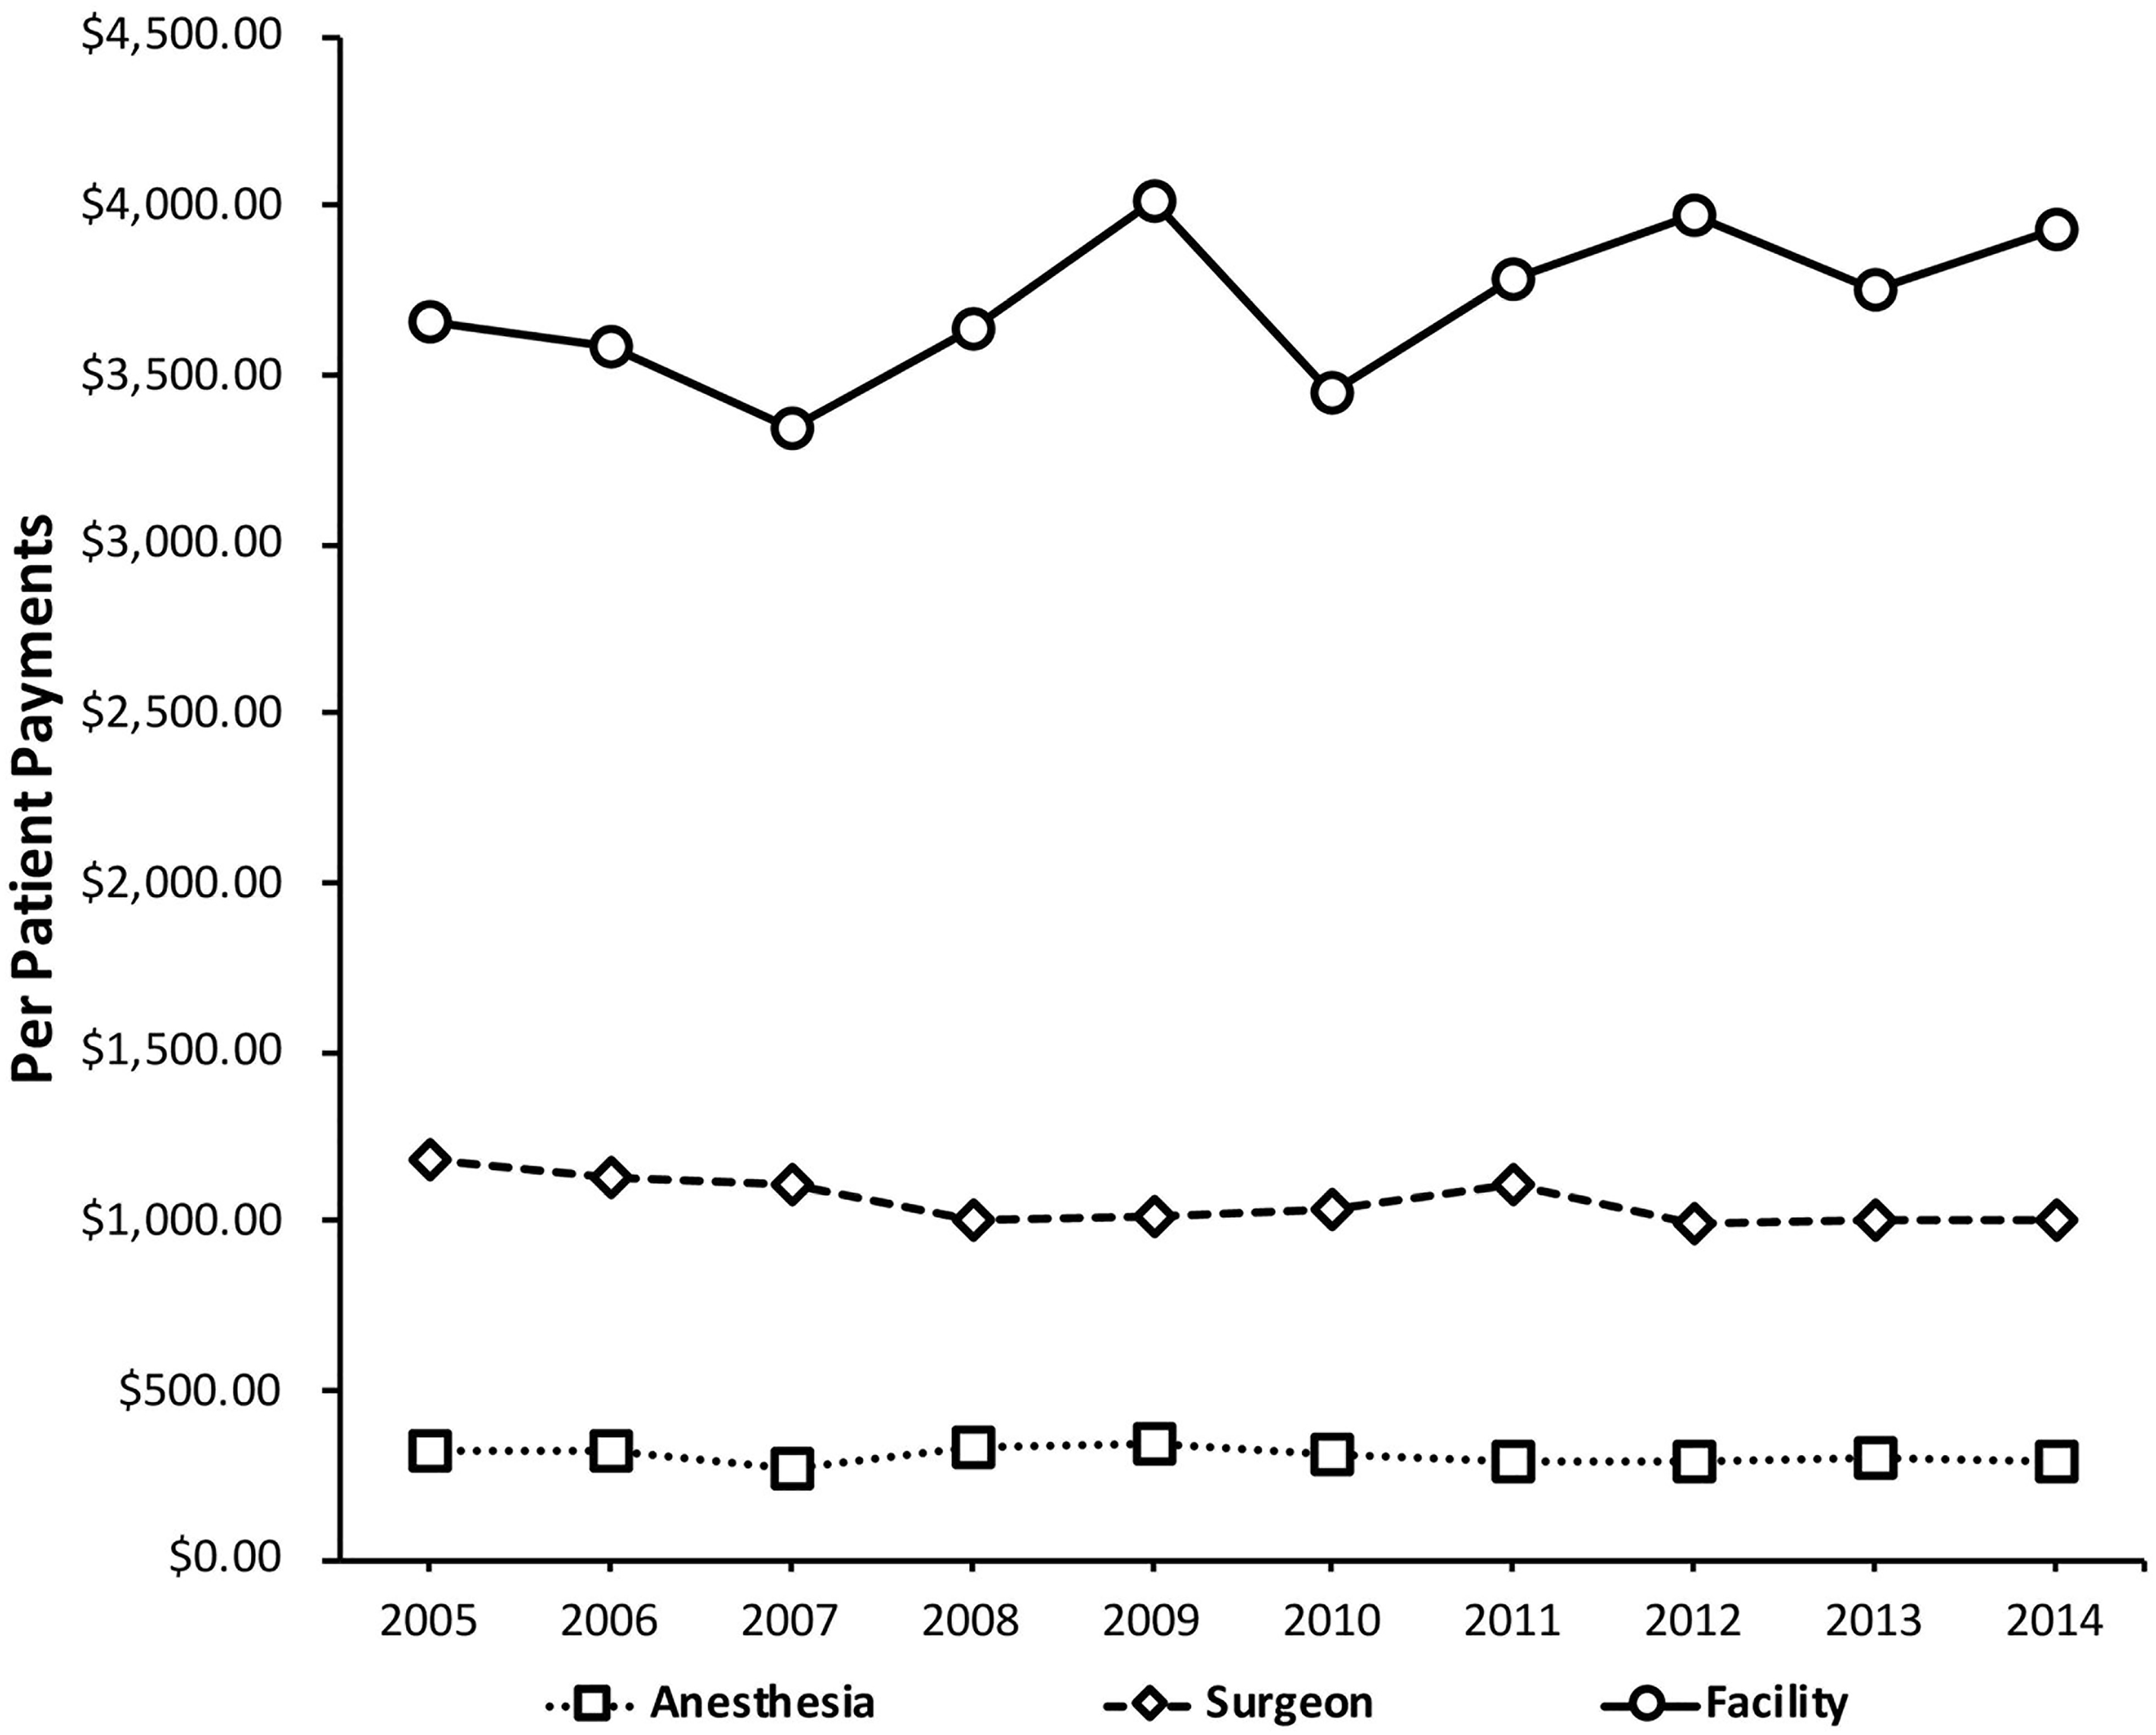
Over the study period, the CM increased from 1.20 to 1.54, and the PM increased from 3.11 to 3.92 (Figure 3). Stratification of data by region is shown in Figures 4 and 5. A negative correlation was found between the CM (R2 = .146) and PM (R2 = .061) and the number of patients undergoing RM for each year included in this study (Figures 6 and 7, respectively).
Average CM and PM values over the study period. Abbreviations: CM, charge multiplier; PM, payment multiplier.
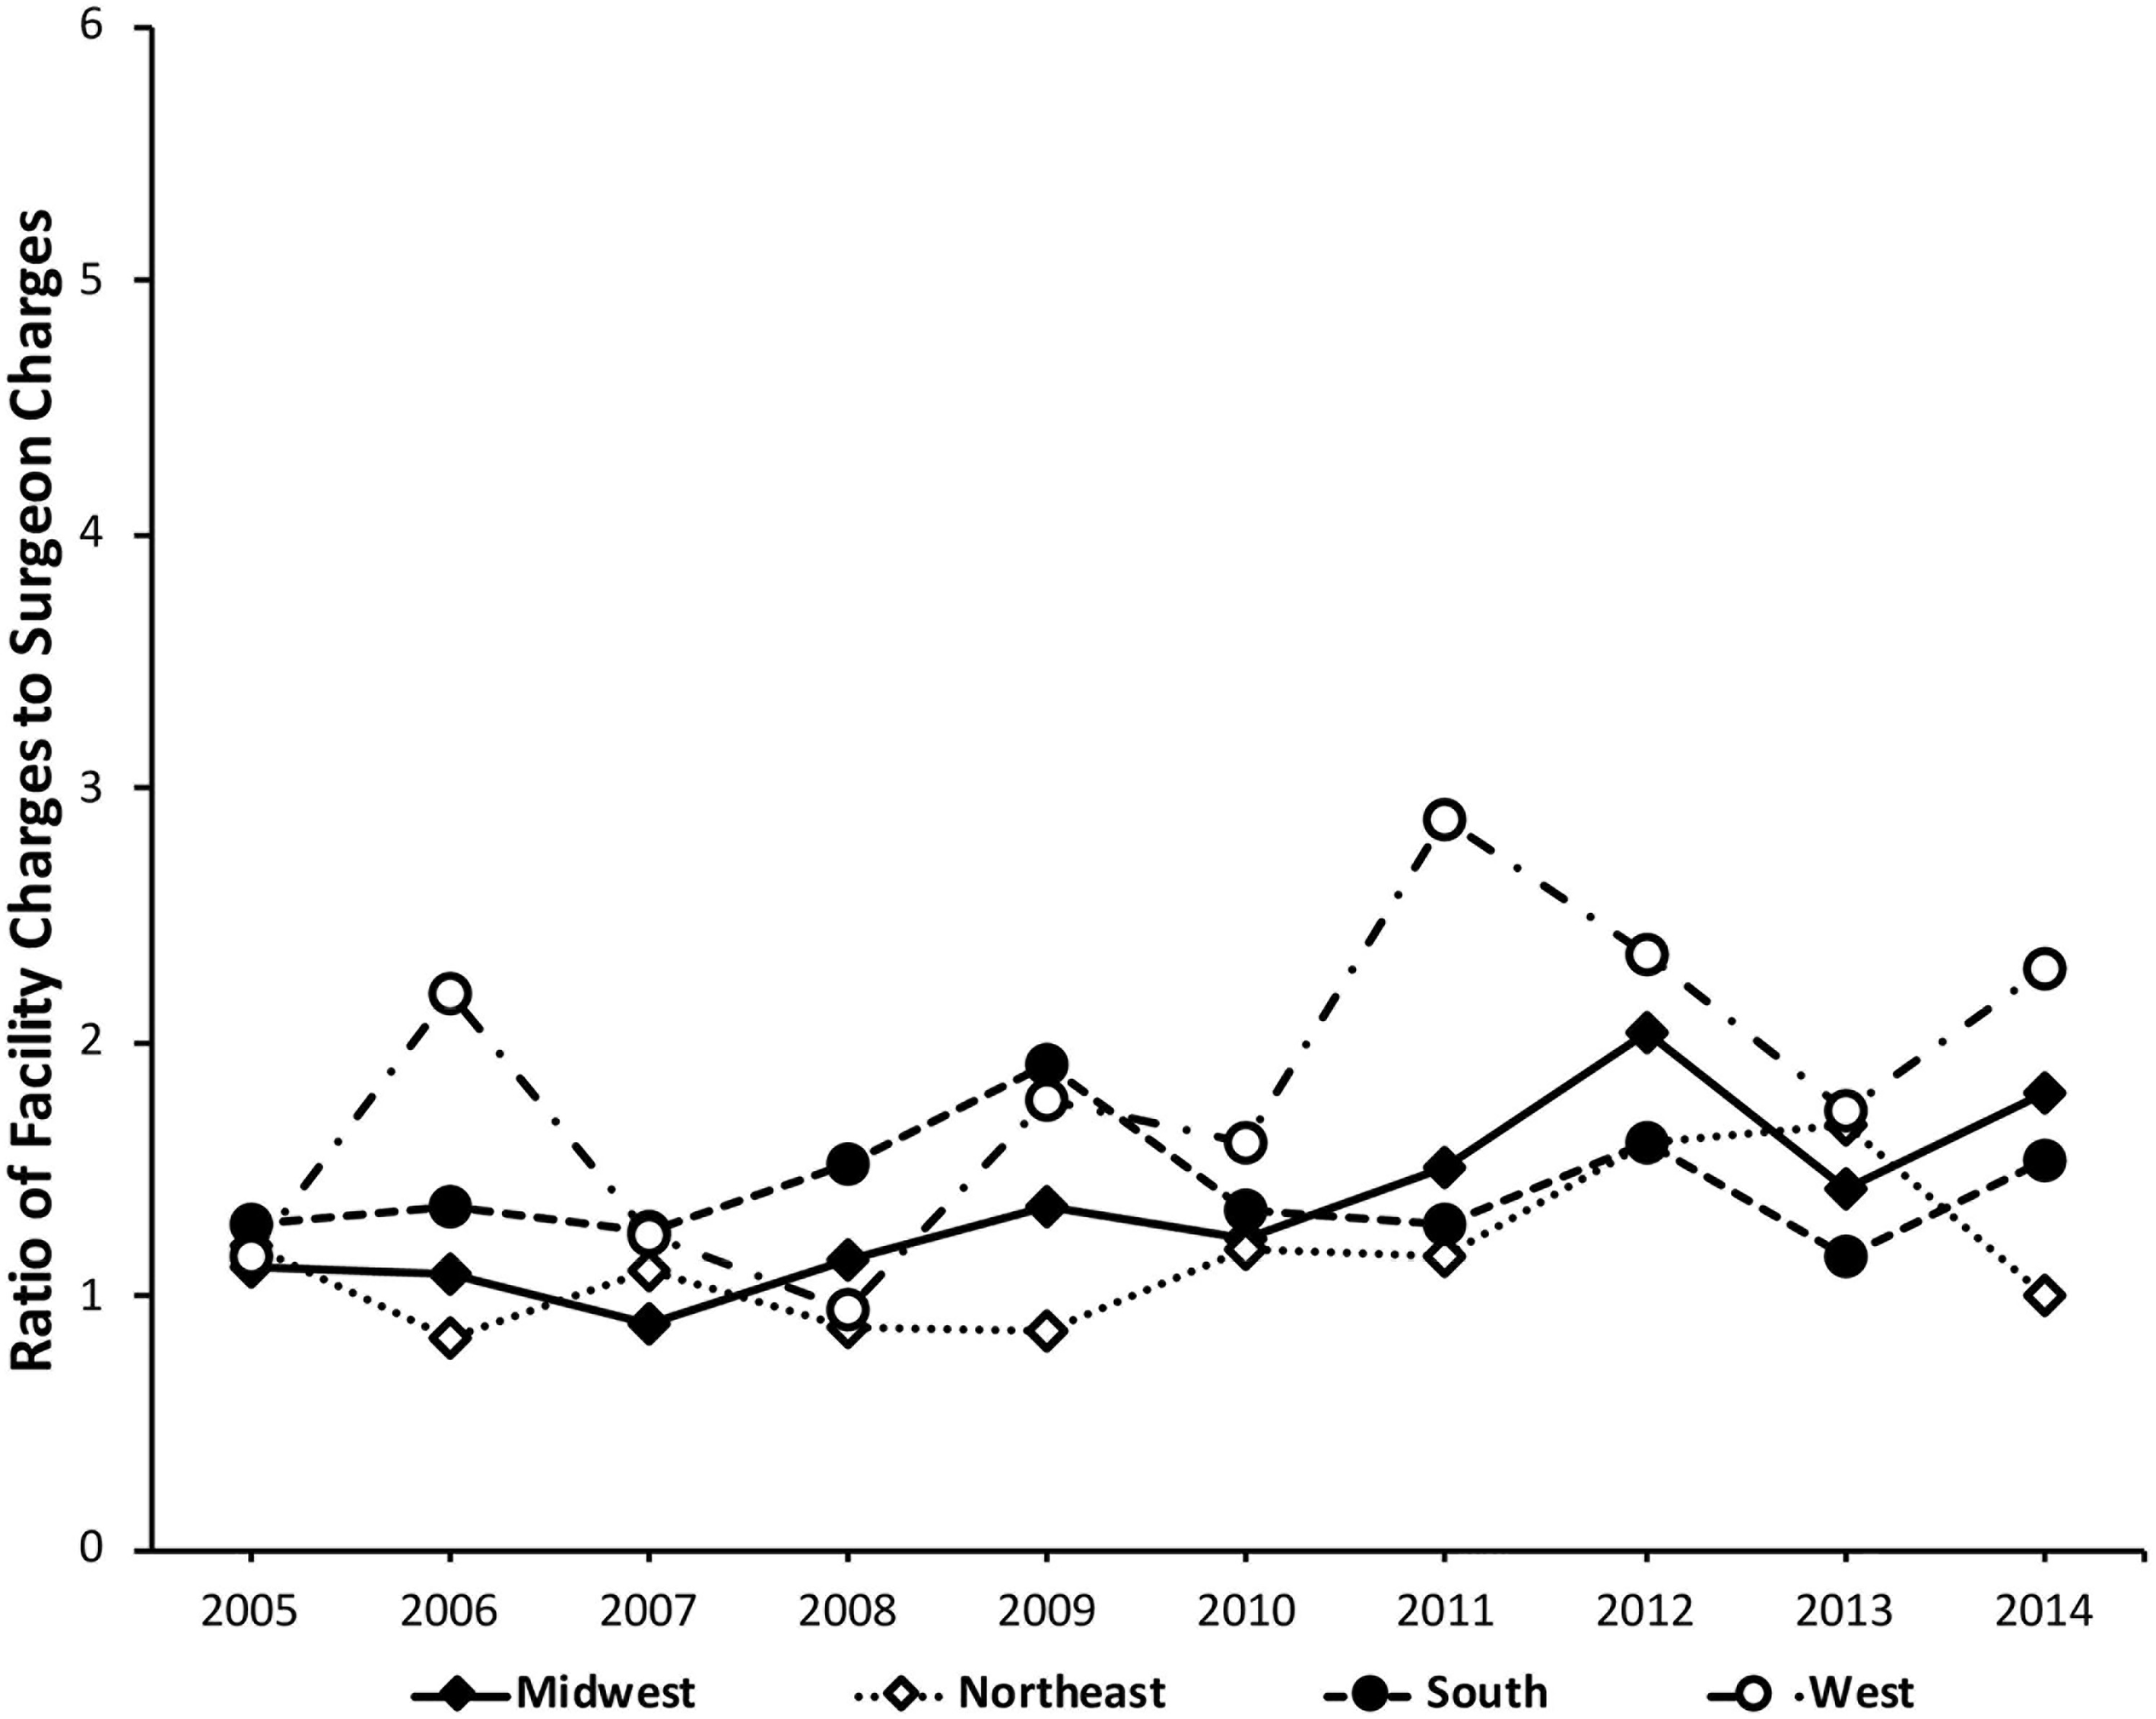
Charge multiplier (CM) values by region.
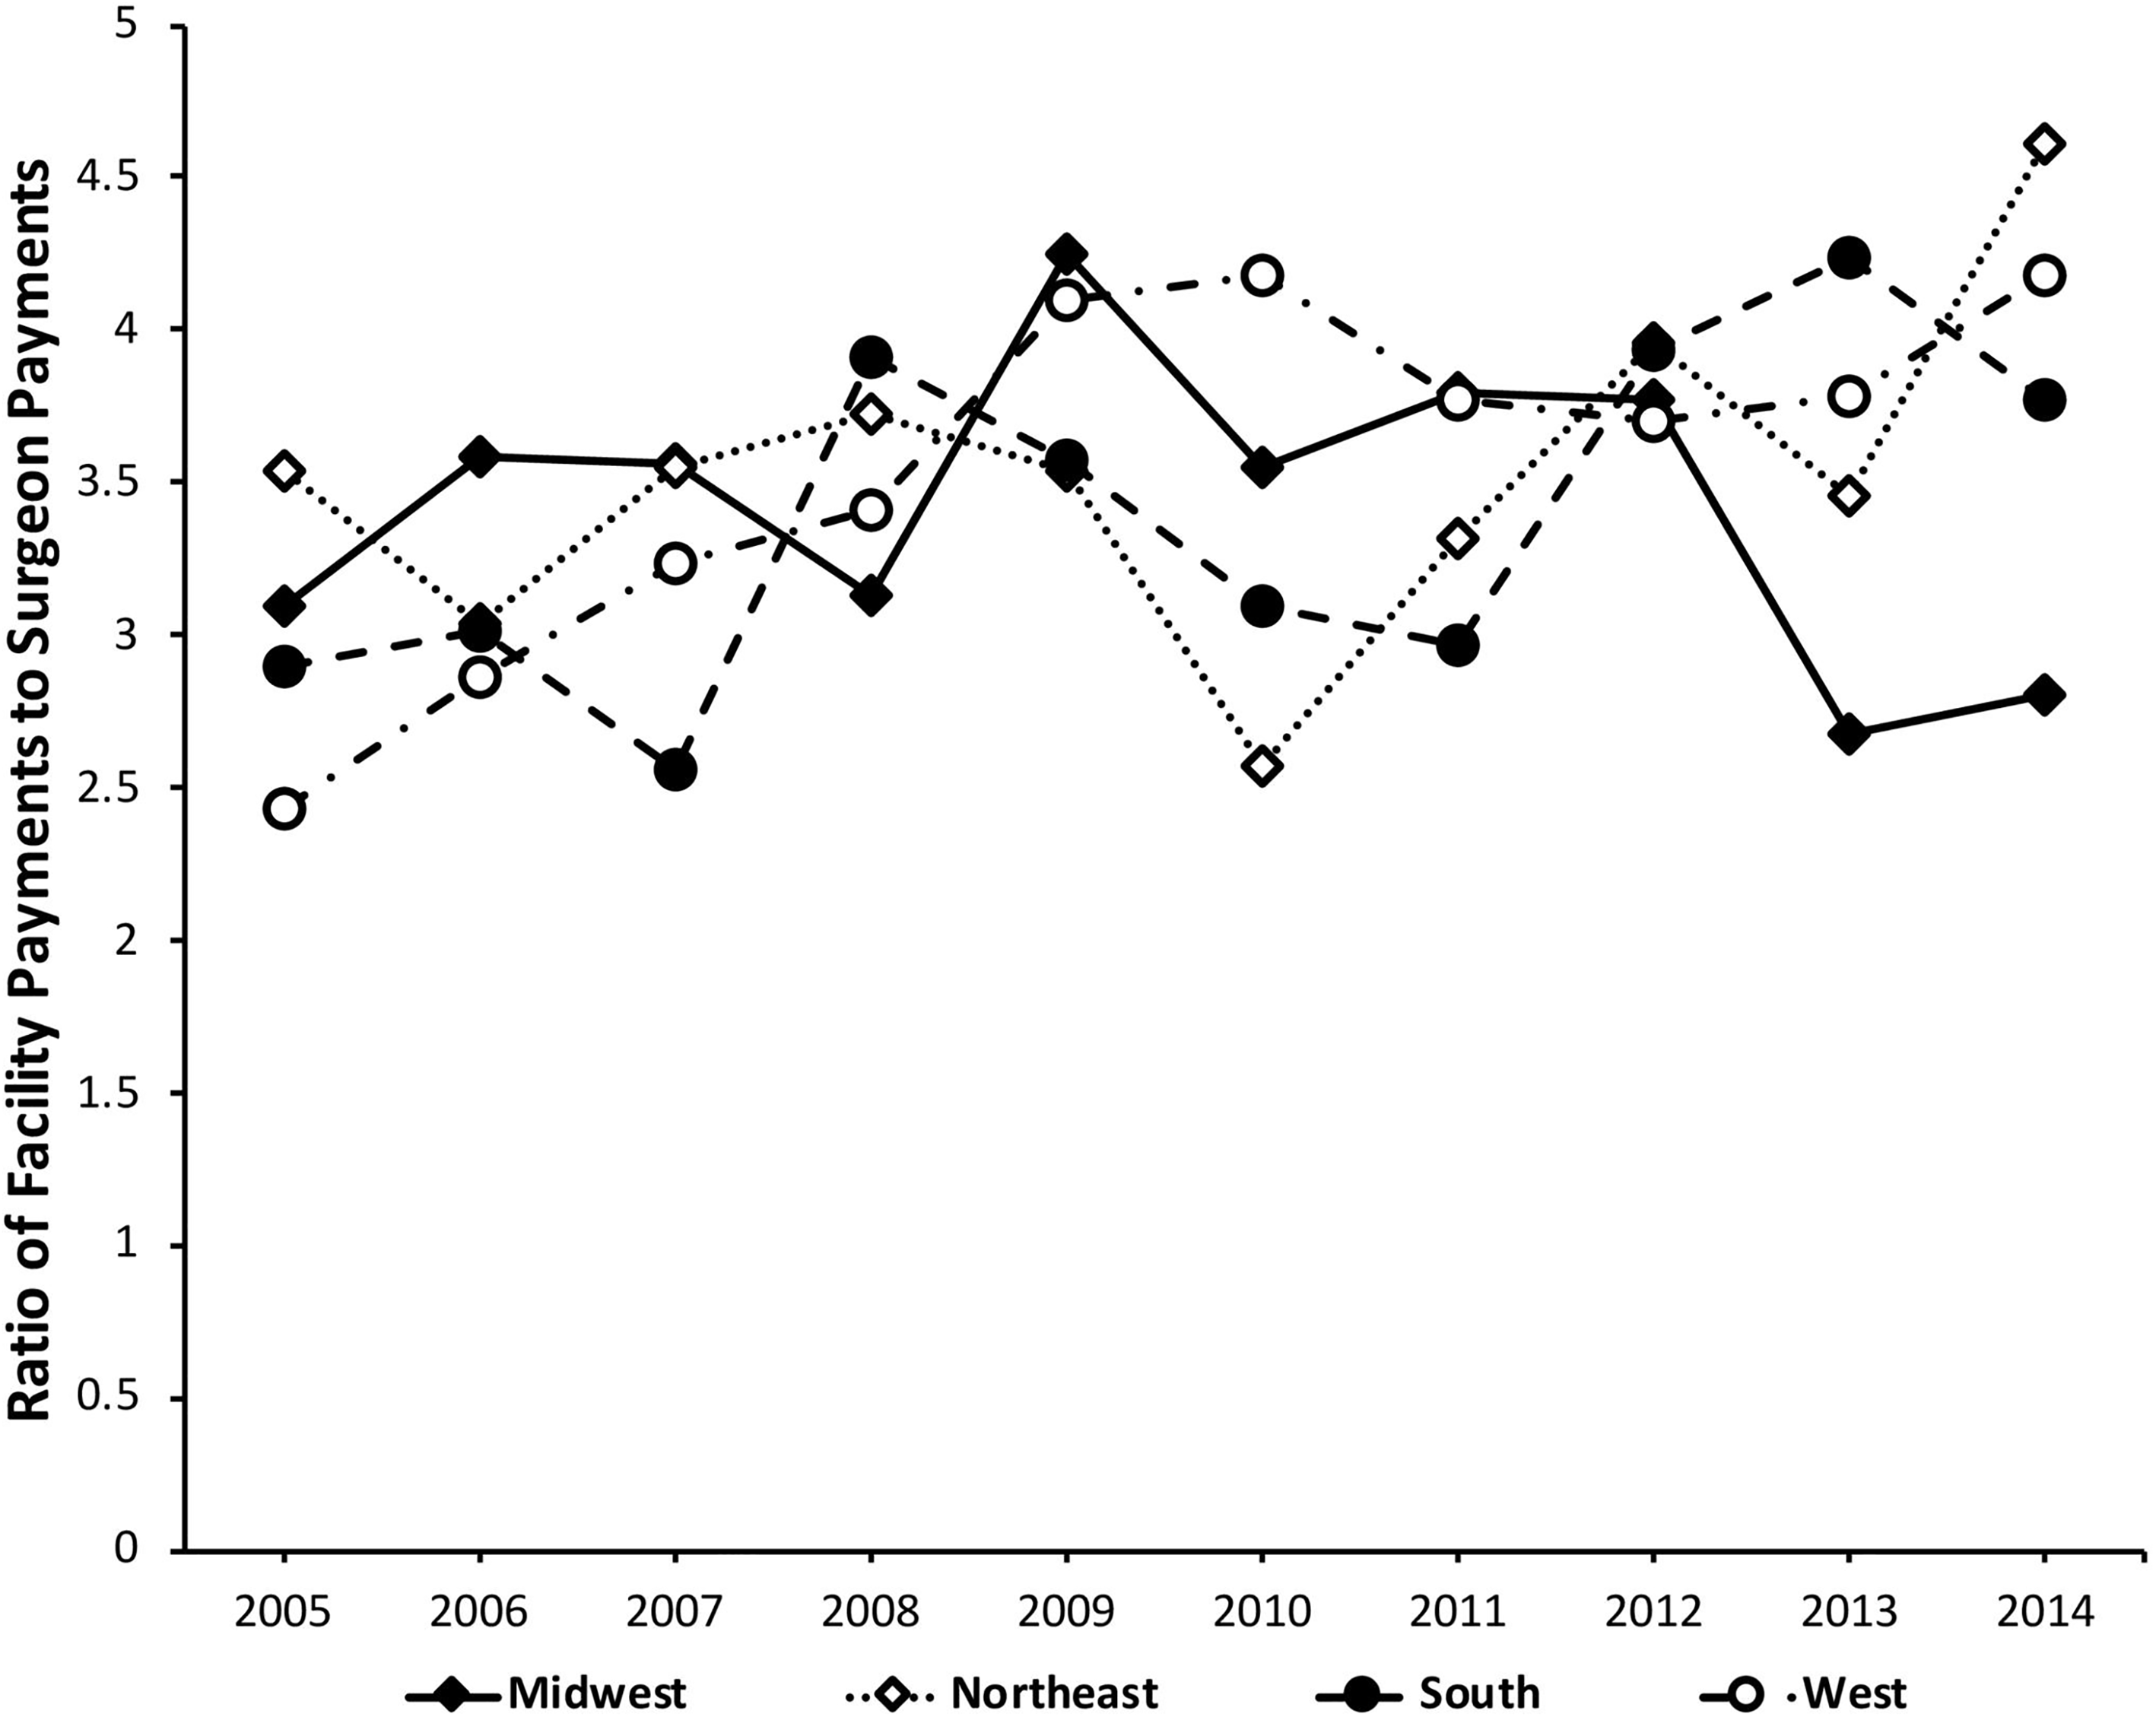
Payment multiplier (PM) values by region.
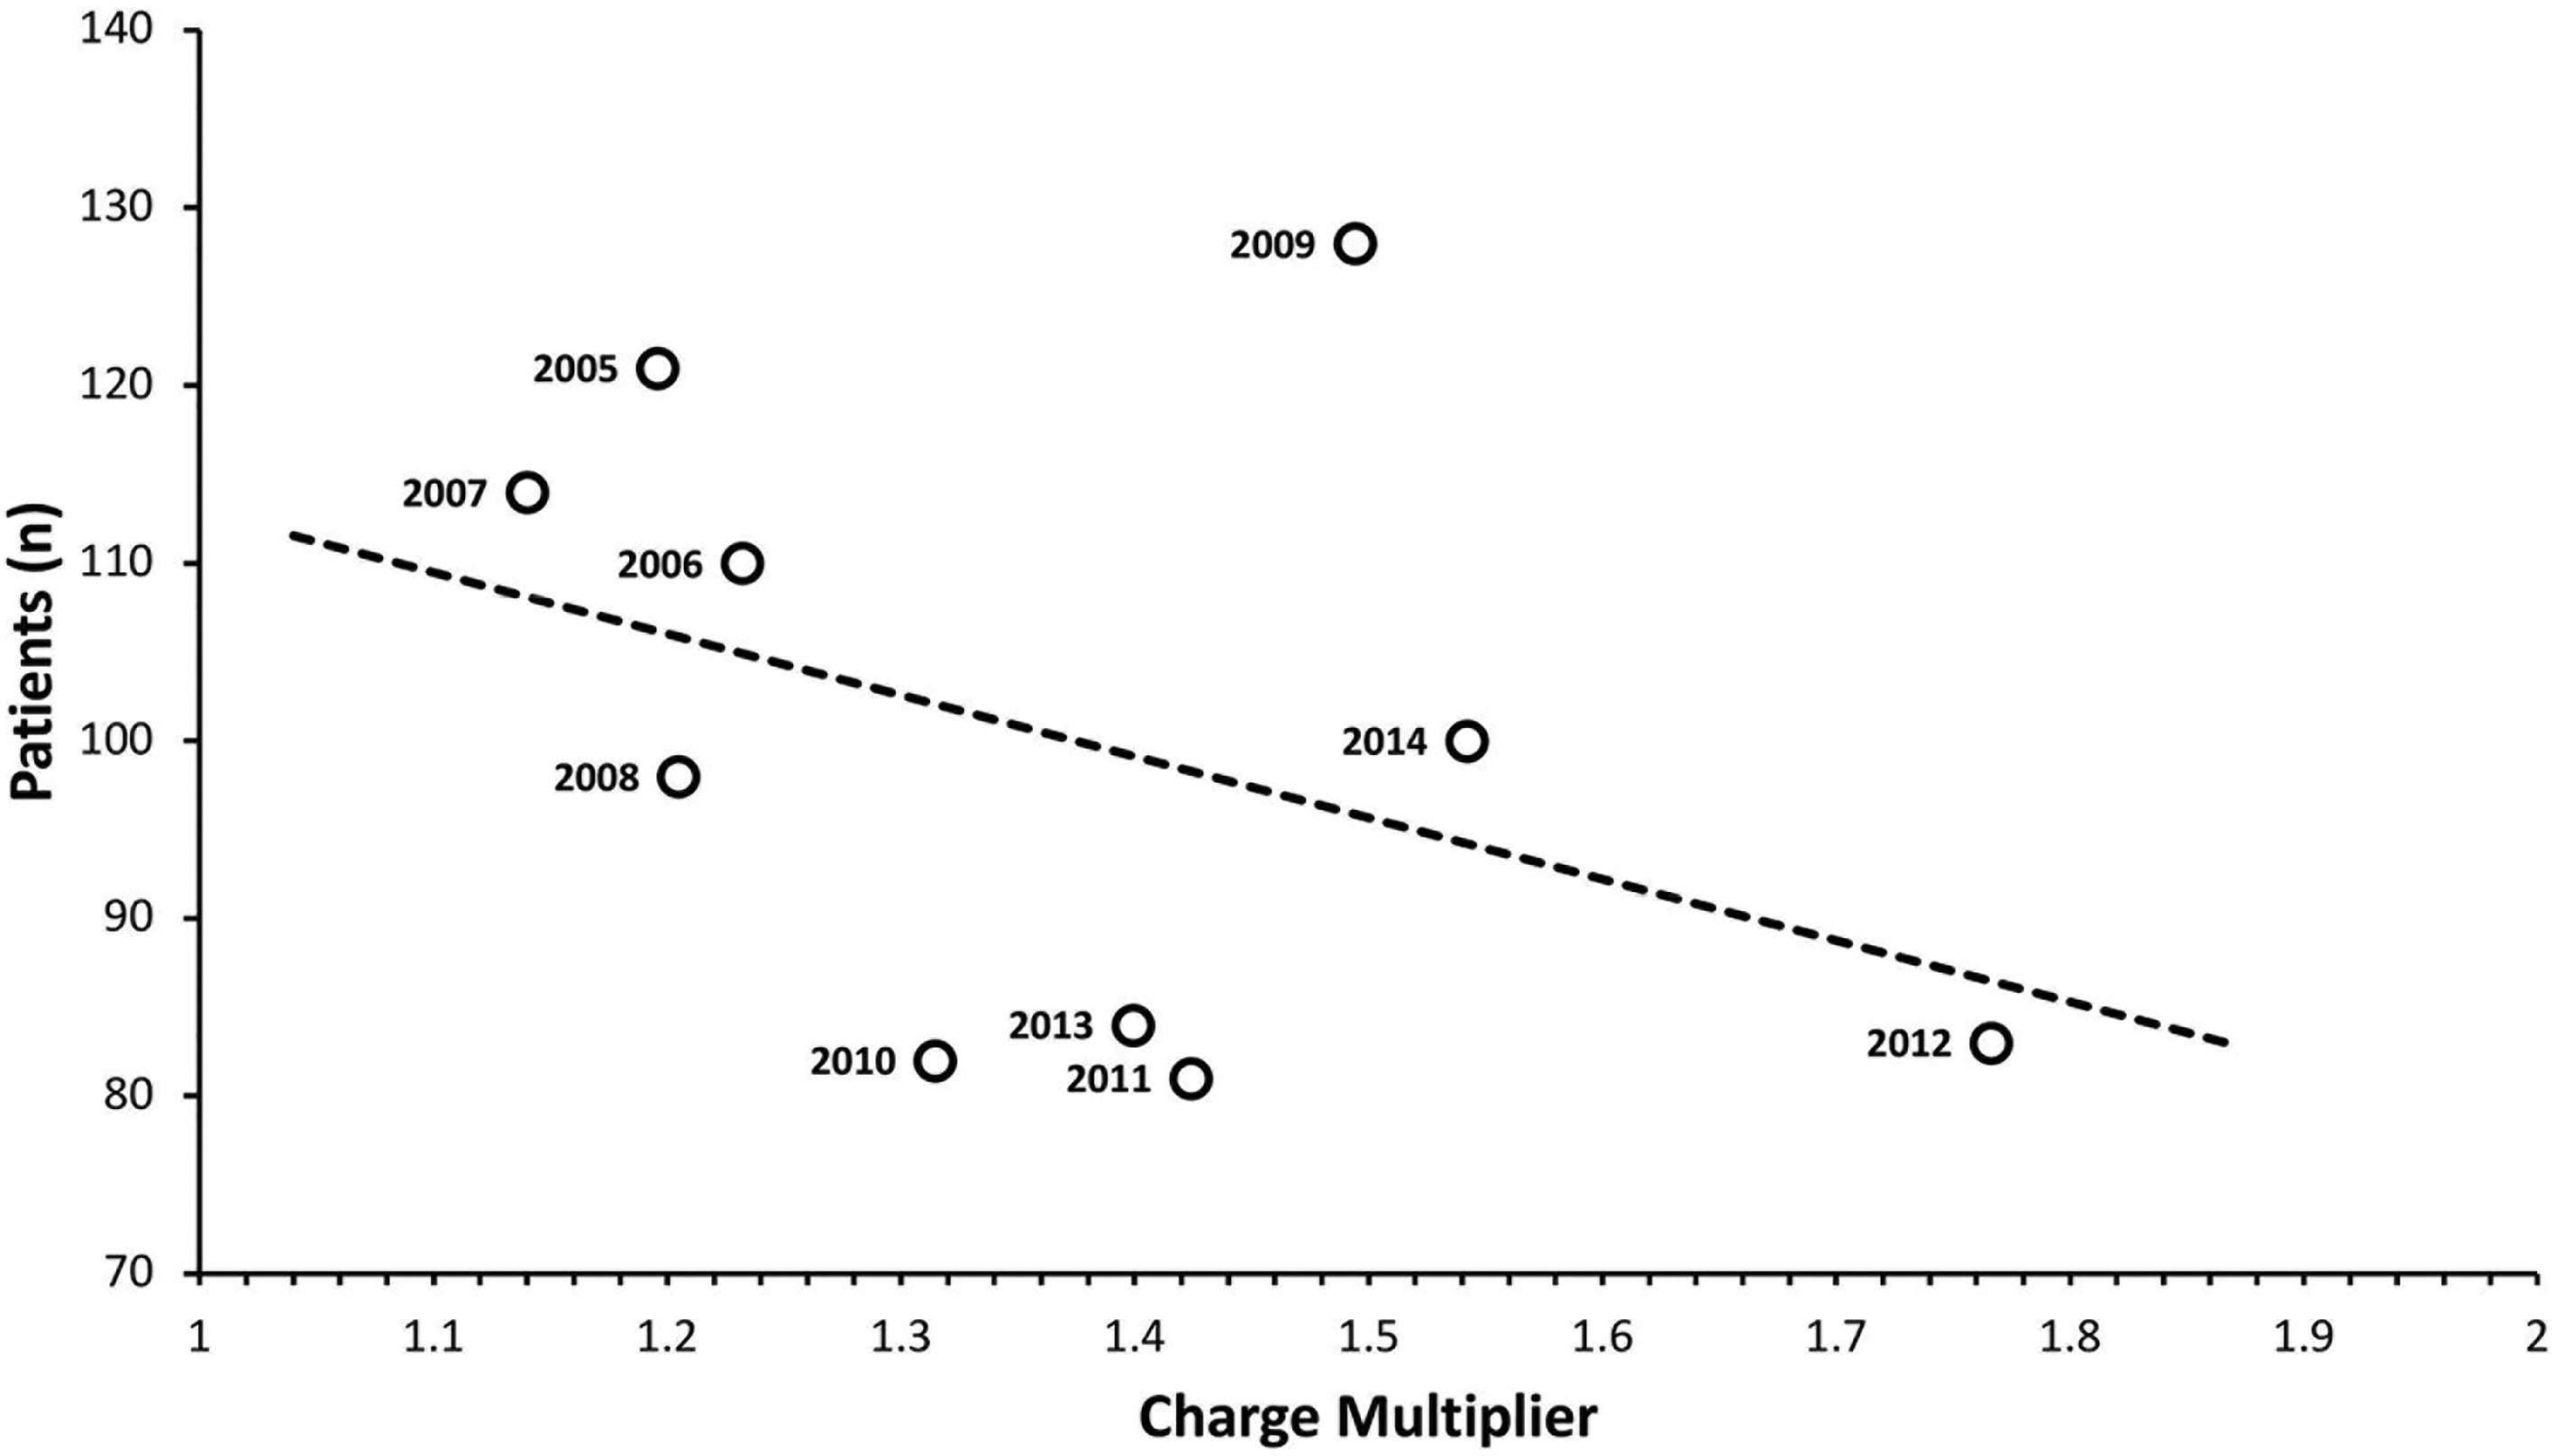
RM patients versus average CM each year (trend line included; R2 = 0.146). Abbreviations: RM, reduction mammoplasty; CM, charge multiplier.
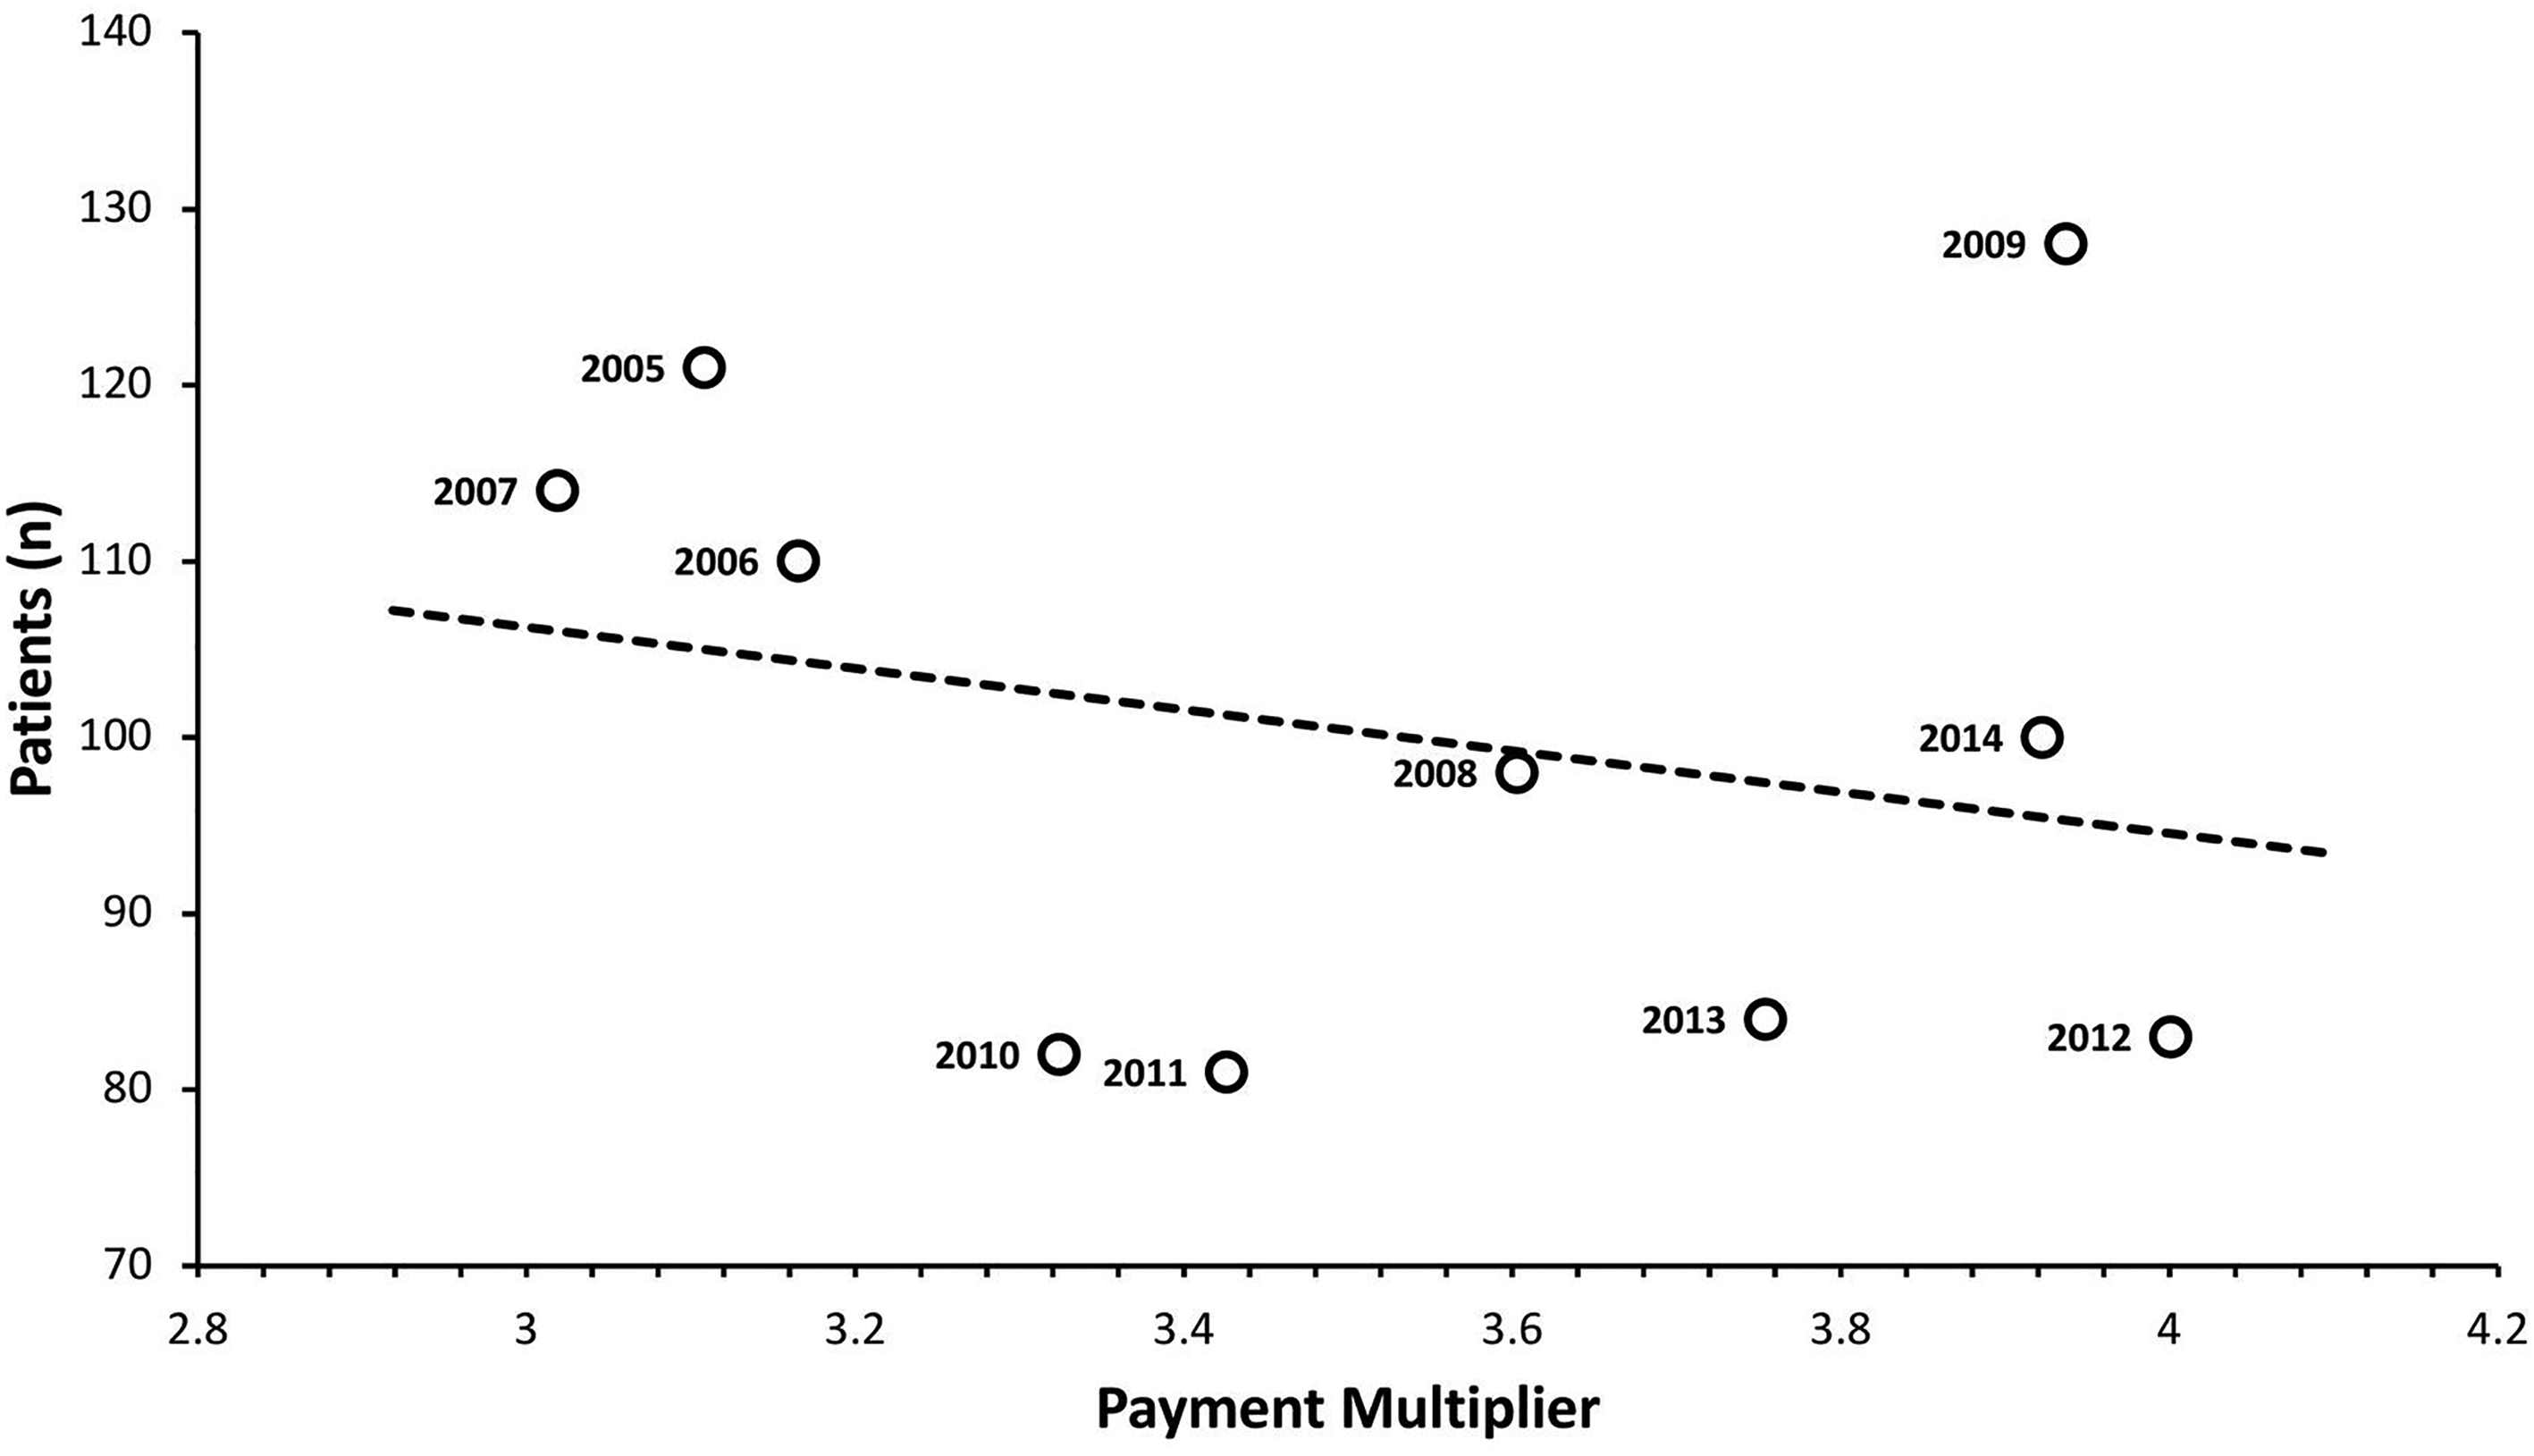
RM patients versus average PM each year (trend line included; R2 = 0.061). Abbreviations: RM, reduction mammoplasty; CM, charge multiplier.
Discussion
The purpose of this study was to investigate recent trends in charges and payments for one of the most common plastic surgery operations performed today, RM. We found that all groups, including facilities, anesthesiologists, and surgeons, demonstrated statistically significant increases in charges over the study period; however, charges were disproportionately increased to facilities. While facility charges increased by 31%, anesthesiologist and surgeon charges increased by only 5% and 2%, respectively. Even more striking is the difference in payment trends—though payments to facilities increased by a modest 7% over the study period, payments to surgeons and anesthesiologists decreased by 15% and 10%, respectively. These trends are reflected in the charge and payment multipliers. CM increased from 1.2 to 1.54, and, due in part to both the rising payments to facilities and falling payments to surgeons, the PM increased from 3.11 to 3.92 as shown in Figure 2.
Our analysis of region-specific data demonstrated generally similar trends. All regions demonstrated a net increase in CM except for the Northeast, which exhibited a net decrease from 1.19 to 1.00; similarly, all regions demonstrated a net increase in PM except for the Midwest region, which had a net decrease from 3.10 to 2.80. While caution is warranted in interpreting the findings of individual regions given the diversity of financial regulations, most regions demonstrated uniformity in rising CM and PM values.
The driving force of the disproportionate increase in facility charges and payments for RM is not immediately evident. While advancements in surgical technique and equipment are ubiquitous, RM is a well-established procedure without the need for expensive implants or materials, making increased surgical costs an unlikely culprit for rising facility reimbursements. Furthermore, CCI scores remained relatively stable throughout the study period, making it doubtful that increased patient complexity is responsible for disproportionately increased facility payments. At least one recent study investigating cost analysis for a common orthopedic surgical operation suggests that hospital administrative expenses may be the driving force for the disproportionate increases in facility reimbursements. 5
Numerous studies have corroborated increasing administrative costs in health care over the last few decades.15–20 Authors have reported administrative costs as one of the primary reasons the United States spends approximately twice as much on health care as comparable high-income countries. 21 A recent study found that 34.2% of United States health care expenditures, totaling $812 billion, went toward administrative costs in 2017—over double that of Canada, at 17%. 19 Though high administrative costs pose a significant challenge to quality health care, reports suggest that they have the potential to be addressed relatively rapidly compared to other expenditures. 22
Increasing administrative costs alone, however, do not explain the decreasing reimbursement rates to plastic surgeons for RM described in our study. Numerous studies have reported this trend for other procedures and in other surgical fields.4–6 In 2011, Alderman et al 11 even noted the decreased volume of breast reconstruction operations as a result of decreasing reimbursement rates to plastic surgeons. Thus, decreasing reimbursements for procedures such as ambulatory RM may incentivize surgeons to decrease their volume of certain poorly reimbursed procedures, or even to transition their practice entirely to private rather than hospital-based surgical centers. Even in the relatively small sample size we report herein, a weakly negative correlation is seen between both CM and PM values and the number of patients undergoing RM in a given year. We suspect this trend may become more readily apparent in a larger, more highly powered study. Consequently, health-policy makers must be aware of the potential implications of decreasing reimbursement rates in plastic surgery, and both surgeons and policymakers should lobby for fair surgeon compensation lest patient access to this highly efficacious operation is further limited as CM and PM values continue to trend upwards.
Ultimately, this study reports that facility charges and payments for RM have increased at a disproportionate rate to that of plastic surgeons. We suggest that this discrepancy may be related to rising administrative costs in health care systems, which is unlikely to contribute value to patient outcomes, and to the decreasing rates of Medicare reimbursement for plastic surgery. We argue that declining payments to plastic surgeons for RM may disincentivize offering this procedure to patients with Medicare/Medicaid at hospital-based surgical centers, limiting patient access to this operation. Given the ramifications of reimbursement rates on the accessibility of RM, addressing rising administrative costs and declining surgeon payments should be a priority to maintain accessibility to this common and highly efficacious plastic surgery operation.
Limitations
There are several limitations to this study. One limitation is the possibility of coding errors in the Medicare database used for data collection, though the rate of miscoding reported in 2012 was 1.3%. Also, the paucity of data from private payers limits the study population to only Medicare/Medicaid patients, which may differ from the total population of patients undergoing RM, decreasing the generalizability of our findings. Also of note, the cost to the facility to perform RM was unavailable in the PearlDiver database, and we are thus unable to compare the actual cost of RM to the charge and payment data we acquired—this would be an interesting area for further study if such data becomes available.
Conclusions
Charges and payments for ambulatory RM increased over the study period for all analyzed groups; however, charges and payments to facilities increased disproportionately to that of surgeons and anesthesiologists. Rising administrative costs in health care delivery likely contribute to the marked increase in facility reimbursements. Disproportionate increases in facility reimbursements for RM with declining physician reimbursements may disincentivize plastic surgeons from offering RM, limiting patient access to this operation.
Footnotes
Acknowledgments
We would like to thank David Martin, Research Data Specialist at the Claude Moore Health Systems Library at the University of Virginia for his help with the statistical analysis. We would also like to thank Dr Lee Hakami for the contribution of her expertise in data analysis and visualization.
Declaration of Conflicting Interests
The authors declared no potential conflicts of interest with respect to the research, authorship, and/or publication of this article.
Funding
The authors received no financial support for the research, authorship, and/or publication of this article.