
Abstract
Background:
Hand X-rays are ordered in outpatient, inpatient, and emergency settings, the results of which are often initially interpreted by non-radiology trained health care providers. There may be utility in automating upper extremity X-ray analysis to aid with rapid initial analysis. Deep neural networks have been effective in several medical imaging analysis applications. The purpose of this work was to apply a deep learning framework to automatically classify the radiographic positioning of hand X-rays.
Methods:
A 152-layer deep neural network was trained using the musculoskeletal radiographs data set. This data set contains 6003 hand X-rays. The data set was filtered to remove pediatric X-rays and atypical views. The X-rays were all labeled as either posteroanterior (PA), lateral, or oblique views. A subset of images was set aside for model validation and testing. Data set augmentation was performed, including horizontal and vertical flips, rotations, as well as modifications in image brightness and contrast. The model was evaluated, and performance was reported as a confusion matrix from which accuracy, precision, sensitivity, and specificity were calculated.
Results:
The augmented training data set consisted of 80 672 images. Their distribution was 38% PA, 35% lateral, and 27% oblique projections. When evaluated on the test data set, the model performed with overall 96.0% accuracy, 93.6% precision, 93.6% sensitivity, and 97.1% specificity.
Conclusions:
Radiographic positioning of hand X-rays can be effectively classified by a deep neural network. Further work will be performed on localization of abnormalities, automated assessment of standard radiographic measures and eventually on computer-aided diagnosis and management guidance of skeletal pathology.
Introduction
The electrocardiogram is an example of a diagnostic medical examination that nowadays can be autonomously interpreted by computers. This highlights significant evolution from a paper-based examination that required a ruler, calipers, and specialist training for interpretation. In the 1950s, the ability to convert analog electrocardiography (ECG) signals into digital format permitted the development of computer algorithms that could interpret ECGs. 1 By 1991, an article from the New England Journal of Medicine estimated that over 50% of the 100 million ECGs recorded annually in the United States were interpreted by computers. 2 Computer-assisted interpretation of these tracings had a major impact on medical care by reducing the time physicians spent analyzing these tests. The total number of diagnostic medical examinations performed worldwide, however, is rapidly increasing. 3 This data require human expertise and judgment for interpretation and appropriate and timely referral.
The popularization of convolutional neural networks in medical imaging suggests that this type of machine learning may be a valuable solution. Convolutional neural network-based deep neural networks have been shown to have high performance in numerous medical applications including identification and localization of thyroid nodules, lung disease, and retinal pathology. 4 -6
While identification and localization of pathology in medical images is useful, the real impact on patients will arise when data scientists and physicians are able to integrate these Artificial Intelligence (AI) technologies into clinical practice in the real world setting to improve patient outcomes. 7 Examples of this are already being developed and include computer-aided diagnosis of acute neurological events and retinal disease. 8,9
Hand X-Rays are commonly ordered in outpatient, inpatient, and emergency settings, the results of which are often initially interpreted by non-radiology trained health care providers. Much like the advent of automated ECG interpretation, there may be utility in automating aspects of upper extremity X-ray analysis to aid with rapid initial analysis and reduce false negative interpretations. To design such a workflow, the mental workflow of how physicians interpret hand X-rays must be deconstructed. Figure 1 shows an example of this for evaluation of a metacarpal fracture. First, one must identify which X-ray is the posteroanterior (PA), lateral, and oblique. Then one must identify the site of pathology, for example, a bony fracture. Using the combination of these 3 views, plus the localization of pathology, one can make the diagnosis of a metacarpal neck fracture. One can then focus on the lateral view to calculate the angulation of the fracture. This angulation value is compared to a predefined threshold which is deemed inappropriate and necessitates closed reduction and immobilization.
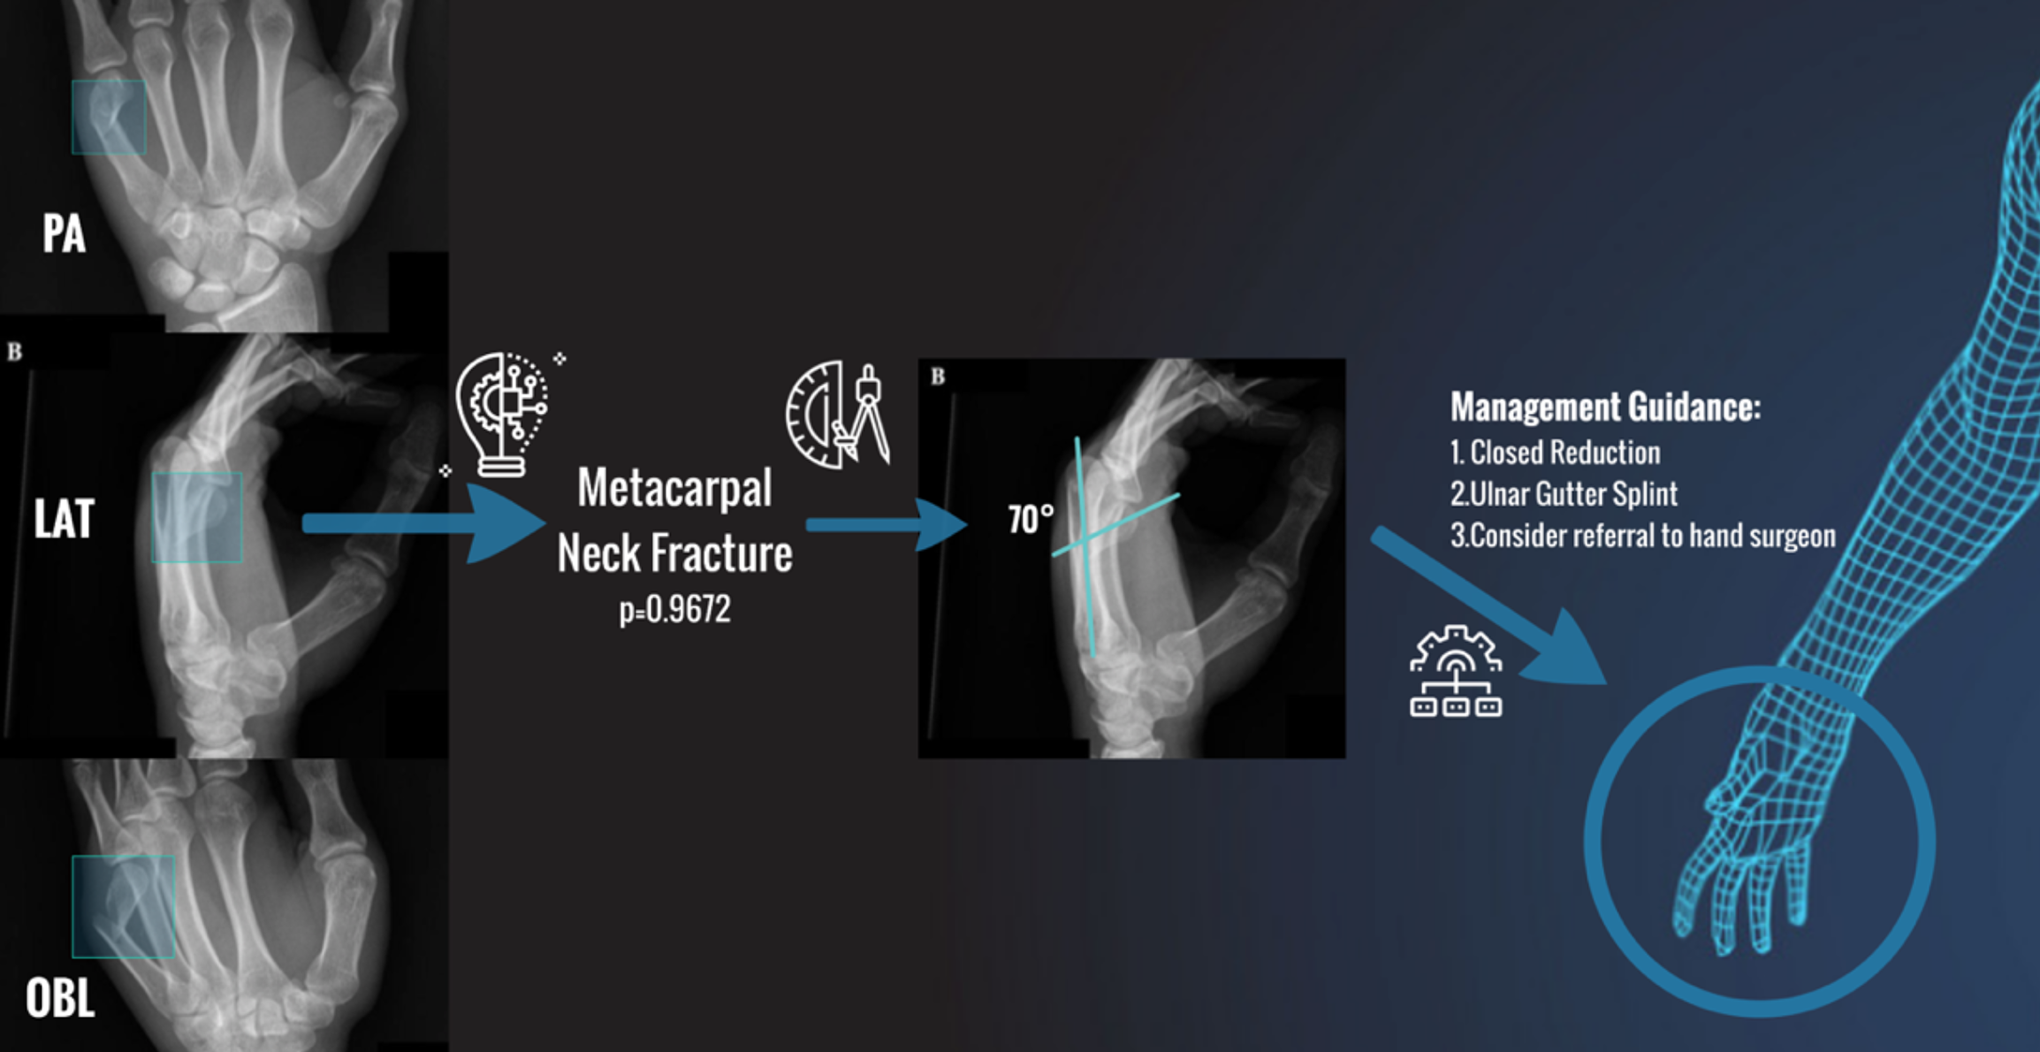
Example workflow of the diagnosis and management of a metacarpal neck fracture as deduced from a standard 3-view hand series.
The purpose of this work was to take the initial steps towards AI-assisted diagnosis and management in hand surgery. To do this, a deep learning framework was applied to automatically classify the radiographic positioning of hand X-rays.
Materials and Methods
A convolutional neural network was used to classify hand X-rays into 1 of 3 standard radiographic positions: PA, oblique, or lateral.
Data set
A subset of the musculoskeletal radiographs (MURA) data set was used. 10 Musculoskeletal radiographs is one of the largest radiographic image data sets and was released for public use by Stanford in 2017. This data set contained 6003 hand X-rays with a fairly equal distribution of PA, lateral, and oblique views.
The data set was filtered to remove pediatric X-rays as well as bilateral and atypical views. This left a total of 5489 hand X-rays. All of these X-rays were labeled as PA, oblique, or lateral based on standard radiographic definitions. A test set of approximately 10% (N = 404) was set aside for final model evaluation. The remaining hand X-rays were used for model training.
Augmentation of the training data set was performed by applying a series of transformations, including horizontal and vertical flips, rotations, and changes in image brightness and contrast (Figure 2). The final augmented data set included 87 824 hand X-rays. From the augmented training set, a validation set of approximately 10% (N = 7152) was set aside for model validation throughout the training process. The subdivision of the data set is summarized in Figure 3.
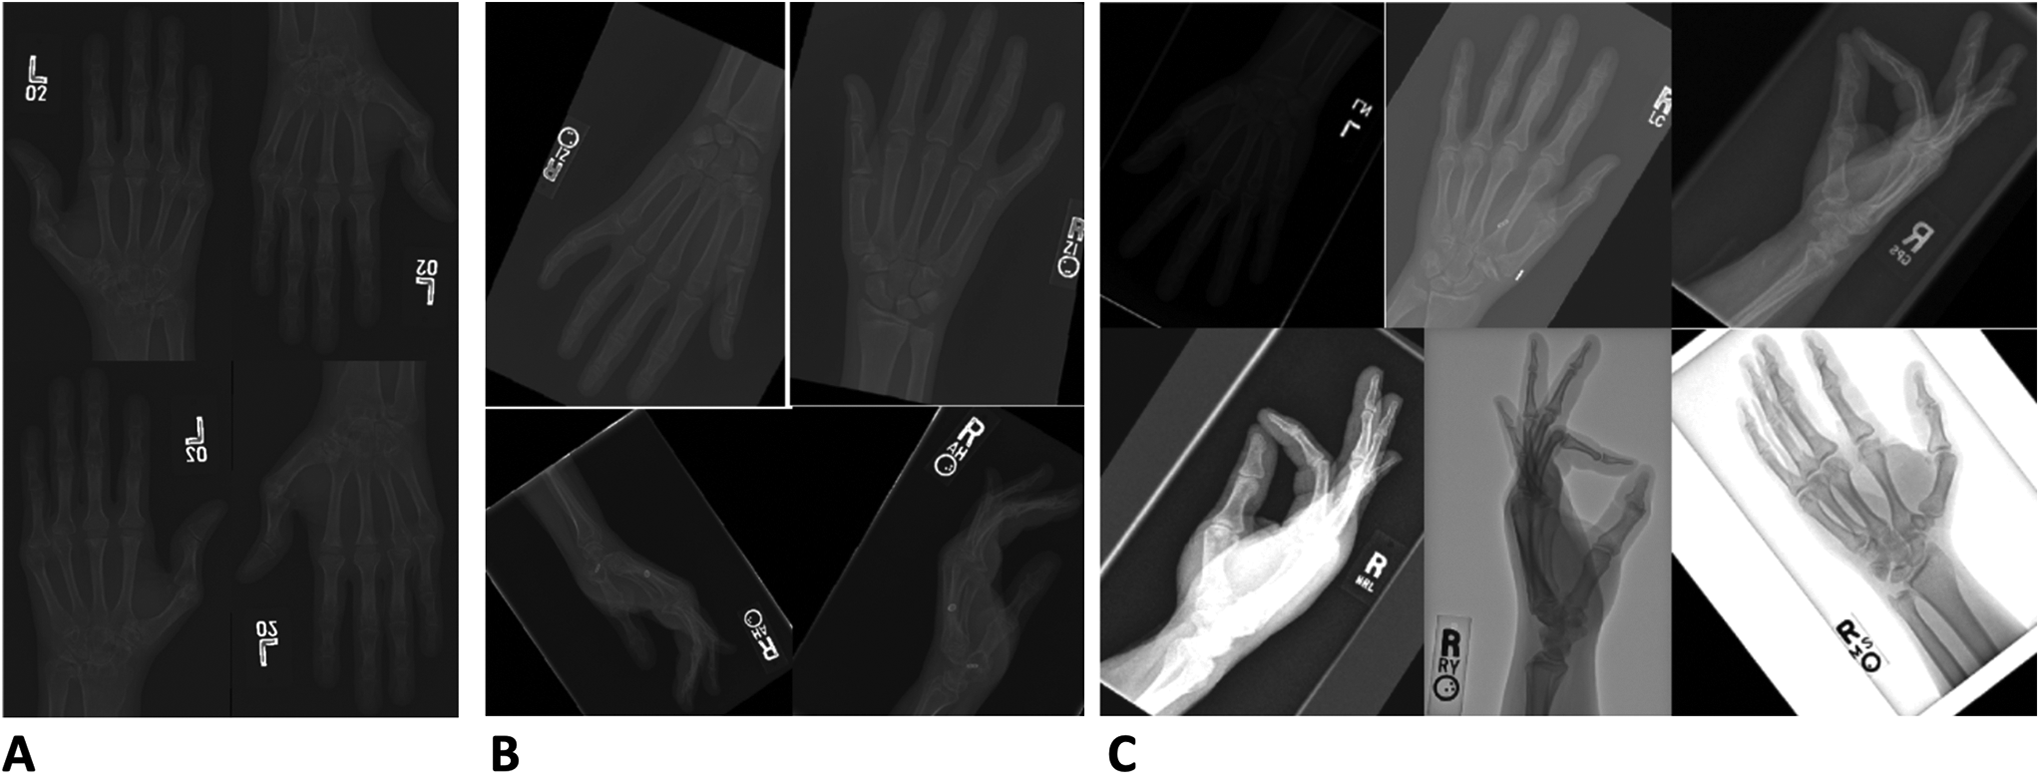
Data augmentation. Panel A demonstrates the addition of horizontal and vertical flips which increased the data set to 21 956 X-rays. Panel B demonstrates the addition of rotations (±45°) which increased the data set to 43 912 X-rays. Panel C demonstrates the modifications in contrast (+2, −0.05) and brightness (±50) which increased the data set to 80 672 X-rays.
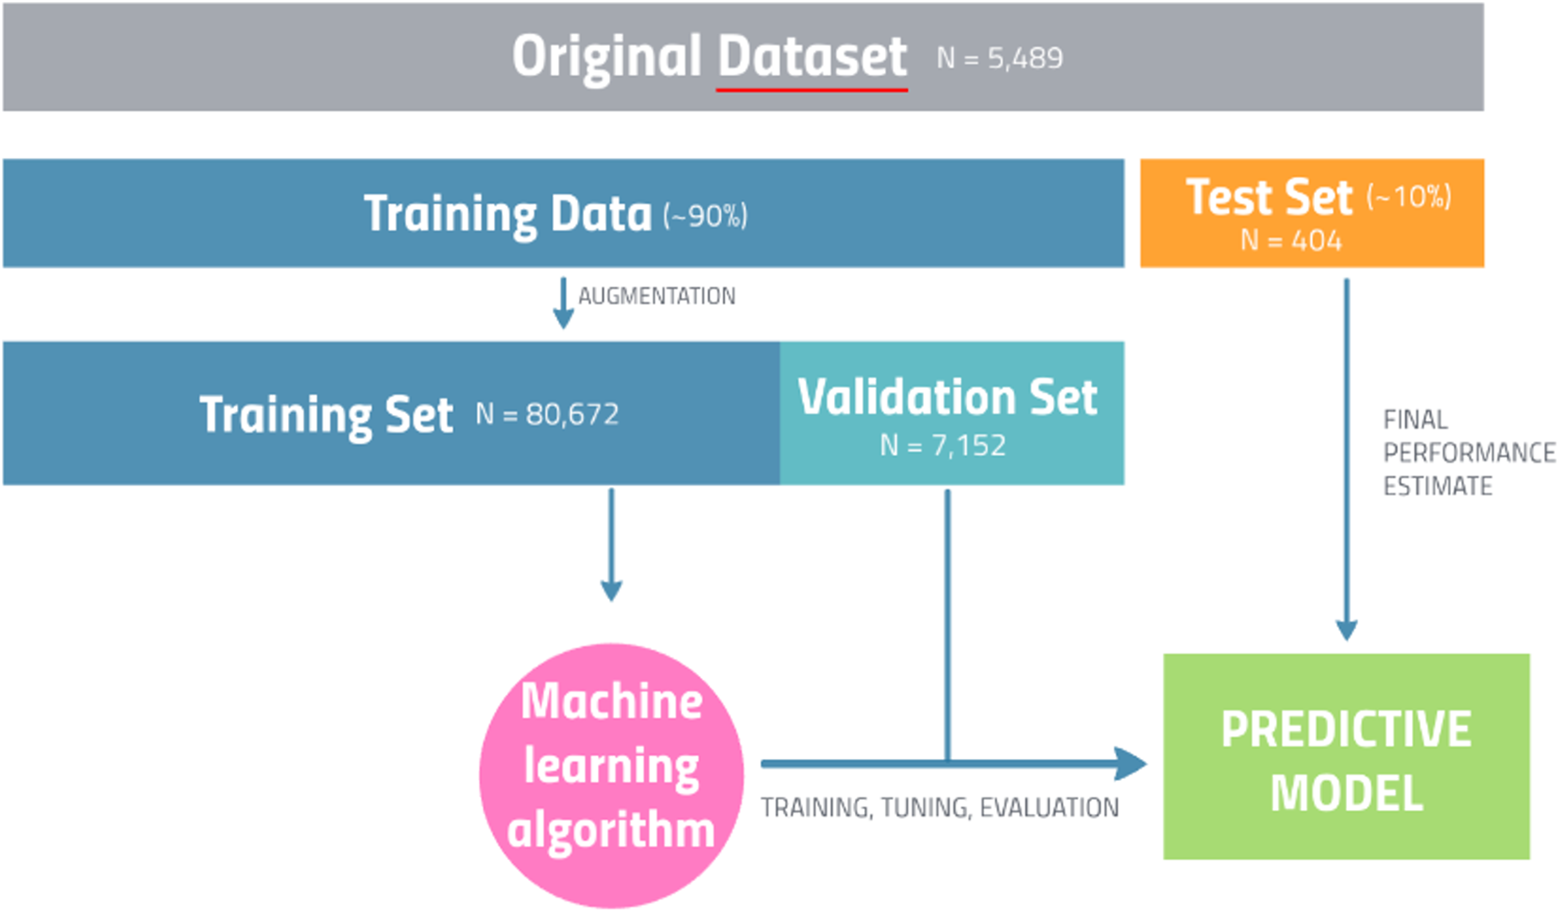
Overview of data set and model preparation.
Model
The model chosen for classification was the 152-layer ResNet model—which has become a workhorse architecture for image classification. 11 As the computational resources required to train this model with such a large data set are massive, an AWS-cloud-based GPU-accelerated elastic computing interface was used, and the model training was completed in approximately 30 hours.
Model performance was tested using the evaluation data subset consisting of 404 hand X-rays never before seen by the model during the training process. This was a classification problem with N = 3 classes. A 3 × 3 confusion matrix was constructed from which the true positive (TP), true negative (TN), false positive (FP), and false negative (FN) values for each class were calculated. Standard image classification performance metrics were reported overall and for each class including sensitivity, specificity, accuracy, and precision.
Sensitivity is the ratio of correctly labeled X-rays of a specific projection to the actual number of XRAYs of that specific projection in the test set. For PA X-rays, this answers the question: Of all the PA X-rays, how many of those did the algorithm correctly predict? The equation for sensitivity is TP/(TP + FN). Specificity is the ratio of X-rays correctly NOT labeled as a specific projection out of all X-rays that are not that specific projection. For PA X-rays, this answers the question: Of all the X-rays that are not PA, how many of these did we correctly predict? The equation for specificity is TN/(TN + FP).
Accuracy is the ratio of correctly labeled X-rays of a specific projection to the total number of all X-rays in the test set. Accuracy answers the following question: How many X-rays did the algorithm correctly label out of all of the X-rays. The equation for accuracy is (TP + TN)/(TP + FP + FN + TN). Precision is the ratio of the correctly labeled X-rays of a specific projection to all predicted X-rays of that specific projection. Precision answers the following: How many X-rays labeled as a specific position are actually that specific position. The equation for precision is TP/(TP + FP).
Results
Results were calculated on the previously unseen test set described in Materials and Methods: Data set section. This test set was well balanced and consisted of 404 hand X-rays with 152 (37.6%) PA, 141 (34.9%) lateral, and 105 (26.0%) oblique projections. The algorithm took 13 seconds to process the 404 X-rays when running on an NVIDIA GTX 1060 graphics processing unit.
The global accuracy was 96.0%, precision was 93.6%, sensitivity was 93.6%, and specificity was 97.1%.
For the PA projection class, the accuracy was 94.6%, precision was 92.9%, sensitivity was 92.9%, and specificity was 95.6%. For the lateral projection class, the accuracy was 99.5%, precision was 99.3%, sensitivity was 99.3%, and specificity was 99.6%. For the oblique projection class, the accuracy was 94.1%, precision was 88.7%, sensitivity was 88.7%, and specificity was 96.0%. The confusion matrix as well as the class-specific and global performance metrics are detailed in Figure 4 and Table 1, respectively.
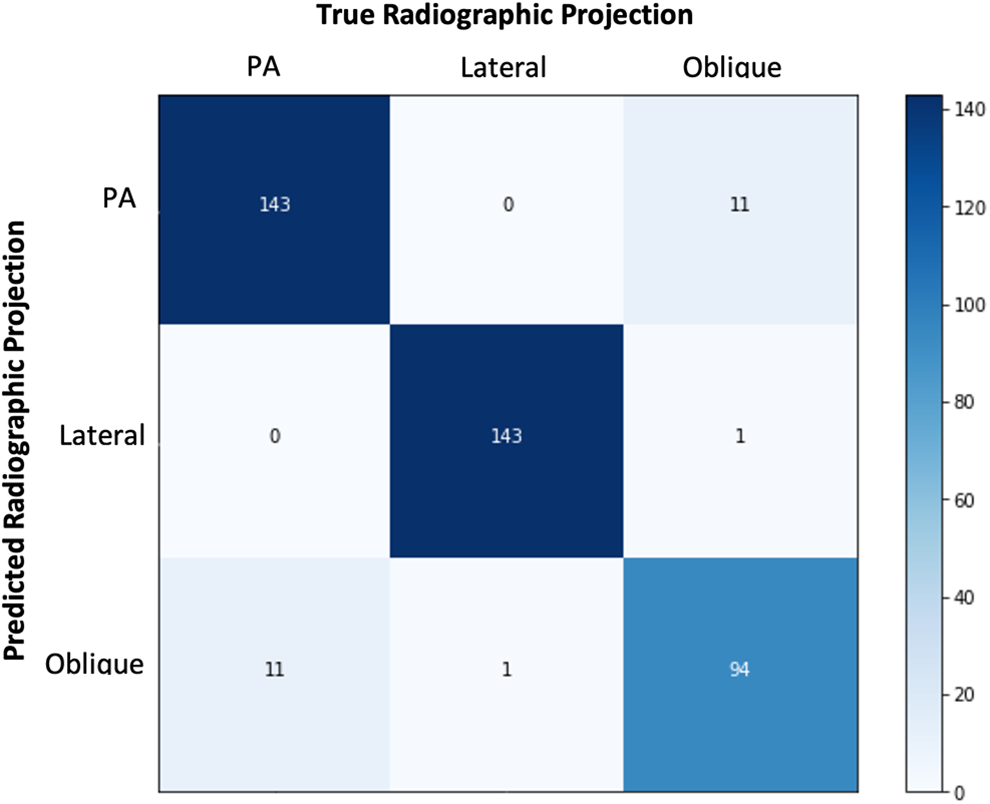
Confusion matrix comparing the number of true radiographic projection images to the number of predicted projections by the algorithm.
Global and Class-Specific Performance Metrics*.
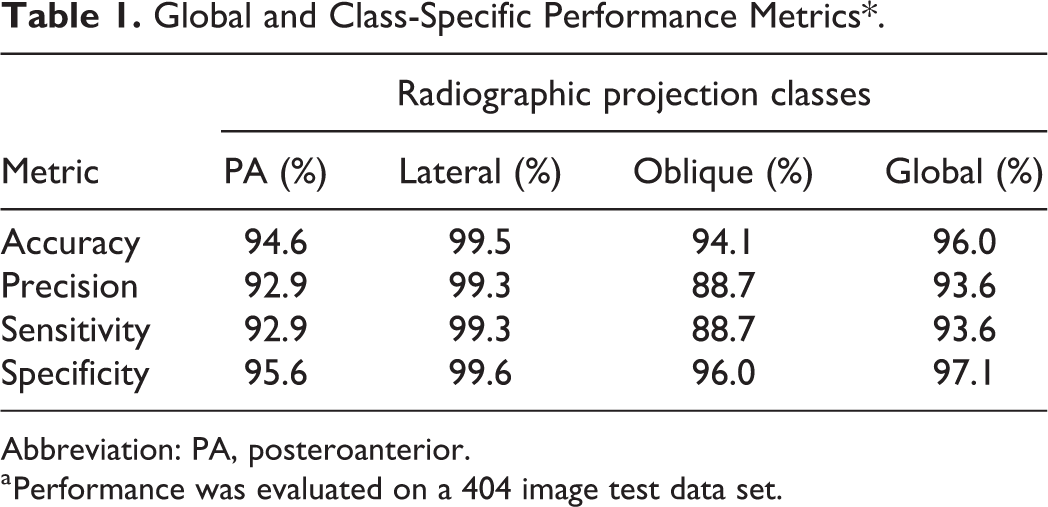
Abbreviation: PA, posteroanterior.
a Performance was evaluated on a 404 image test data set.
Discussion
The radiographic positioning of hand X-rays can be accurately and reliably predicted by a deep neural network-based computer algorithm. On standard hand X-rays, the algorithm’s overall performance accuracy was over 96%. Training data included both normal and abnormal X-rays including a variety of different hand pathologies and several variations in positioning and exposure making the algorithm robust with high external validity.
Other studies used convolutional neural networks to assess hand X-rays. Spampinato et al developed an algorithm to determine skeletal bone age from hand X-rays with an accuracy of 79%. 12 A more recent study by Tecle et al used a convolutional neural network for second metacarpal osteoporosis screening with a full pipeline accuracy of 93.9%. 13
There were limitations to this study. The radiographic projection of each X-ray in the data set was labeled by a single individual. If there were errors made during the labeling process, this would affect the performance of the final algorithm. Fortunately, the classification of hand X-rays as PA, lateral, or oblique is a straightforward task and one can expect that there were minimal errors made. This could be addressed by having 2 individuals label every X-ray for redundancy or include radiology-trained labelers to ensure appropriately labeled data. An additional limitation was the use of transfer learning on a pre-existing neural network as opposed to developing and training a custom neural network from scratch. While a custom neural network may achieve better performance because its individual layers could be designed to best capture the input data presented, the use of transfer learning on the ResNet152 model permitted quicker model development with less computational resources.
This pilot project acts as the first step towards an important pipeline in AI-assisted diagnosis and management in hand surgery. Further work will involve using object detection to localize areas of pathology as well as the measurement and calculation of important radiographic parameters such as fracture angulation and bony alignment. Once these algorithms are combined, the resultant technology will serve a myriad of different uses. For researchers, these algorithms could rapidly analyze large databases of X-rays to identify specific pathologies of interest and report important objective radiographic metrics. For quality improvement, these algorithms could provide feedback to technologists who obtain these X-rays, surgeons performing bony procedures or industry partners whose hardware is captured in these X-rays. Most importantly, however, for clinical applicability, these algorithms will provide anywhere and anytime clinical decision support to health care providers who routinely obtaining these X-rays in their clinical practice.
Footnotes
Declaration of Conflicting Interests
The author(s) declared no potential conflicts of interest with respect to the research, authorship, and/or publication of this article.
Funding
The author(s) received no financial support for the research, authorship, and/or publication of this article.
Level of Evidence
Level 1, Therapeutic