
Abstract
In current study, microstructural, mechanical and corrosion behaviour were investigated with incorporation of dual reinforced AZ91D surface composites. This research was carried out for enhancement of the bio-degradability in biological environment. The surface composites were successfully fabricated by friction stir processing method with a rotation speed of 800 rpm, travel speed of 80 mm/min and 2.5° tilt angle at multi-passes. The surface properties were characterized via optical, SEM, EDS, XRD and EBSD techniques. The microstructure showed that the reinforcements were equally distributed into the surface matrix after 3-passes for sets of composites. After 3-passes FSP average grain diameter of the composite C (1.61 μm) was smaller than that of composite A (1.86 μm) and composite B (1.63 μm), because of the strong shear deformation and generated friction heat, which occurred via dynamic recrystallization between grains in the processed zones. The microhardness of Composite C (162 Hv) has a higher than the composite A (125.2 Hv) and composite B (146.2 Hv). The ultimate tensile strength of composite A (152.7 MPa) was greater than that of composite B (133 MPa) and composite C (111.3 MPa). Furthermore, the corrosion resistance at 7, 15 and 30 days of immersion of composite C was higher than that of composite A and composite B, because of the domino effects and better bio-mineralization with the addition of Y2O3 and ZrO2 particles. The typically worn surface revealed reduced deep pits, pits and cracks due to better ionization of the hydrogen generated during immersion. Finally, this research was carried out for treatment of bone defects and fractures as well as improving corrosion resistance of the mg-containing biocompatible implants.
Keywords
Introduction
The AZ91D magnesium alloy is a lightweight metal with an impressive strength-to-weight ratio and is easy to use. It is highly desirable for use in biomedical industries, especially for application in bone implants, because of its better degradability. 1 In recent decades, significant advancements have been made in magnesium surface nanocomposites, while maintaining the original toughness of the surface matrix.2,3 However, AZ91D alloys still face challenges that delay their widespread consideration because of their lower mechanical strength and corrosion resistance. 4 Currently, magnesium alloy surfaces are successfully modified via FSP technique. However, a combination of two or more bioactive nanoparticles incorporated into the surface may enhance the surface properties for bio-activity during implantation.5,6
In many studies, materials based on Y2O3, HA and ZrO2 are used as single reinforcements in biomedical applications to obtain implants as well as different coatings for implants.7,8 ZrO2 is a bio-natural, which has similar properties to those of titanium without affecting the bone growth rate of osteoblasts. At the same time, ZrO2 nanoparticles enhance anti-bacterial behavior after incorporation into solid-state coatings. 9 The addition of Y2O3 nanoparticles results in less dissolution into human body fluid and stabilizes the crystals of the ZrO2 crystal structure, which controls the porosity of the modified AZ91D surface matrix. 10 Similarly, the addition of HA nanoparticles enhances better cell attachment and interface shear bond behavior during bio-activities. Additionally, increasing the cell interaction between the bone tissue and the implant material reduces the biodegradability rate, resulting in rapid bone growth and regeneration.11,12 Therefore, the biocompatibility of biodegradable implants is prohibited mainly by the release of degradation products, where reduced degradation leads to improved biocompatibility and prevents mechanical integrity. The generation of H2 in degradation is the most important factor of AZ91D alloys for orthopedically implants in human body.13 –17 A larger released H2 content increases the corrosion rate during immersion. Moreover, the dissimilar joints of Mg, specifically AZ31B and AZ91C, produced through the FSW process showed a tensile strength of 186 MPa, accounting for 78.81% of AZ91C and 70.72% of the other parent metal, AZ31B. This reduction in tensile strength was attributed to the presence of Mg17Al12 constituents in various areas of the fractured surfaces. 18 Similarly, the joint of AISI-SAE 1010 (steel)–CDA 101 (copper) alloys exhibits enhanced mechanical properties suited for industrial medical applications that necessitate strong and durable weld joints to satisfy current technological requirements and process efficiency. 19
In addition, the addition of biological reinforcement particles could control the degradation phenomena. Some investigations have revealed improvements in microstructure, densification, plastic deformation and extensive strain with the incorporation of (SiO2, ZrO2, CeO2, HA, Ag, Y2O3 and FA etc.) reinforcement, which enhances the hardness and tribological properties such as erosion and corrosion resistance.20 –22 Additionally, a property point of view minimizes the stress shielding effects such that the tensile strength and microhardness are closer to those of natural bone. 23 In addition to reinforcements and effect processing parameters, mechanical twins exhibit an important behavior during deformation,24 –28 which directly affects strengthening mechanisms such as texture evolution and fracture imitations into the surface matrix.29 –31
To overcome this problem, several single bio-based ceramics reinforced surfaces have been fabricated via the friction stir processing (FSP) method, but challenges such as corrosion resistance, osseointegration, self-degradability and biocompatibility have not yet been resolved. So, this research works have been investigated on dual reinforced mg-based surface composite for implants. It is hope that the different properties of the bioactive particles incorporation in to the mg surface enhanced the superior biocompatibility, immunomodulatory properties, anti-bacterial ability and improved corrosion resistance in human implants. The main aim of current research in the development of composite A (Y2O3/HA), composite B (Y2O3/ZrO2) and composite C (ZrO2/HA) dual-reinforced AZ91D surface composites is to reduce the fast degradability of the AZ91D alloy matrix. The reinforcement nanoparticles have been incorporated into the AZ91D alloy via the friction stir processing method. The weight percentage of the reinforcements is selected based on application, properties required to enhance and keep unchanged phase diagram of the AZ91D alloy. Similarly, the combinations of the reinforcements are selected based on their properties such as Y2O3 increased the tensile strength in the matrix, ZrO2 increased the bond strength between matrix and HA increased the stability of tissue. The microstructure, microhardness, tensile and corrosion properties were analyzed in terms of grain refinement and equal distribution of the reinforcement particles after multiple FSP passes.
Materials and experimentation
The plates of the AZ91D alloy (chemical composition shown in Table 1) with a length of 300 mm, width of 60 mm and thickness of 6 mm were selected as the processing surface, as shown in Figure 1(a). Before FSP, holes were made on the plate using a CNC milling machine with 3 mm depth and 2 mm diameter drill bit (Figure 2(a)). Furthermore, the holes were filled with 15 wt% reinforcement nanoparticles (average size of 50 nm) (Figure 2(b)) and the weight percentages (Table 2) of the composites are shown in Figure 1(b). Different pass (1, 2 and 3 passes) surface composites were fabricated with an H13 steel tool at the 2.5° tilt angle as shown in Figure 1(c)–(e) and Figure 2(c).The friction stir process was subsequently performed on the FSW machine, which utilized a stirring tool with a shoulder of 12.3 mm in diameter and threaded taper cylindrical pins of 6, 4 and 3.9 mm in root diameter, tip diameter and length respectively, as shown in Figure 1(g). The FSP parameters, such as the tool tilt angle, tool rotational speed and tool traverse speed are set to 800 rpm and 80 mm/min after several trial tests. This study reveals the impact of dual reinforcement and FSP passes on the microstructure and mechanical properties of processed surface composites (Figure 2(d)).
Chemical compositions of AZ91D magnesium alloy.

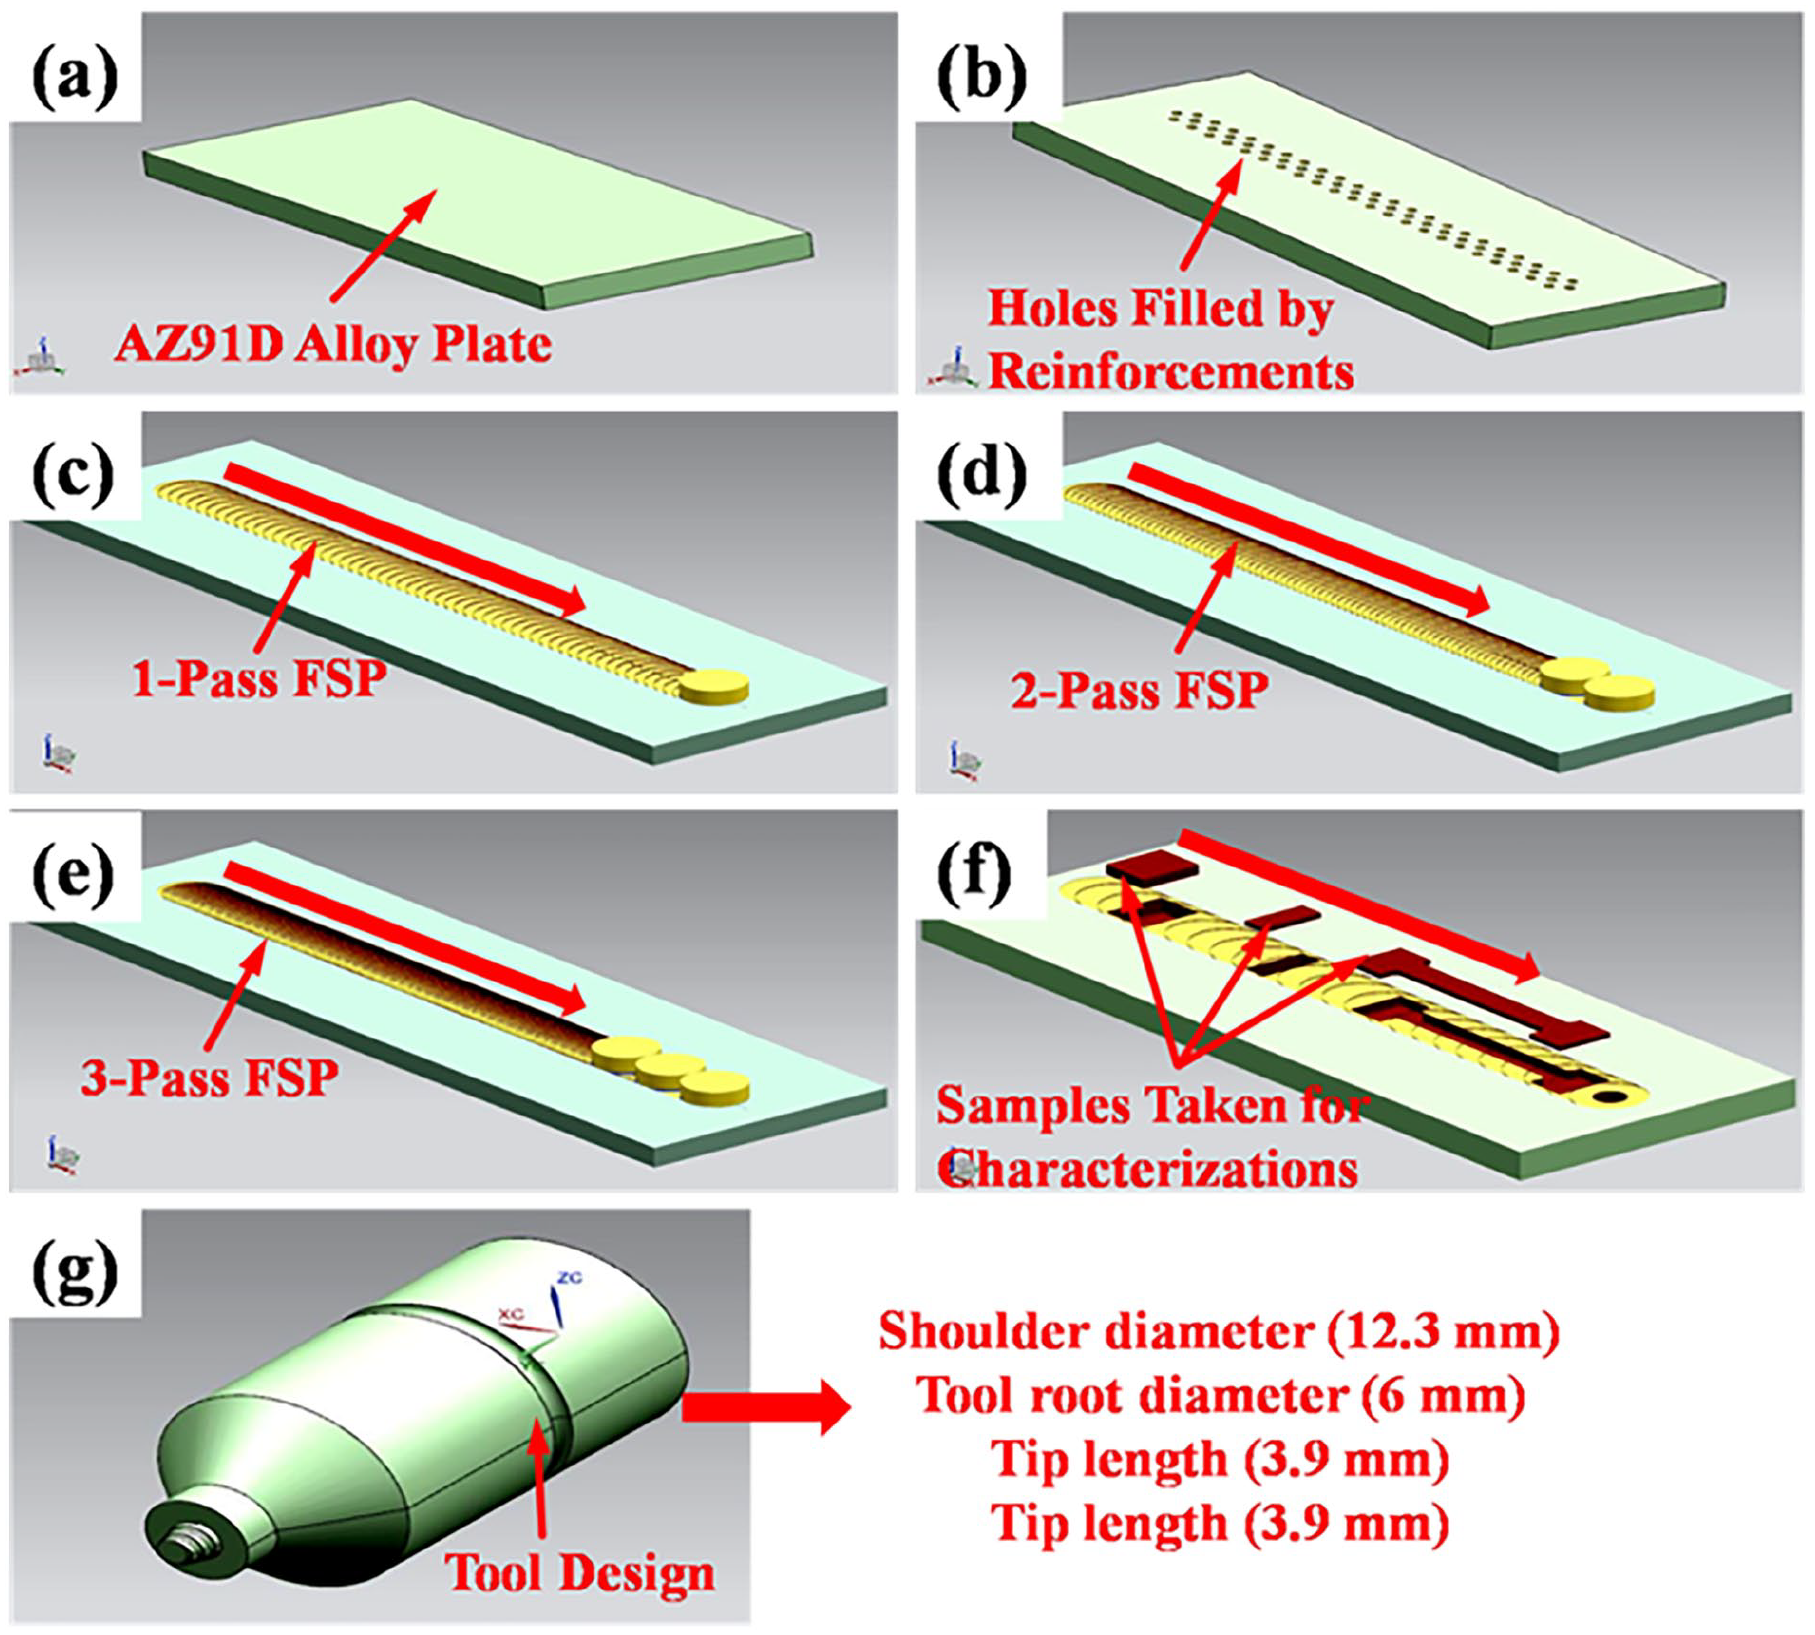
Schematics of the FSP processes (a) AZ91D alloy plate, (b) prepared hole, (c) 1-pass FSP, (d) 2-pass FSP, (e) 3-passes FSP, (f) characterizations of prepared surface composite and (g) fabricated tool design.
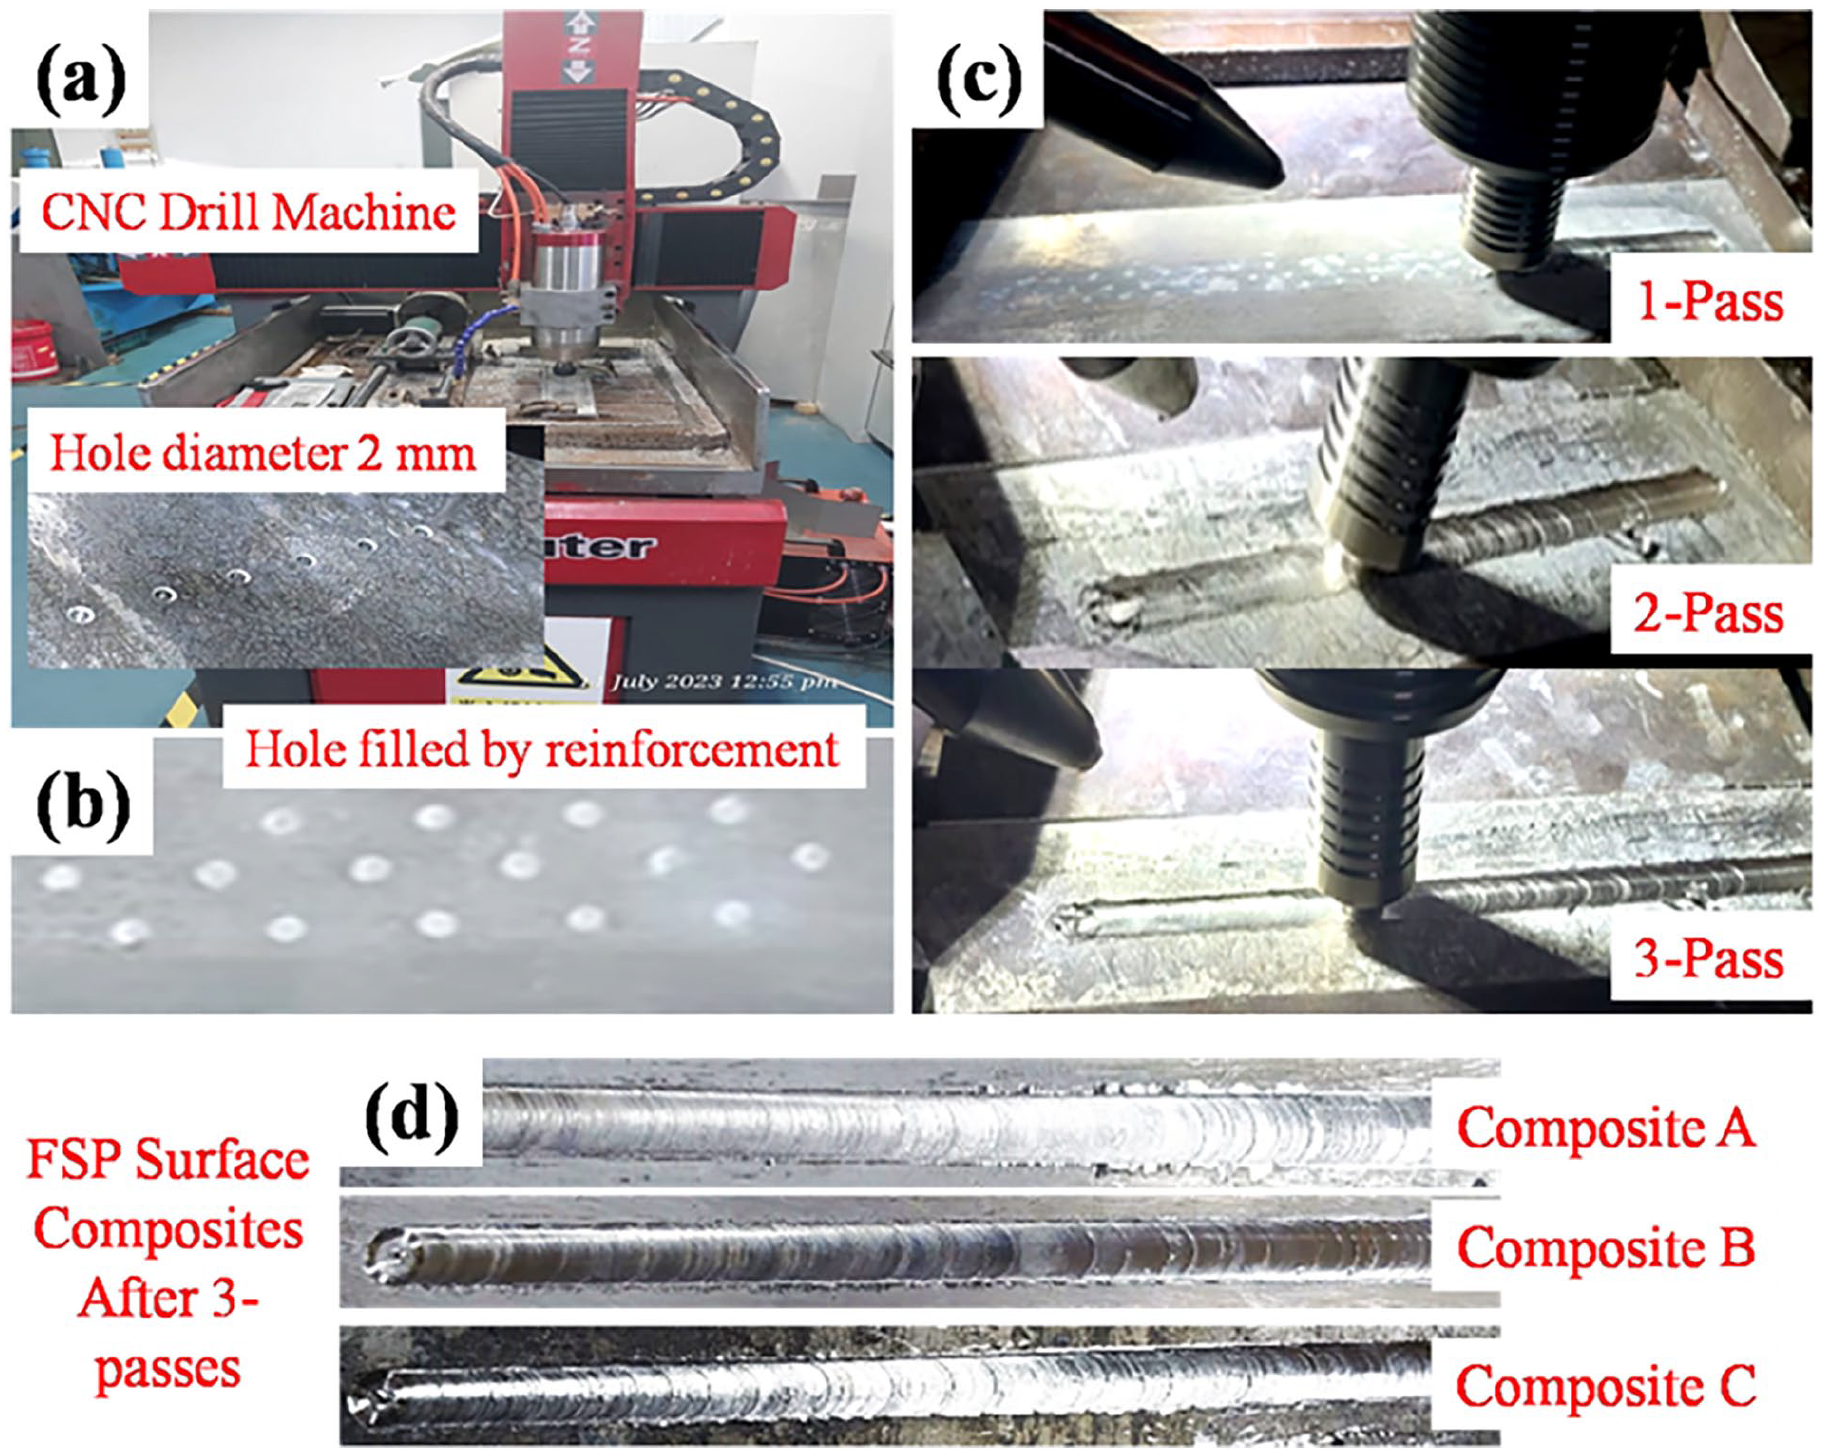
(a) AZ91D alloy plate and hole making method, (b) hole filled by reinforcement, (c) surface composite fabrication after 1, 2 and 3-pass and (d) final prepared surface composites (composite A, composite B and composite C).
Weight percentage of the composite A, composite B and composite C.

The microstructures of the AZ91D alloy and FSP composite samples were studied from the stir zone. The microstructure, microhardness, tensile test and corrosion test samples were cut using wire electrical discharge machining in the required dimensions as shown in Figure 1(f). The FSP samples were polished with 80–3000 μm SiC abrasive paper, after that polished with 0.5–2 μm diamond polishing agent to achieve a mirror surface. Furthermore, samples were etched for 40 s in a mixed solution of 4.2 g picric acid, 10 ml acetic acid, 10 ml distilled water and 75.8 ml alcohol. The microstructures and elemental distributions in different areas of the FSP samples were characterized via optical microscopy (OM, Olympus BX53M), scanning electron microscopy (SEM, ZEISS Gem-ini SEM 300), and energy dispersive X-ray spectroscopy (EDS). The phase compositions were examined using X’Pert Pro MPD with Cu Kα radiation (λ = 0.154 nm), the scanning angle range was 10°–70°, the scanning speed was 10°/min, the acceleration voltage was 40 kV, and the filament current was 40 mA. The grain structure characteristics were investigated in longitudinal sections of the FSP zone using electron backscatter diffraction (EBSD, Oxford Instruments) with a step size of 0.15 μm.
The microhardness along the FSP direction was calculated at 200 g load for 10 s with a Vickers hardness tester (HVS-1000 Z). Each indentation was separated by 2 mm in the stir zone. The uniaxial tensile tests of the FSP samples were performed on a 100 kN universal testing machine (WDW-100AE) with a strain rate of 1 mm/min at room temperature. To ensure the accuracy of data, each set of samples was tested three times. The dimensions of the test samples were designed according to the ISO 6892–1:2009 standard.
The corrosion test was performed via the normalized weight loss measurement method. Before the samples were subjected to the corrosion test, all the samples were cleaned of dust or foreign matter from the surface of the samples. The samples were cleaned and properly dried before the tests were performed. The simulated body fluid (SBF) solution was prepared using various chemical compositions, as shown in Table 3. All the test samples were polished with 2000 μm SiC paper followed by ultrasonic cleaning with methanol for 3 min before corrosion testing. During the test, the SBF temperature was maintained at 35°C, as per normal human body temperature. The corrosion tests were performed on FSP and substrate materials fractions of 7, 15 and 30 days, respectively. Furthermore, the mass loss was calculated via equation (1).
Reagents composition of simulated body fluid (SBF) in amounts of 1000 ml.


The mass loss was calculated via a weighing machine with an accuracy of 0.00001 g. Additionally, the corroded samples were dried at temperature of 60°C for 24 h to remove the complete moisture from the samples. To understand the long-term corrosion behavior, the worn features of the FSP samples were observed via SEM analysis.
Results and discussion
Microstructural analysis
The strong anisotropy in the matrix of an AZ91D alloy with a hexagonal close-packed (HCP) grain structure can be attributed to severe plastic deformations during FSP. 32 To analyze the cause of the increase in the strength of the dual-reinforced AZ91D alloy surface composites (composite A, composite B and composite C), optical microscopy was performed in the stir zone after 3-passes, as shown in Figure 3(a)–(c). The stirred zone grains are subjected to severe plastic deformation by the tool rotation and traverse speed, in which the grains are dynamically recrystallized. 33 Additionally, because of dynamic recrystallization and severe plastic deformation in the AZ91D alloy, the reinforcement was subjected to more homogeneous distribution and grain refinement as shown in equal microstructure in the stir zone after 3-passes. The flow of materials and equal distribution of the reinforcement particles improved with increasing FSP passes for composite A, composite B and composite C. Furthermore, the EBSD images of composite A (Figure 4(a)), composite B (Figure 4(b)) and composite C (Figure 4(c)) after 3-passes revealed that the grain size was extensively refined. Also the grain boundaries of the FSP surface after 3-passes are more stable than those 1 and 2-pass. The average grain diameter was 1.86, 1.63 and 1.61 μm for composite A, composite B and composite C respectively, after 3-passes, FSP zone due to the majority of the equiaxed-grains in the matrix, 34 as shown in Figure 4(g)–(i). Furthermore, the FSP AZ91D alloy was subjected by high-angle grain boundaries (HAGBs) due to dislocation annihilation processes includes the arrangement of dislocations between different slip systems. The restriction of dislocation migration and dislocation substructure was evaluated by grain boundaries, which mainly involves transitions between HAGBs and LAGBs. However, low-angle grain boundaries (LAGBs), consisting largely of dislocations and sub-grain boundaries, constitute a relatively low percentage as observed in Figure 4(d)–(f).
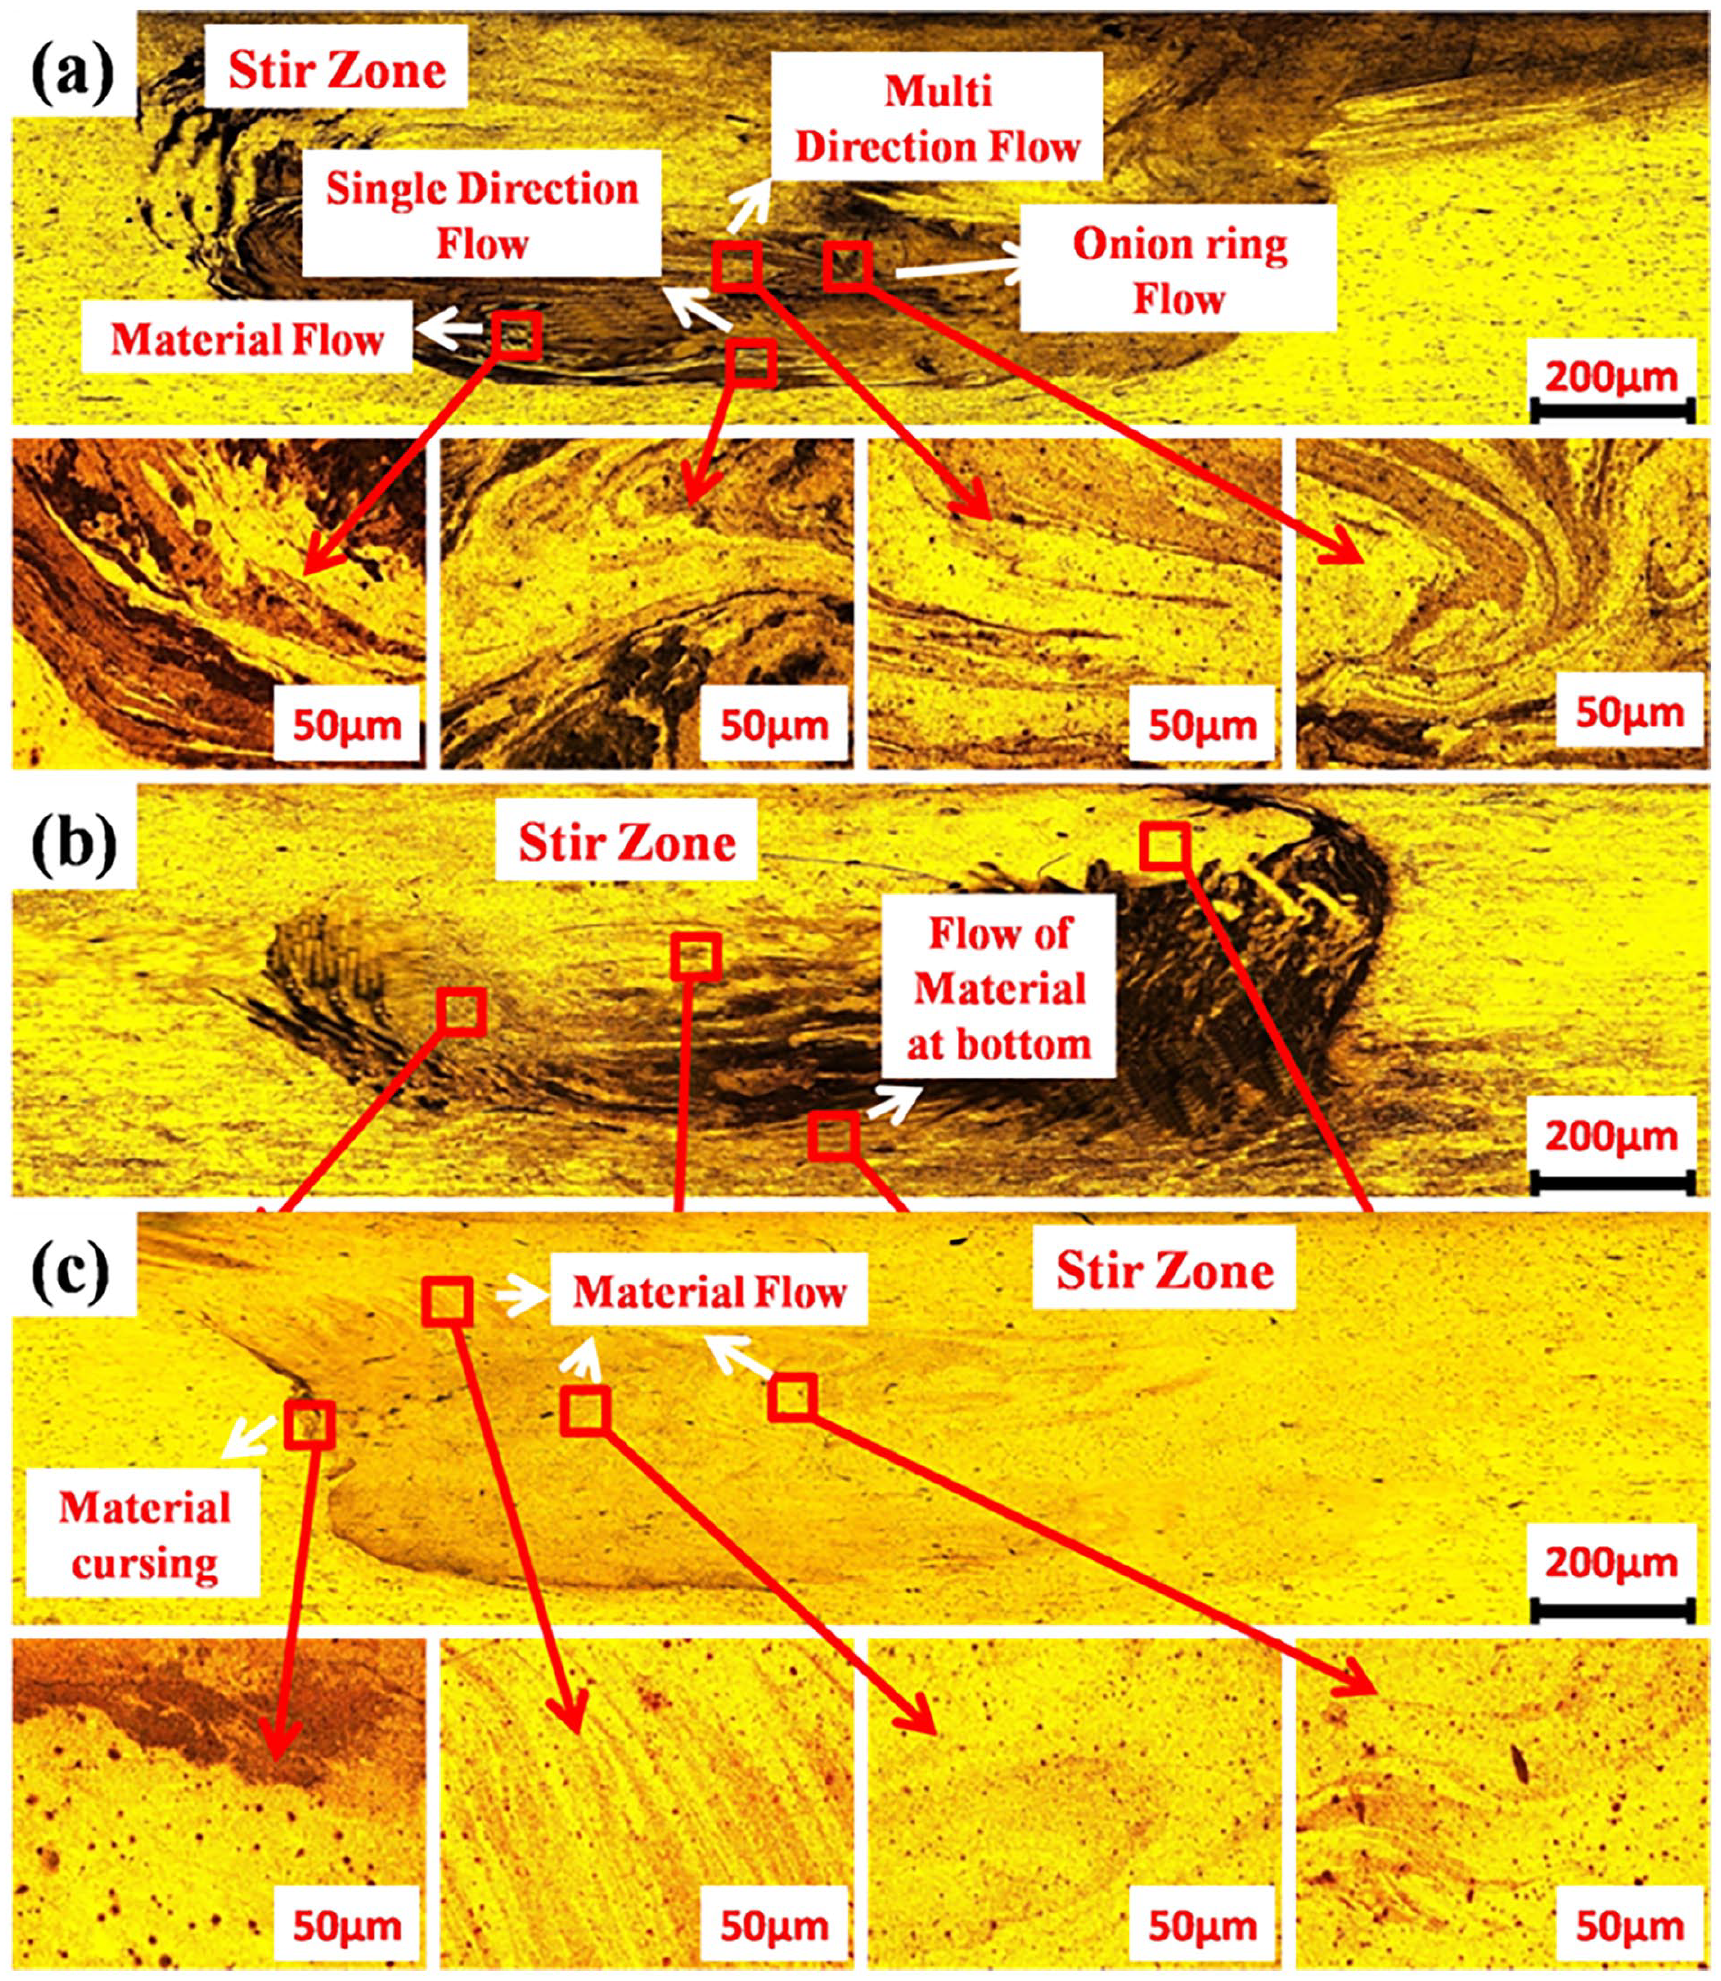
Optical images of composite after 3-passes FSP (a) composite A, (b) composite B and (c) composite C.

EBSD image of the composite at 3-passes FSP (a) composite A, (b) composite band, (c) composite C, (d) grain boundaries of composite A, (e) grain boundaries of composite B, (f) grain boundaries of composite C, (g) grain diameter of composite A, (h) grain diameter of composite B and (i) grain diameter of composite C.
Figure 5 shows the XRD patterns of AZ91D alloy and FSP composites (composite A, composite B and composite C). The distinctive peaks suggest that these are the α-Mg solid solution and the Mg-Al phase in the processed matrix. The peak position of α-Mg is a little greater than the basic peak position of Mg, which implies distortion of the crystal lattice of the present element dissolved in α-Mg. 35 The changes in the peaks corresponding to the (0001), (0002), (10-10), (10-12) and (11-20) planes of composite A, composite B and composite C changed after 3-passes. In the case of the (0002) plane, the XRD peak of composite A is slightly lower than those of the AZ91D alloy, composite B and composite C, whereas the (0001), (10-10), and (10-12) plane peaks are the same for the AZ91D alloy and all the FSP composites. This characteristic may be due to the transformation of the Y2O3 nanoparticles to other phases. In addition, the (11-20) plane peak is observed in the FSP composites but not in the AZ91D alloy. This may have occurred because of the incorporation of different combinations of reinforcements.

XRD images of AZ91D alloy, composite A, composite B and composite C FSP surface composite at 3-passes.
The EDS count and open component of the FSP composites show that the reinforcement particles shifted toward the grain boundaries because of the plane symmetric tilt boundaries for composite A (Figure 6(a)–(c)), composite B (Figure 6(d)–(f)) and composite C (Figure 6(g)–(i)). This contains may form improper quasi-symmetric grain boundaries. 36 However, these grain boundaries have symmetrical equivalent planes on both sides of the boundary. The reinforcement particles shifted on the grain boundaries therefore improper plane symmetry occurred due to variations in the atomic bond energy which formed Coincidence Site Lattice (CSL) boundaries. The grain boundary plane frequencies are inversely correlated with the grain energy, as shown in equation (2). 37
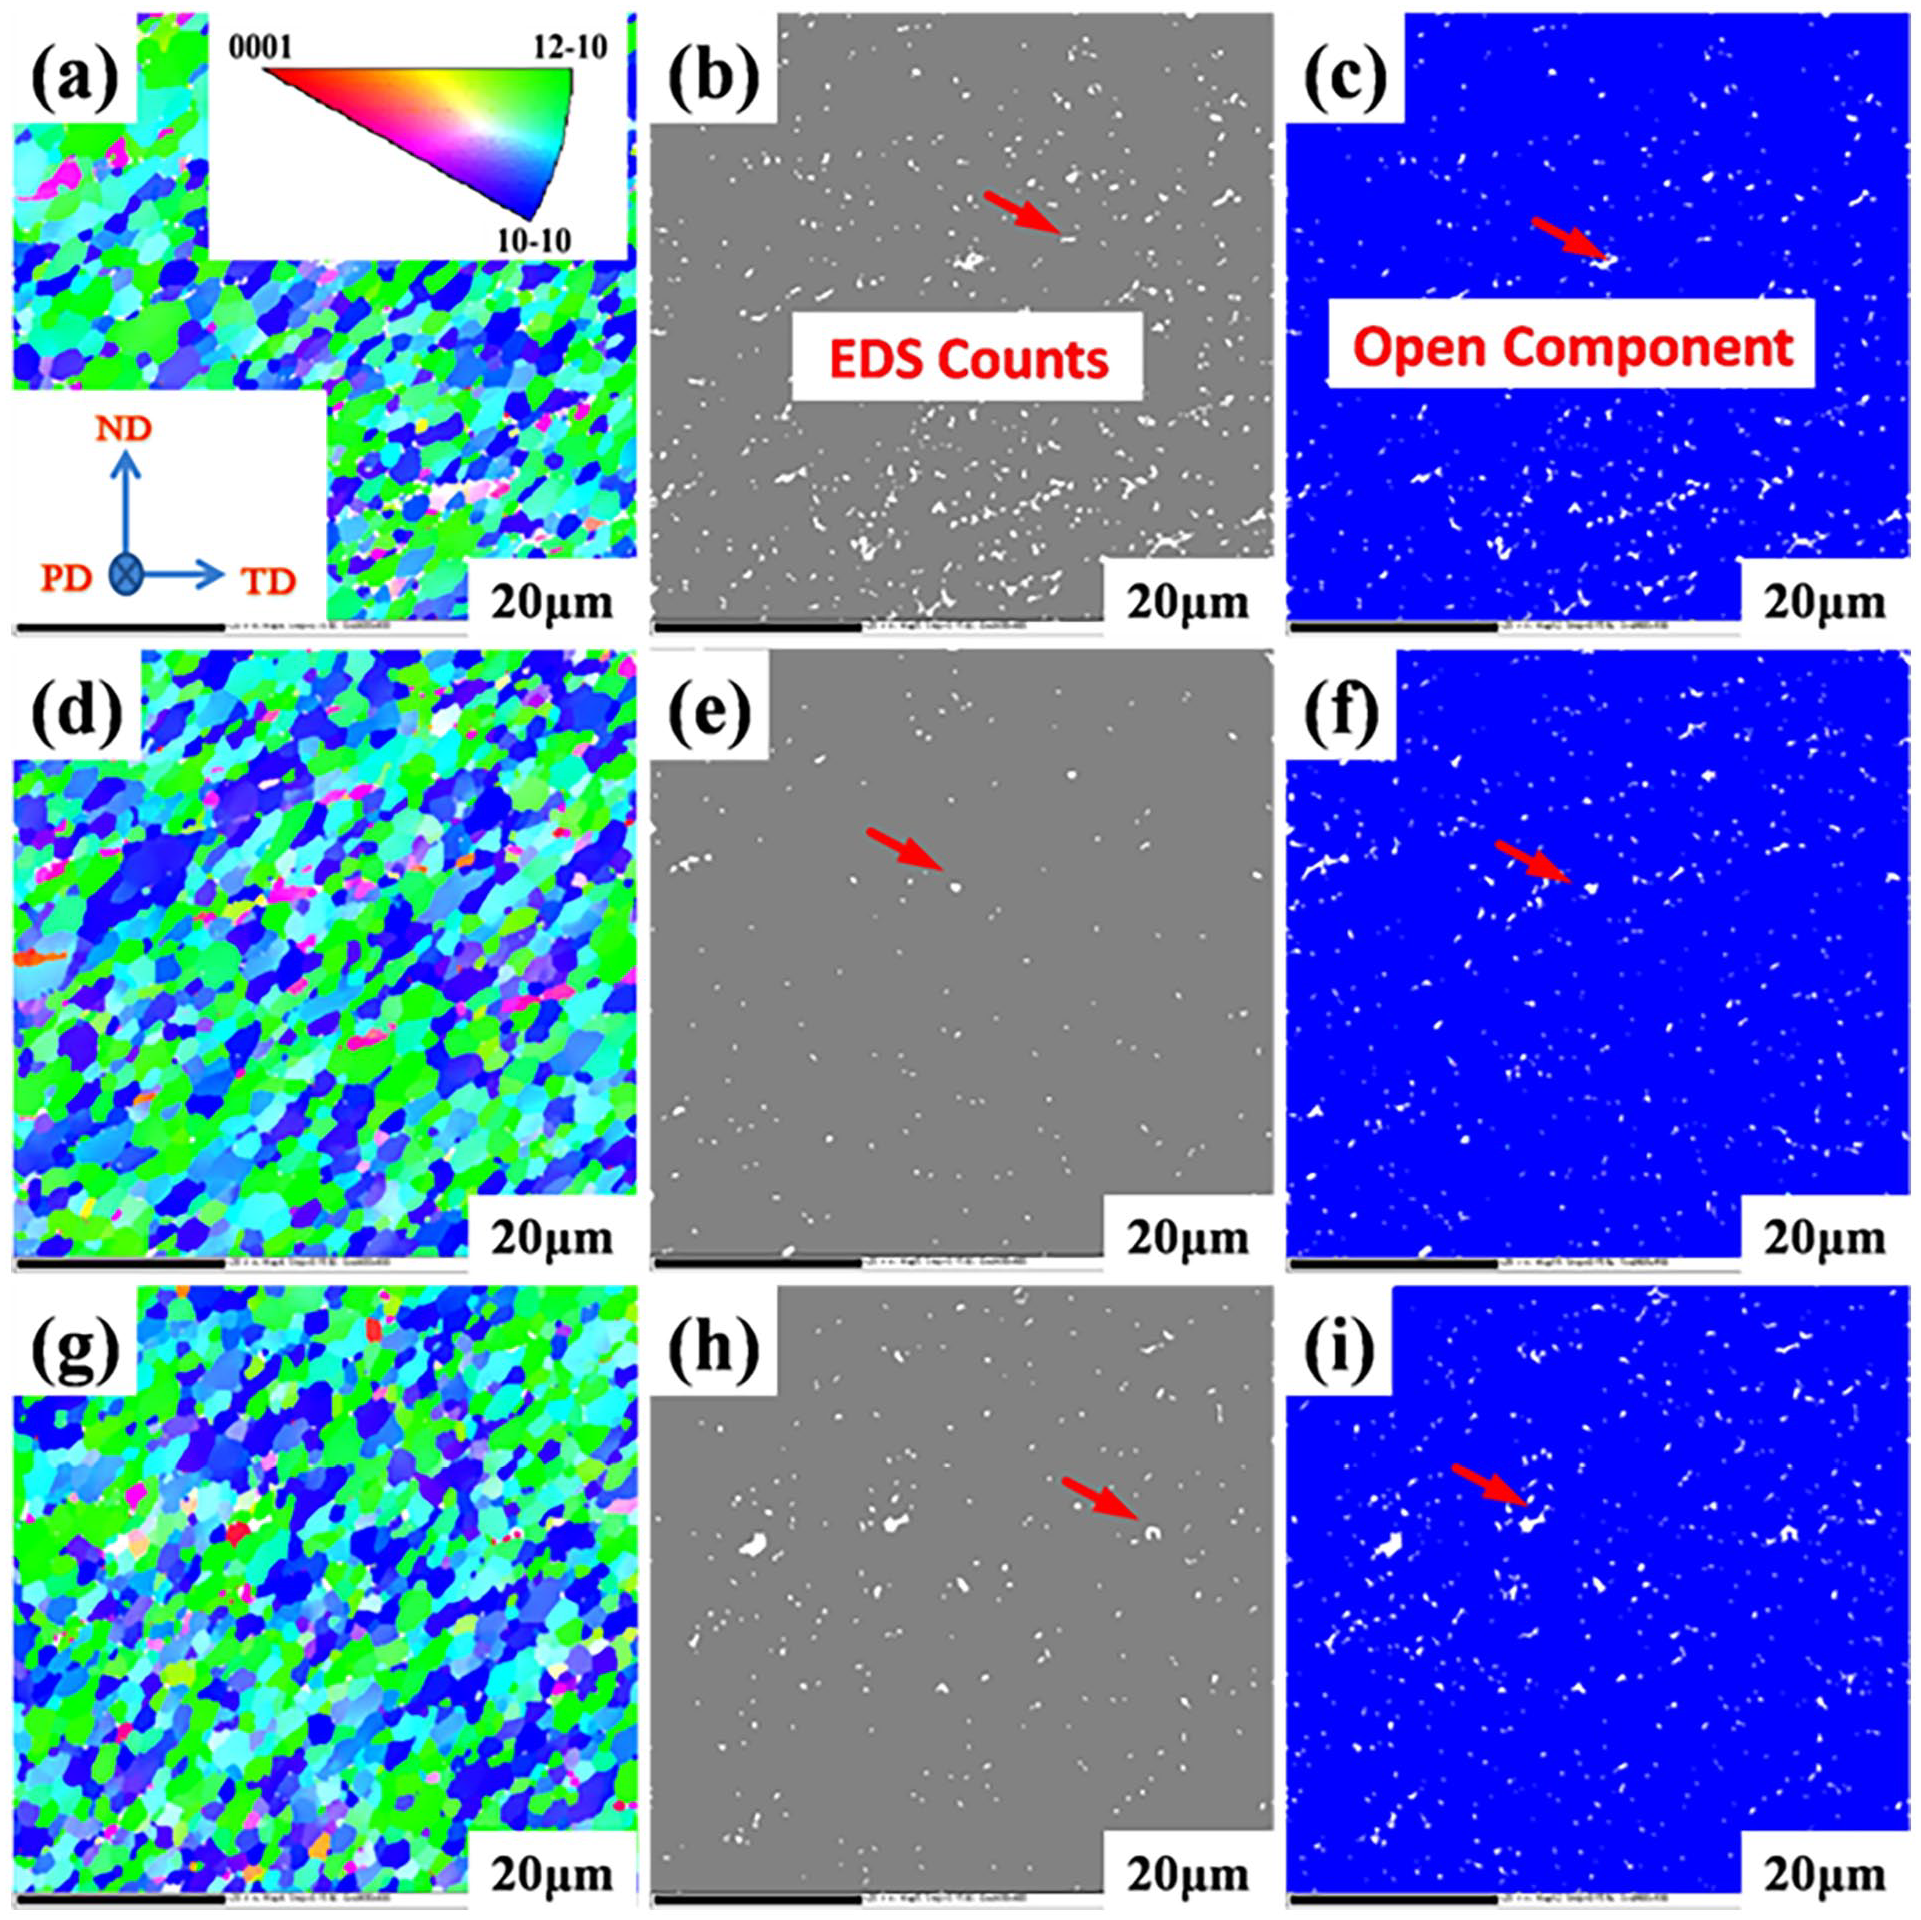
EBSD images with EDS counts of FSP surface composite at 3-passes (a) composite A (b) and (c) corresponding EDS and open components, (d) composite B (e) and (f) corresponding EDS and open components (g) composite C (h) and (i) corresponding EDS and open components.

where σ (j/m2) is the grain boundary energy, G(J) is the total absolute Gibbs energy of a multi-component, solid-ploy crystal, single-phase, consisting of grains and grain boundaries, A(m2) is the total interfacial area of all the grain boundaries in the pulse crystal, and the ρ(Pa) pressure, T(K) temperature, I (ni, mole) amount of components, and (DOFs) degree of freedom are constant values.
The most frequent (0001) grain boundary is the minimum energy. The energy of the sigma 3, 7 and 13 b grain boundaries varies significantly depending on the grain boundary plane, which is equal for composite A (Figure 7(a)–(c)), composite B (Figure 7(d)–(f)) and composite C (Figure 7(g)–(i)). Hence, equal plastic deformation of the grains occurs after 3 FSP passes. This behaviour may indirectly confirm that reconstructed grain boundary plane distributions are realistic and that grain boundaries are equilibrated during FSP. Thus a similar sigma value of the CSL grain boundary may exist for constant plane misorientation with varying additions of reinforcement. The hexagonal close packed material structures as magnesium alloys have been found to be highly capable of special grain boundaries formation. This capability has been already approved through detecting boundaries specific CSL in thermo mechanically processed magnesium alloys. The grain boundaries with 30° <0001> misorientation relationship were frequently observed in dynamically recrystallized AZ91D alloy. However, 30° [0001] grain boundaries were stable by grain rotation. 38 The near 30° boundaries strong textures were observed in AZ91D alloy. In general, the Σ3b, Σ13 and Σ15 are the most common CSL boundaries in thermo mechanically processed magnesium alloys.

EBSD image of CSL boundary of FSP surface composite at 3-passes (a) composite A (b) and (c) corresponding CSL boundary representation and sigma value of plane orientations, (d) composite B (e) and (f) corresponding CSL boundary representation and sigma value of plane orientations and (g) composite C (h) and (i) corresponding CSL boundary representation and sigma value of plane orientations.
Figure 8(a)–(f) shows the recrystallization fraction of the dual reinforced FSP surface composites. The recrystallized, sub-structured and deformed grains are almost equal in percentage at 2° misorientation for composite A, composite B and composite C. However, at 15° misorientation, composite A has higher recrystallized grains and a lower sub-structured grain percentage than composite B and composite C. This phenomenon may occur at higher flows of Y2O3 and HA nanoparticles due to severe plastic deformation and grain circulation during FSP. 39 Hence, these types of grain formation may affect the mechanical properties, such as enhancing the tensile properties and reducing the microhardenss of the FSP matrix.
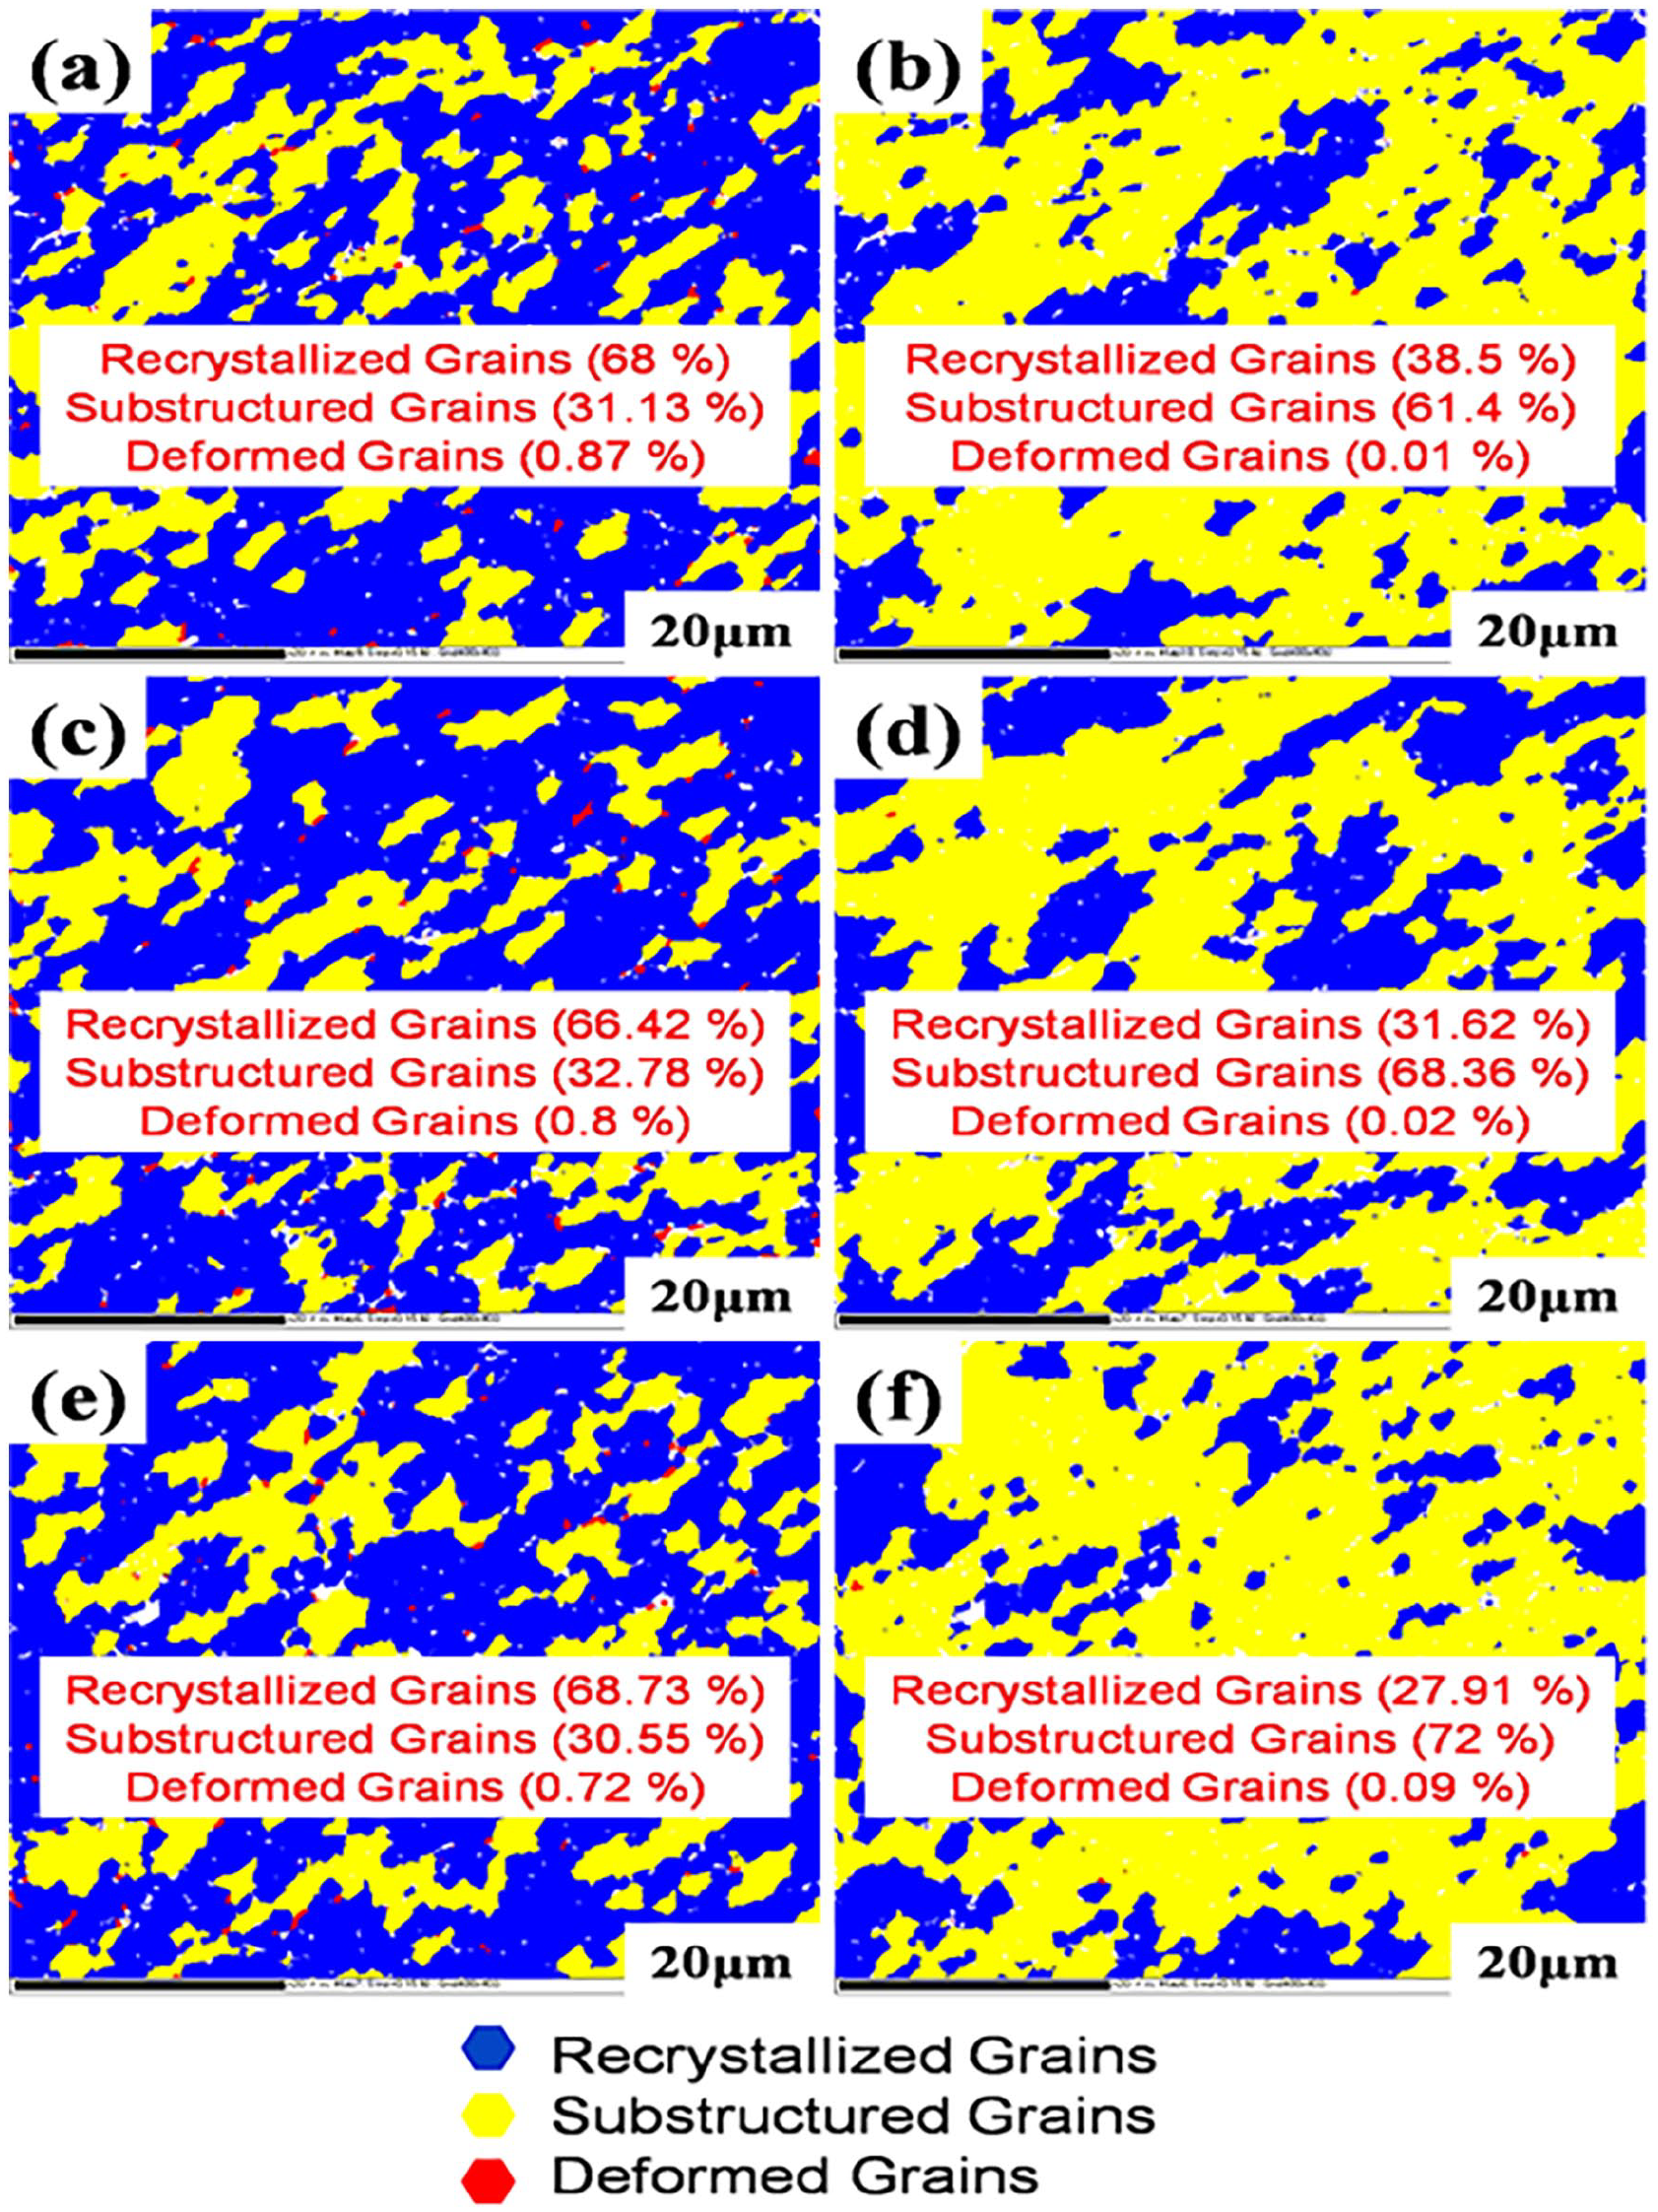
Recrystallization fraction of the FSP surface composite after 3-passes (a, b) composite A (a) at 2° misorientation angle (b) at 15° misorientation angle, (c, d) composite B (c) at 2° misorientation angle (d) at 15° misorientation angle and (e, f) composite C (e) at 2° misorientation angle (f) at 15° misorientation angle.
The recrystallization fractions such as the recrystallized sub-structured and deformed grain percentages of FSP composite A, composite B and composite C after 3 FSP passes. It can be observed in the FSP zone show that the recrystallized grains occupy almost 68% (Figure 8(a)), 66.42% (Figure 8(c)), and 68.73% (Figure 8(e)) area at 2° misorientation angle and 38.5% (Figure 8(b)), 31.62% (Figure 8(d)) and 27.91% Figure 8(f)) at 15° misorientation angle for composite A, composite B and composite C respectively. Furthermore, the deformed grains are negligible compared with the recrystallized and sub-structured grains in the FSP zone. This occurs because of variation in strain hardening between grains with grain refinement and frictional heat produced by FSP tool rotation. Basically, the deformation processing factors such as inhomogeneous strain distribution, stress accumulation, stored energy, types of phase composition, available slip system, microstructural variability, texture, initial grain size, lattice distortion energies, solute grain clustering, deformation temperature, diffusion rates and strain path were at play in determining the dynamic recrystallization mechanism in AZ91D metallic materials. Therefore all these factors during dynamic recrystallization were help in the development and control of microstructure to meet surface properties. 40
The MODF (modified orientation distribution function) is an excellent technique employed to characterize the orientation distribution of the crystals within polycrystalline composite A (Figure 9(a) and (b)), composite B (Figure 9(c) and (d)) and composite C (Figure 9(e) and (f)) after 3-passes. This map represents the distribution density of the crystal orientation of each grain, which was obtained via the experimental measurement method, and the overall distribution of the crystal orientation in the material can be obtained by countering the orientation data of multiple grains. 41 Figure 9(b), (d) and (f) shows the experimental texture map intercept plots (w2 = 0°, 30°, 60°) after 3 FSP passes. At each position, various textures, including pyramidal textures {0001} <11–20> are present. During FSP, significant shear forces act in the matrix, which leads to the rotation of the crystal planes by the continuous slip deformation in the matrix. To introduce the cross-shear deformation, the AZ91D FSP surface was rotated 180° around their longitudinal axis. The FSP surface subjected to this cross-shear deformation showed a uniform fine microstructure with weak basal texture. Hence, composite A shows enhanced tensile strength compared to composite B and composite C. The enhanced strength was ascribed to the uniform fine microstructure, while the enhanced ductility was explained by the weakening of the basal texture, which originated from the change in texture behaviour.
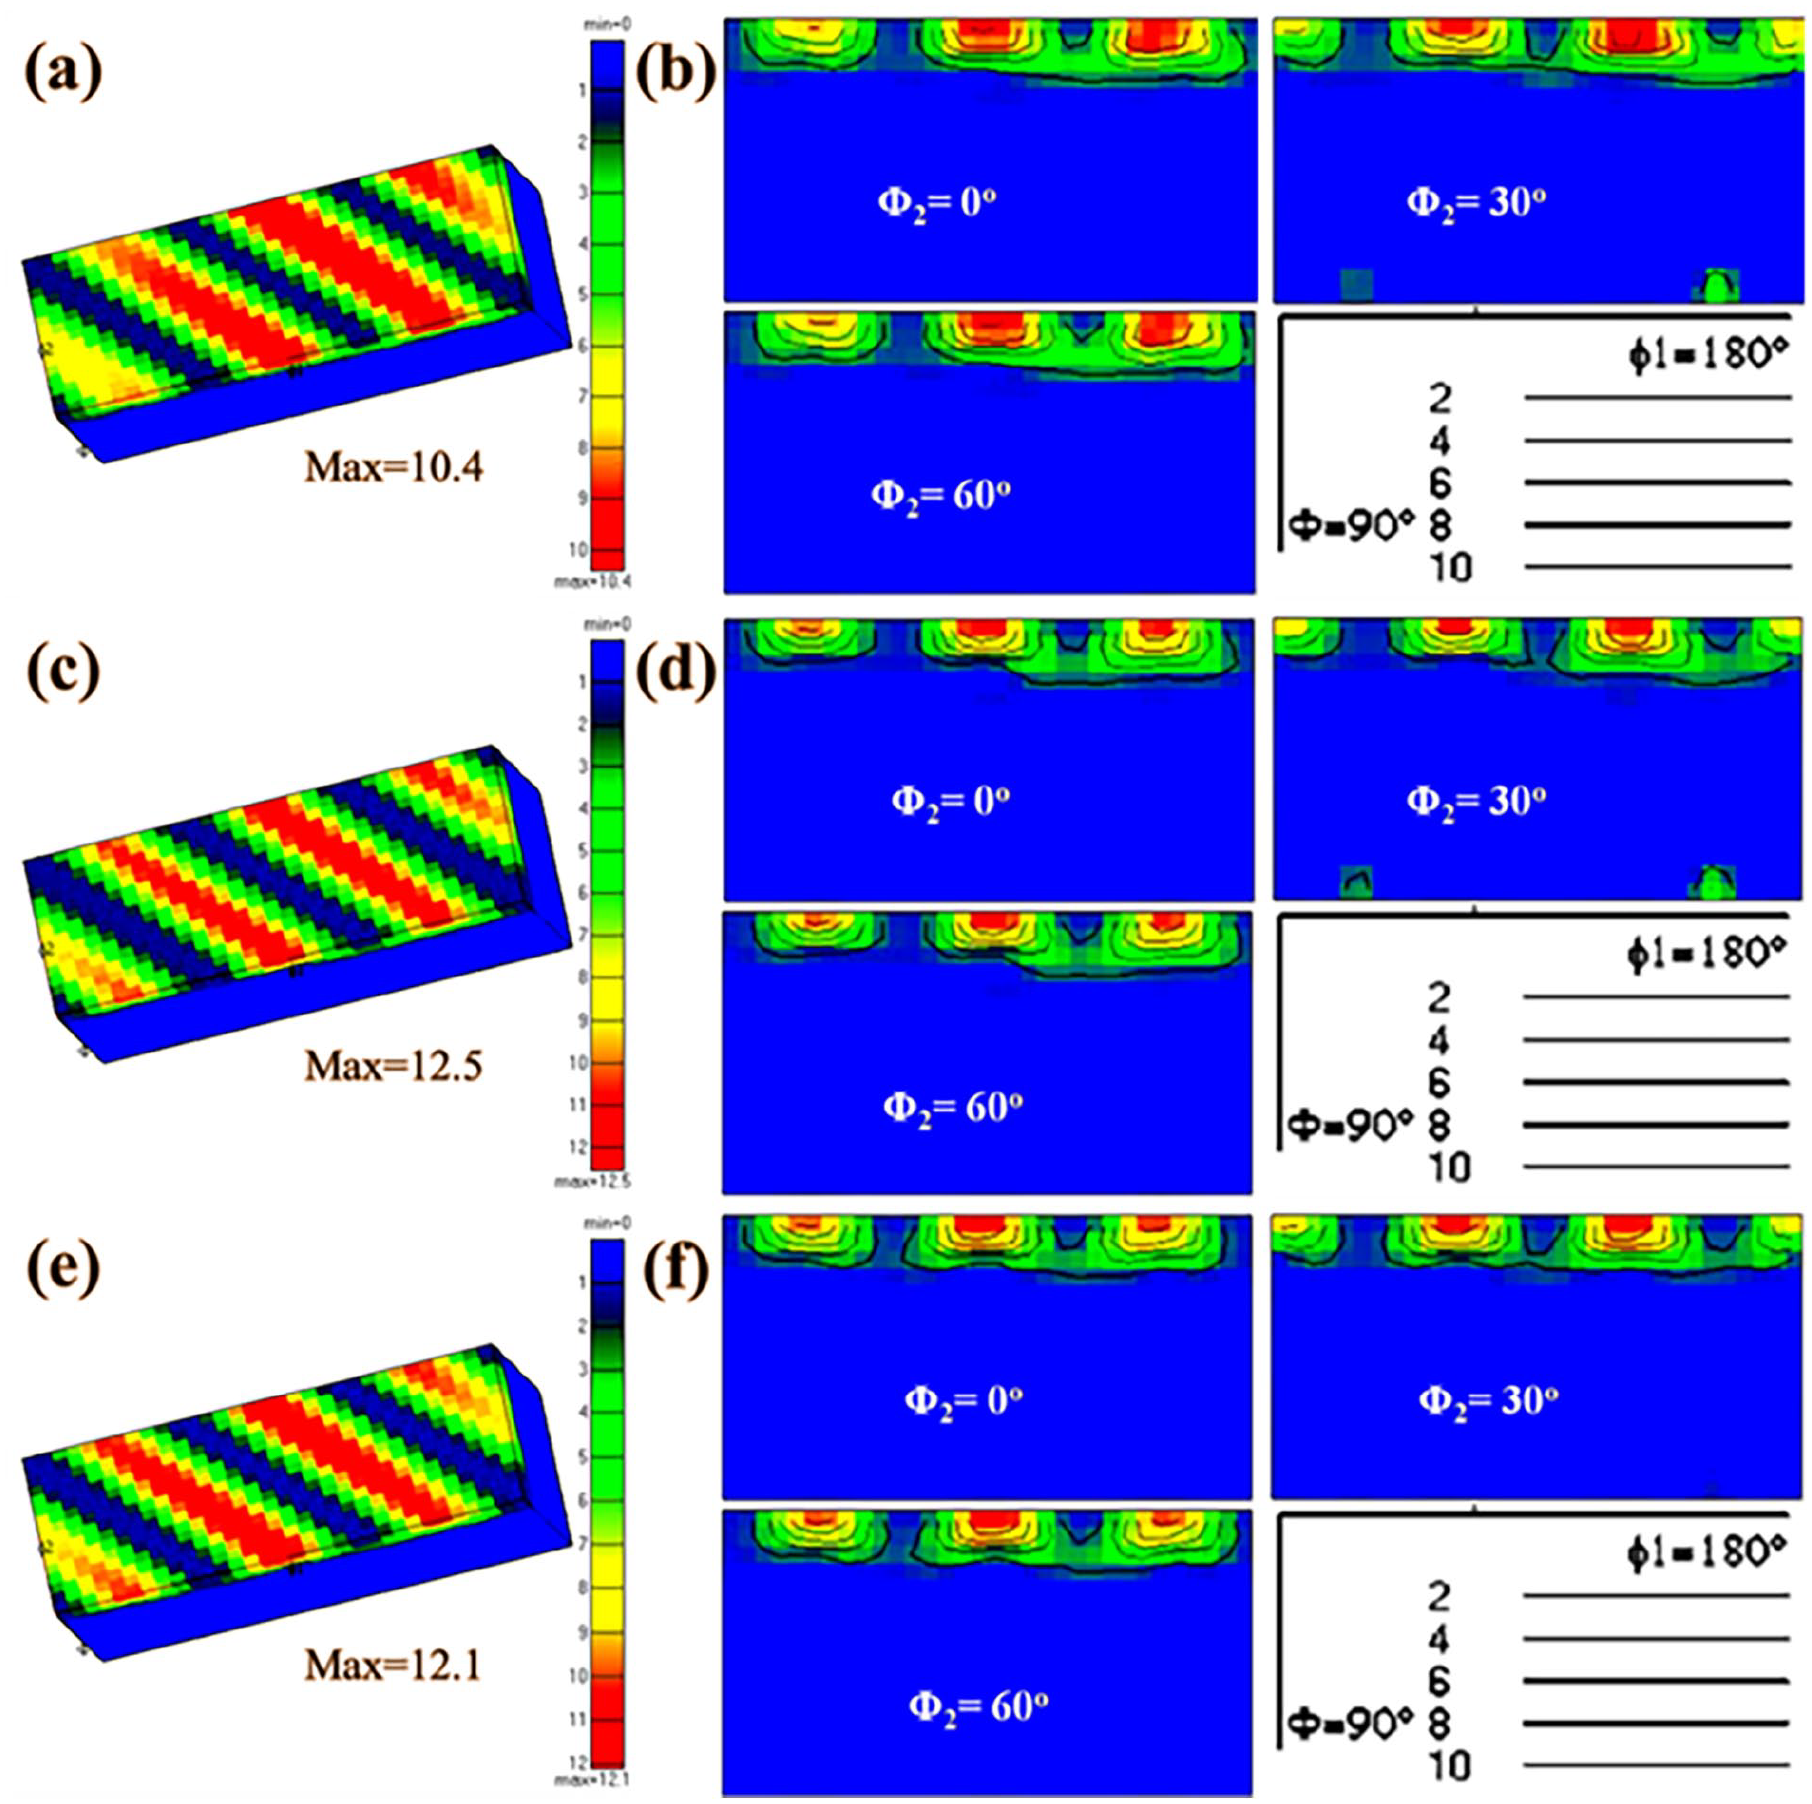
MODF of FSP surface composite after 3-passes (a) grain distribution function of composite A (b) texture serial section at 0°, 30° and 60°, (c) grain distribution function of composite B (d) texture serial section at 0°, 30° and 60°, and (e) grain distribution function of composite C (f) texture serial section at 0°, 30° and 60°.
The nature of the texture in the FSP composites was confirmed on the basis of pole figures (PFs), as shown in Figures 10(a), 11(a) and 12(a), for composite A, composite B and composite C. The multi uniform distribution (MUD) of the plane for composite A (66.73), composite B (64.82) and composite C (66.84) was affect the AZ91D matrix texturing behaviour with the addition of the reinforcement, as did the inverse pole figures. The pole figures are observed at the {0001} plane and <11-20> slip direction textures after 3-passes.The {0001} plane misorientation angles are almost equal for all the composites, but <11-20> slip direction of the composite C (Figure 12(b)) is less than that of composite A (Figure 10(b)) and composite B (Figure 11(b)).

(a) Pole figures of FSP surface composite A at {0001} plane and <11-20> slip direction after 3-passes (b) multi uniform distribution of the plane at different misorientation angle and (c) inverse pole figures.

(a) Pole figures of FSP surface composite B at {0001} plane and <11-20> slip direction after 3-passes (b) multi uniform distribution of the plane at different misorientation angle and (c) inverse pole figures.
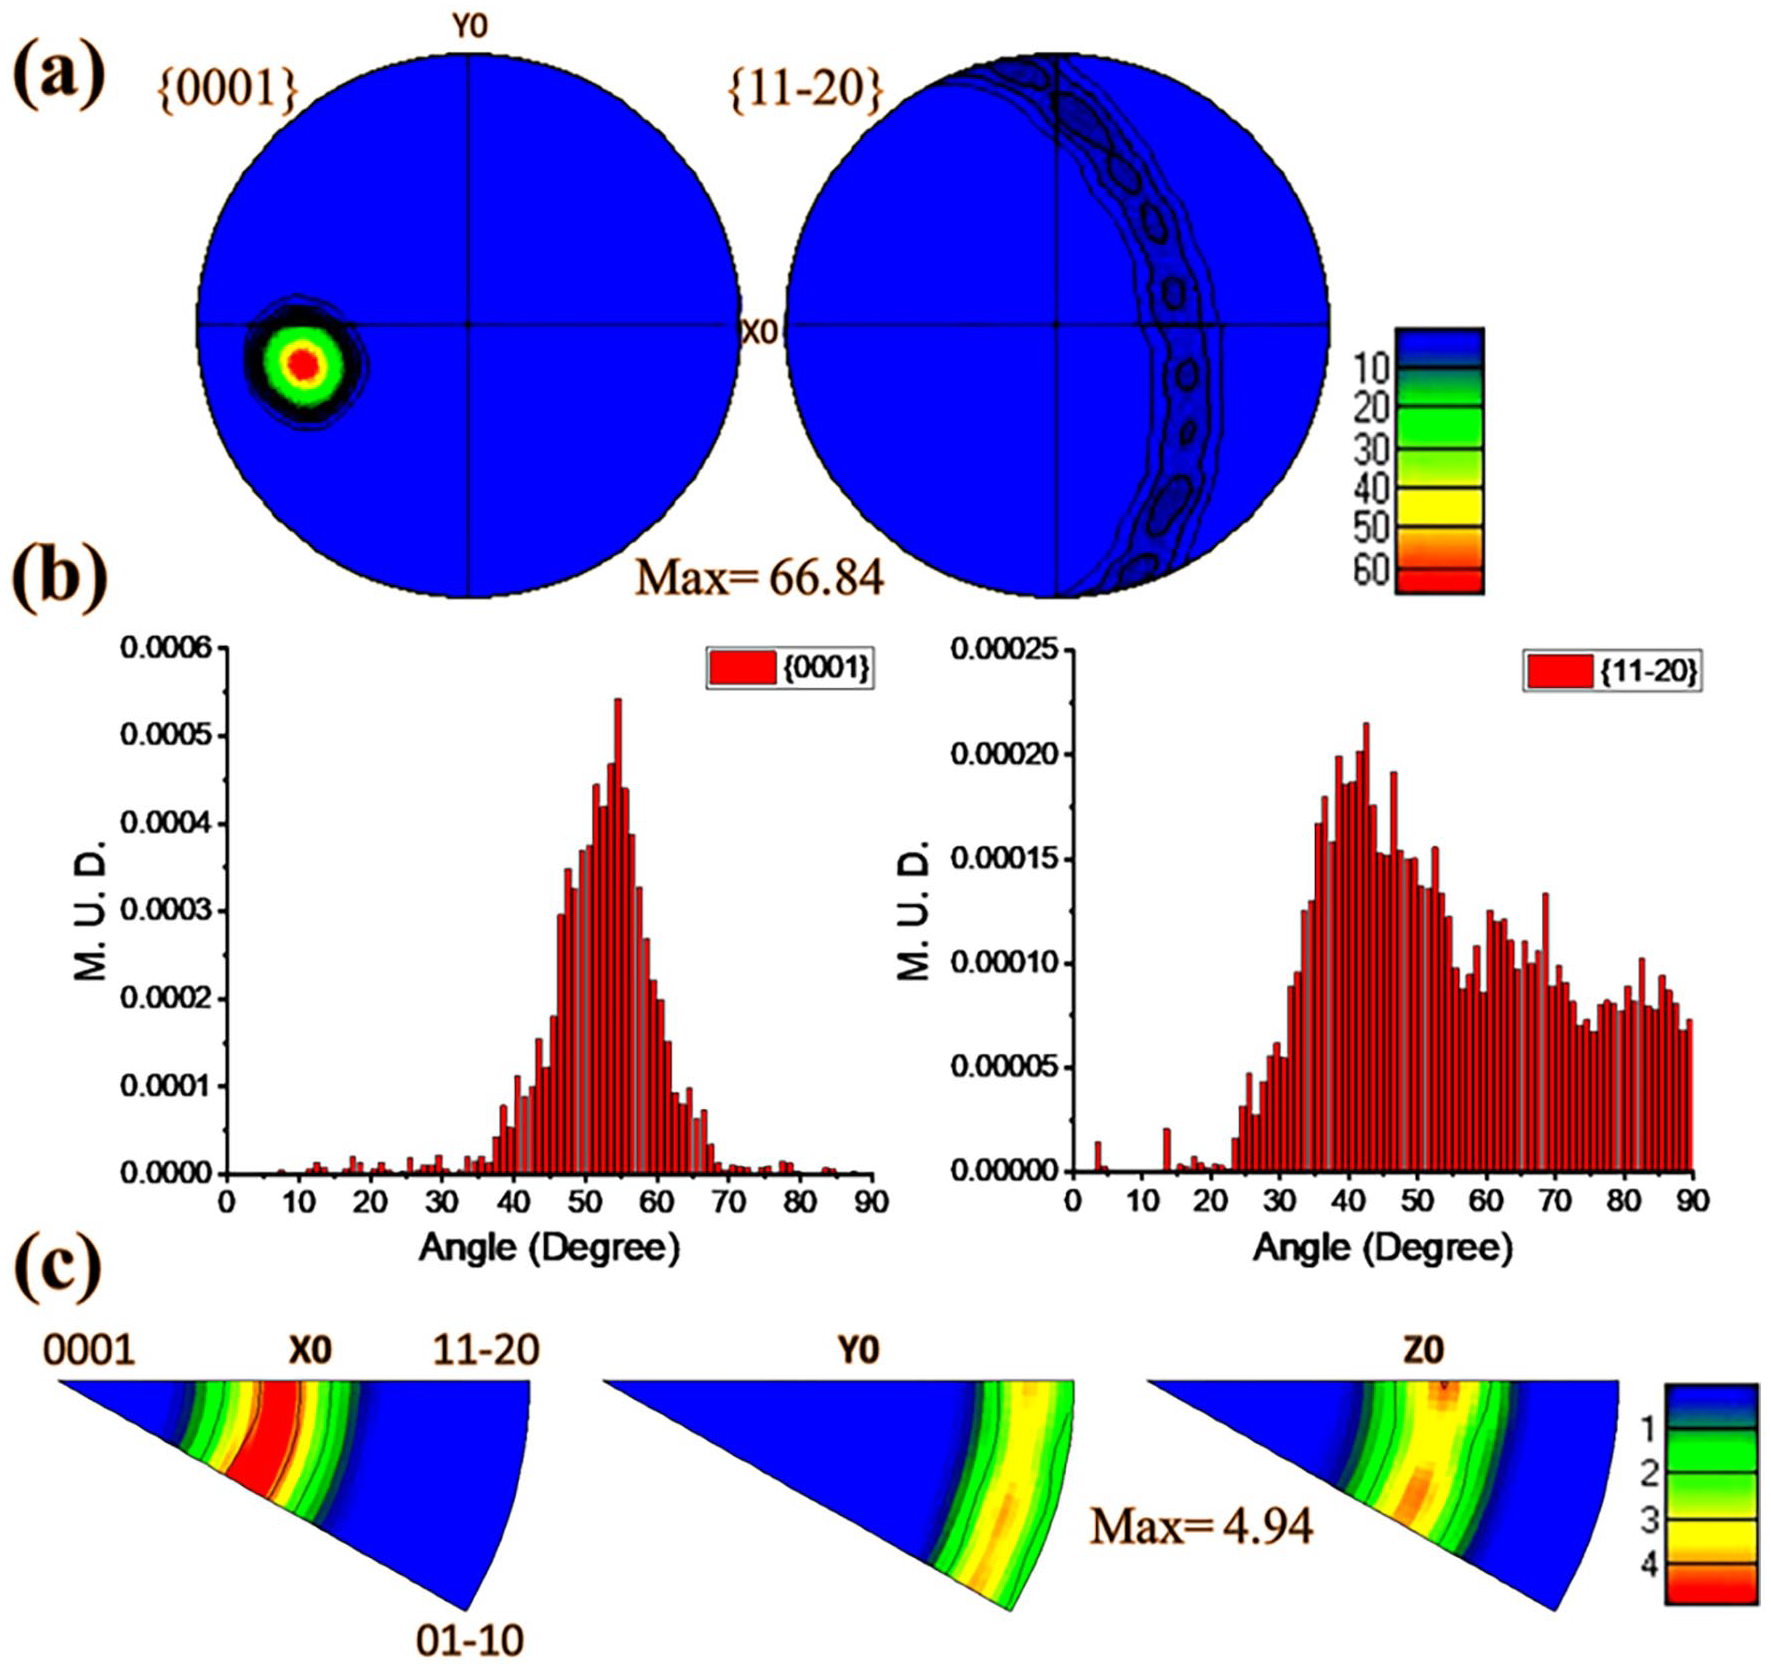
(a) Pole figures of FSP surface composite C at {0001} plane and <11-20> slip direction after 3-passes (b) multi uniform distribution of the plane at different misorientation angle (c) inverse pole figures.
The inverse pole figures in Figures 10(c), 11(c) and 12(c) for composite A (4.81MUD), composite B (4.29MUD) and composite C (4.94MUD) show a strong (0001) texture in the FSP zone. The inverse pole figure (IPF) map and the (0001), (11-20) and (10-10) pole figures were observed from EBSD analysis. The vertical direction is perpendicular to the PD, and the reference direction is PD in IPF map. The fine line in the IPF represents the boundaries with misorientation angles between 1° and 10°. The grains can be divided into dominated fully dynamic recrystallized grains and a small number of non–fully dynamic recrystallized grains. The FSP composites have a strong texture component (0001) perpendicular to the processing direction. The texture of AZ91D alloy extruded at 700 K, a most commonly observed <10-10> texture with the basal plane, <10-10> and <11-20> direction of crystallites parallel to processing direction. Furthermore, Figures 10, 11 and 12 shows the pole figures of the extruded AZ91D alloy with different cross sections, which may happened by the distribution of the incorporated reinforcements. Similarly, the grain texture will be different when the cross section of the sample changes. 42 Hence, the texture variation is strongly connected to the processing parameters such as microstructure and composition of the FSP surface matrix.
Microhardness
Figure 13 shows the microhardness of the substrate material (AZ91D alloy) and dual-reinforced AZ91D alloy FSP composites. The microhardness of the AZ91D alloy was 63 Hv and that of the dual-reinforced FSP composite was 94, 116.6 and 125 Hv for composite A (Figure 13(a)) and 101, 123 and 146.2Hv for composite B (Figure 13(b)) and 129.4, 122 and 161.8 Hv for composite C (Figure 13(c)) after 1, 2 and 3-passes respectively. The enhancement in the microhardness after three passes can be attributed to several factors. The first is the refined grain structure, which can be observed from the comparison of the average grain size, as shown in Figure 4(g)–(i). The second factor is the agglomeration and homogenous distribution of the reinforced nanoparticles in the AZ91D matrix, which causes the formation of banded structure aggregates, resulting in increased particle density and hence caused unstable microhardness values; therefore more uniform microhardness distribution reflects a more homogenous distribution of the nanoparticles. 43 While, third is the incorporation of nanoparticles, which contributes to the difficulty of dislocation movement. Hence, dislocation accumulation is helpful to the plastic deformation which occurs during FSP, thereby strengthening the Mg matrix. 44 Interestingly, a small increase in the microhardness with a lower standard deviation can be observed after 3-passesof the FSP composite because of the lower wettability of the reinforcements, which caused the rejection of the particles in the shapes of agglomeration along the grain boundaries. 45
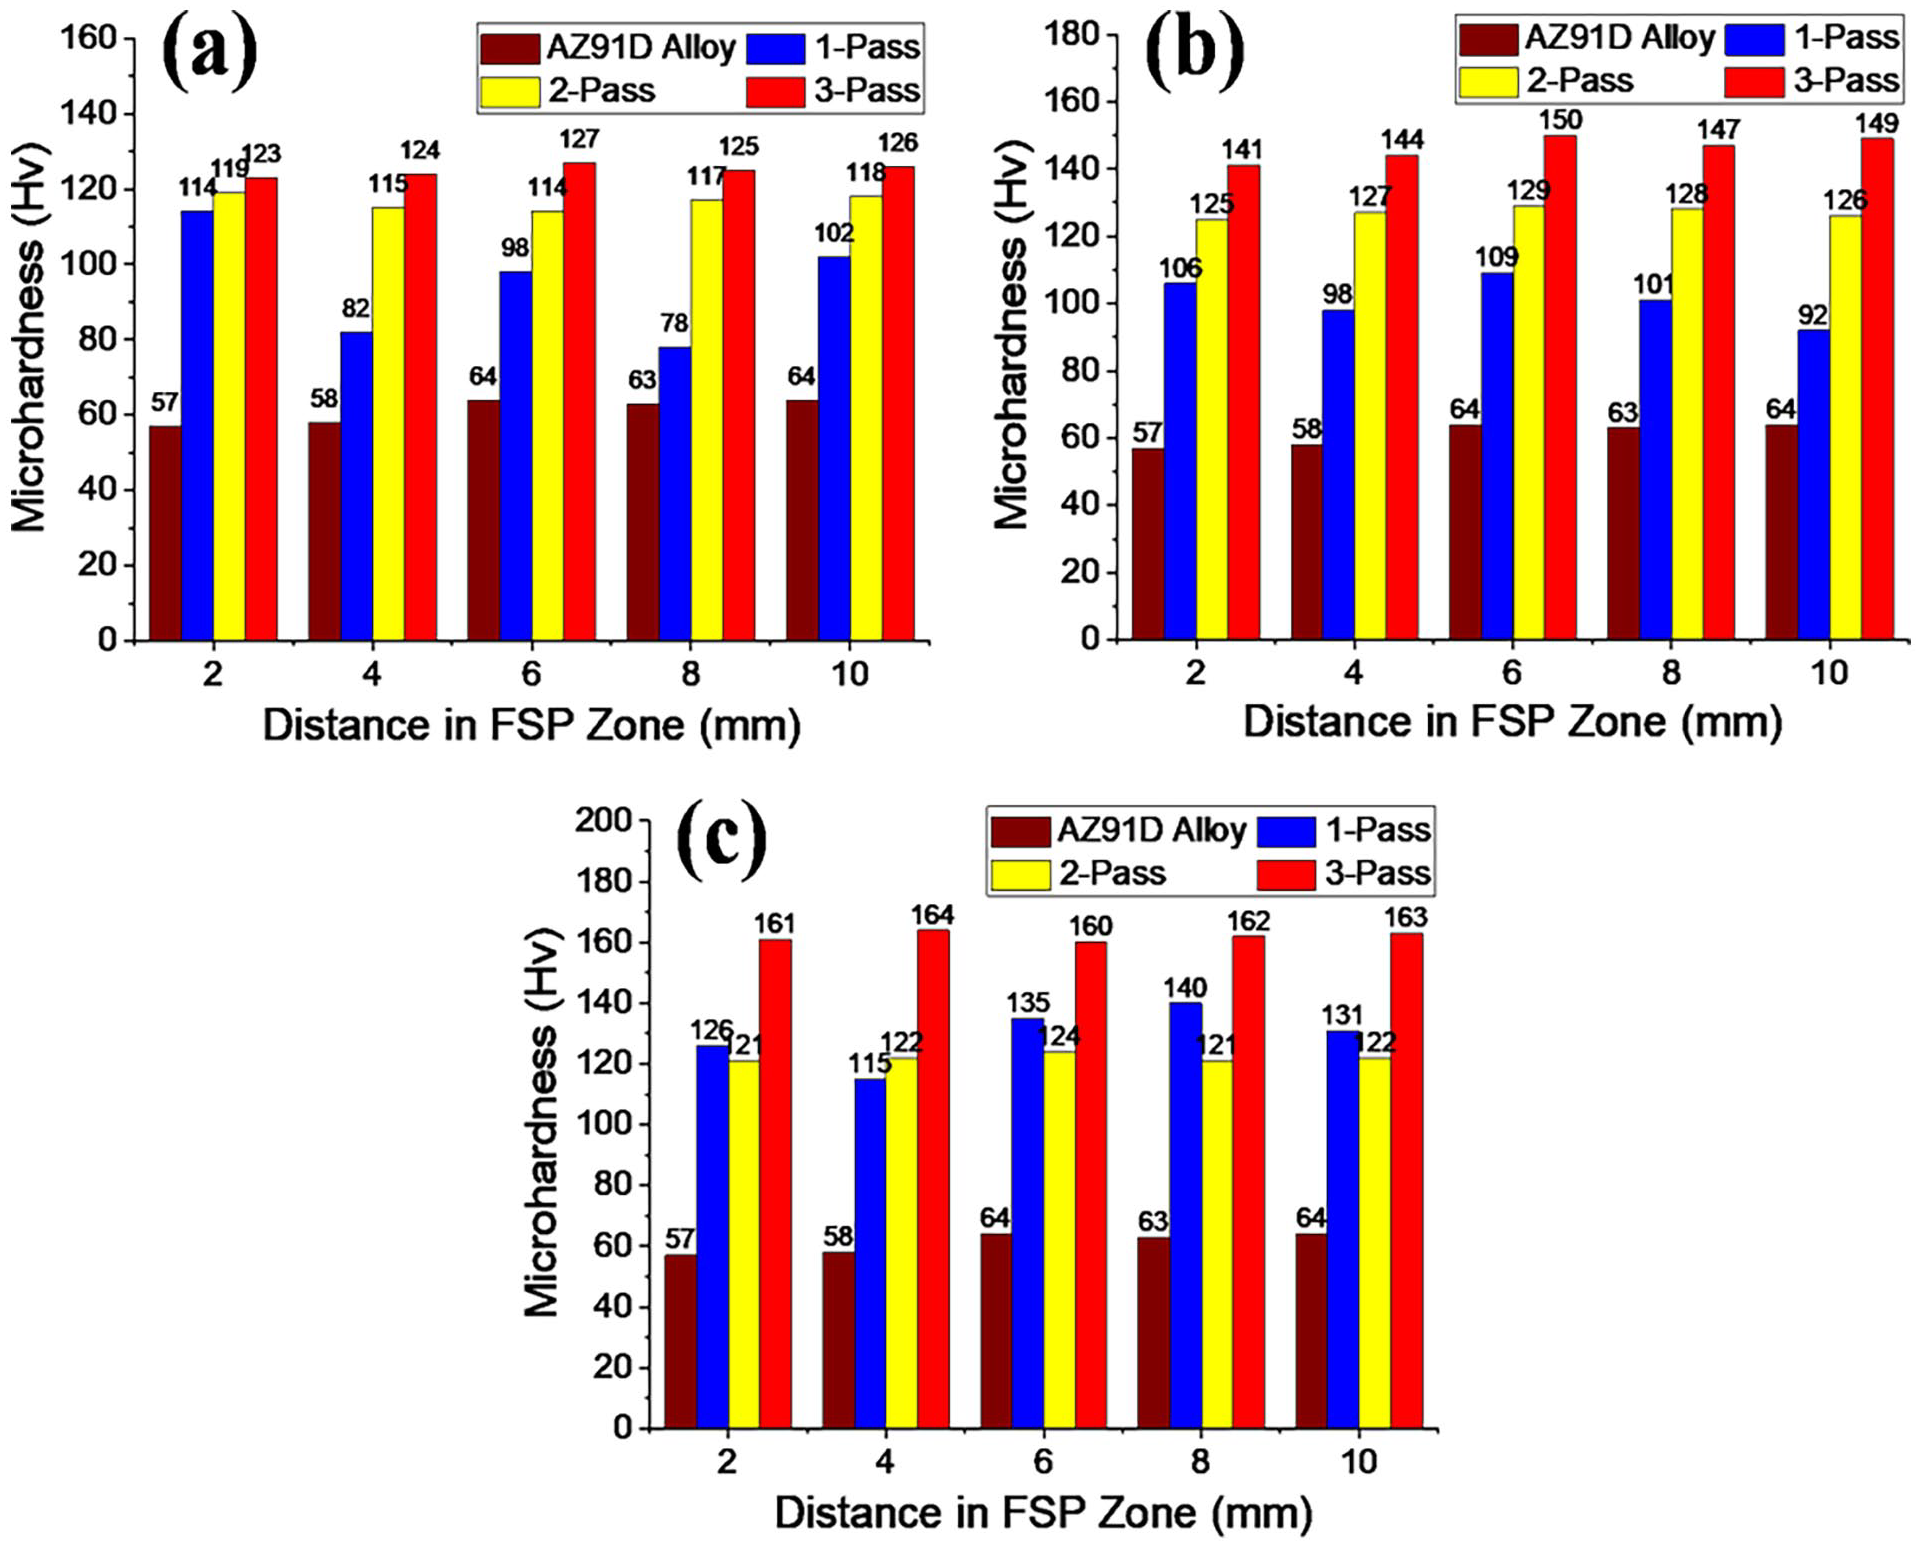
Microhardness value of the AZ91D alloy and FSP surface composite (a) composite A (b) composite B and (c) composite C.
Tensile strength
The AZ91D magnesium alloy with a hexagonal close-packed (HCP) structure mostly shows strong anisotropic mechanical behaviors after severe plastic deformation. 46 To examine the anisotropy of the FSP composite A (Figure 14(a) and (b)), composite B (Figure 14(c) and (d)) and composite C (Figure 14(e) and (f)) tensile properties are observed along the processing direction. These observations revealed that the tensile strength of the FSP composites was significantly increased with increase number of FSP passes. The strengths were 31, 36.8 and 61.2 MPa for the yield strength, 80.6, 91.3 and 152.7 MPa for the ultimate tensile strength, 4.7%, 5.6% and 9.1% elongation for composite A, 28.8, 33.2 and 53.2 MPa for the yield strength, 72, 83 and 133 MPa for the ultimate tensile strength, 3.9%, 5.5% and 8.6% elongation for composite B and 31.2, 42.4 and 44.6 MPa for yield strength, 78.5, 106.5 and 111.3 MPa for ultimate tensile strength, 4.1%, 5.4% and 5.8% elongation for composite C. The yield strength, UTS and elongation of the dual-reinforced composites were reduced to those of the AZ91D substrate material. The ultimate tensile strength of composite C was decreased due to better flow of ZrO2 particle toward grain boundary and improper distribution into the FSP matrix. The XRD image (Figure 5) also indicated that the (0001) and (0002) peaks of composite C are less pronounced than the composite A. In addition, the strengthening mechanisms for AZ91D alloy metal matrix composites are mainly direct and indirect strengthening. Science the strength of HA particles was low, so it could not directly bear the transferred load form the magnesium matrix to the HA through the interface.

Tensile strength of the AZ91D alloy and FSP surface composite (a) composite A (b) corresponding UTS, YS and elongation value (a), (c) composite B (d) corresponding UTS, YS and elongation value (c), (e) composite C (f) corresponding UTS, YS and elongation value (e).
Figure 15(a)–(c) shows that the texture of the FSP composites facilitates an increase in yield stress due to a reduced Schmid factor (SF) when tensile tests are carried out along the processing direction (PD). Figure 15(d)–(f) shows the misorientation angle distribution (MAD) of the FSP composites. The two peak values of the angle distribution are ~2° and ~30°. The first peak angle is caused by the low-angle boundaries in nonfully dynamic recrystallized grains with an orientation of approximately <10-10> parallel to the PD. However, the dislocations density peaks are approximately the same for all the composites, which is also reflected by the Taylor factor, as shown in Figure 16(a)–(f). The second peak value angle results from the fully dynamic recrystallized grains almost without low-angle boundaries. The blue grains contain abundant 1°–10° low-angle boundaries, whereas almost no 1°–10° low-angle boundaries are found in grains with other orientations, suggesting that more storage exists in grains with <0001> perpendicular to the PD than in other grains. 47 The {0001} <11-20> Schmid factor distribution (average SF = 0.248) indicates that the nonfully dynamic recrystallized grains have a low SF value of basal <a> slip when composite A is tested along the PD, as shown in Figure 15(d). The average SFs for prismatic <a> are 0.41 and 0.42, as calculated from the {1-100}<11-20> and {11-20}<-1-123> SF distributions in composite B and composite C respectively, as shown in Figure15(e) and (f).

Schmid factor of FSP surface composite at {0001} plane and <11-20> slip direction after 3-passes (a) composite A (d) corresponding plane orientations, (b) composite B (e) corresponding plane orientations and (c) composite C (f) corresponding plane orientations.

Taylor factor of FSP surface composite at {0001} plane and <11-20> slip direction after 3-passes (a) composite A (d) corresponding plane orientations, (b) composite B (e) corresponding plane orientations and (c) composite C (f) corresponding plane orientations.
Therefore, the friction stir processed composite is characterized by a combination of ductility and strength due to grain refinement caused by severe plastic deformation. 48 The high YS of 120 MPa and 12.6% elongation of low-cost AZ91D alloy would be most favorable for its practical application as a bioimplant. The improved strength of the FSP composites is attributed mainly to the finer dynamic recrystallized grains, greater number of submicron dynamic Mg-Al precipitates and strong texture component (0001) perpendicular to the PD. 49 The excellent ductility is attributed mainly to the fine-grained structure with a high SF for prismatic <a> slip, which can facilitate the non-basal slip of dislocations. 50 In addition the fully dynamic recrystallized grains have a high SF for basal <a> slip, which increases the degree of dislocation slip during gradual tensile loading.
The tensile fracture behaviour of composite A, composite B and composite C after 3-passes are shown in Figures 17(a)–(c), 18(a)–(c) and 19(a)–(c). The fracture behaviour varies causing a reduction in elongation, which explains the variations in the fracture mode due to the presence of reinforcement particles and the formation of precipitates in the FSP matrix. 51 Large voids are formed in the FSP samples by the agglomerated reinforcing particles, which is also the reason for crack propagation. Furthermore, the 3-pass FSP samples have a better homogenous reinforcement particle distribution; as a result, numerous tiny voids are formed, which protects the propagation of small cracks during tensile testing. 52 Additionally, the elemental map shows the variation in the element percentage in the reinforced FSP composite matrix material as shown in the Figures 17(b), 18(b) and 19(b). From the EDS image of composite A, the more homogeneous flow of HA and Y2O3 nanoparticles is attributed to ductility in the FSP matrix, which affects the Mg grains (Figure 17(c)) than composite B (Figure 18(c)) and composite C (Figure 19(c)). This phenomenon may increase the ductility of the FSP composite matrix.
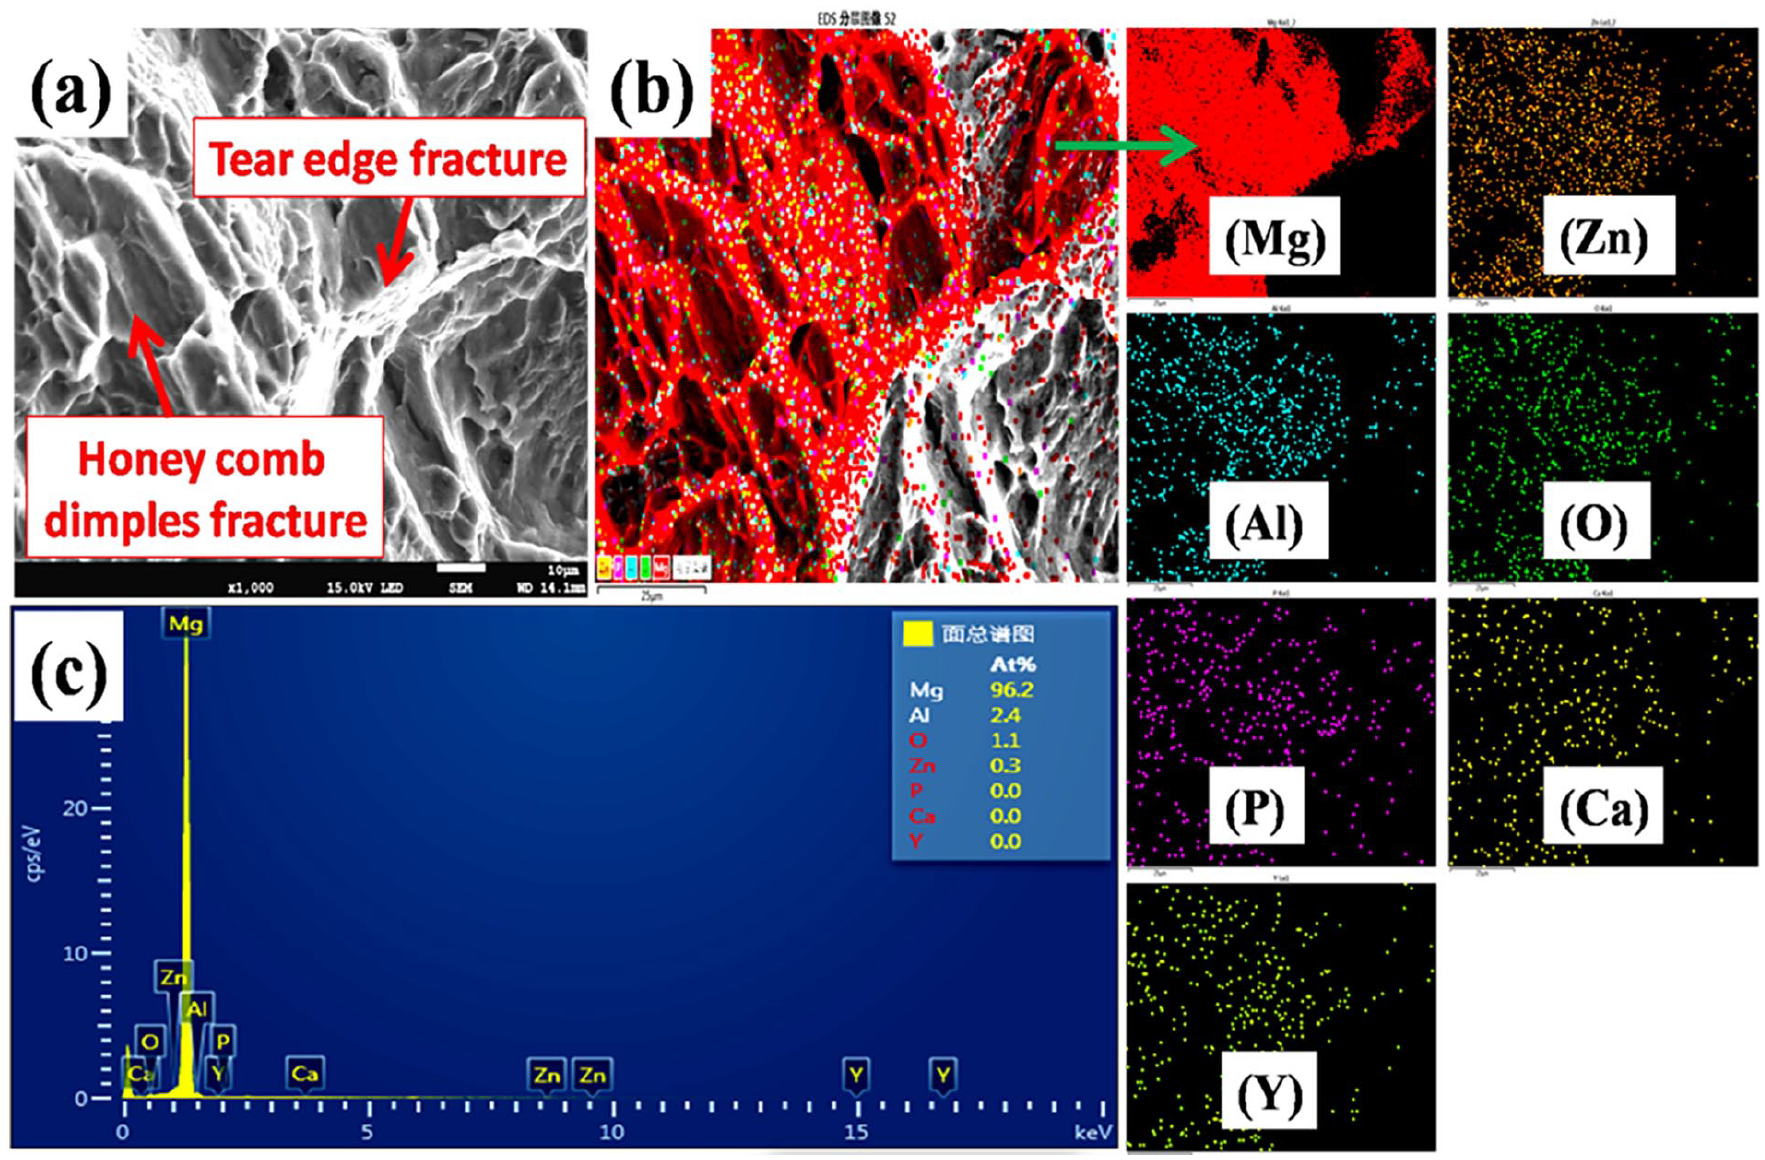
Tensile fractured analysis of composite A after 3-pass (a) SEM image (b and c) corresponding elemental mapping and EDS image.
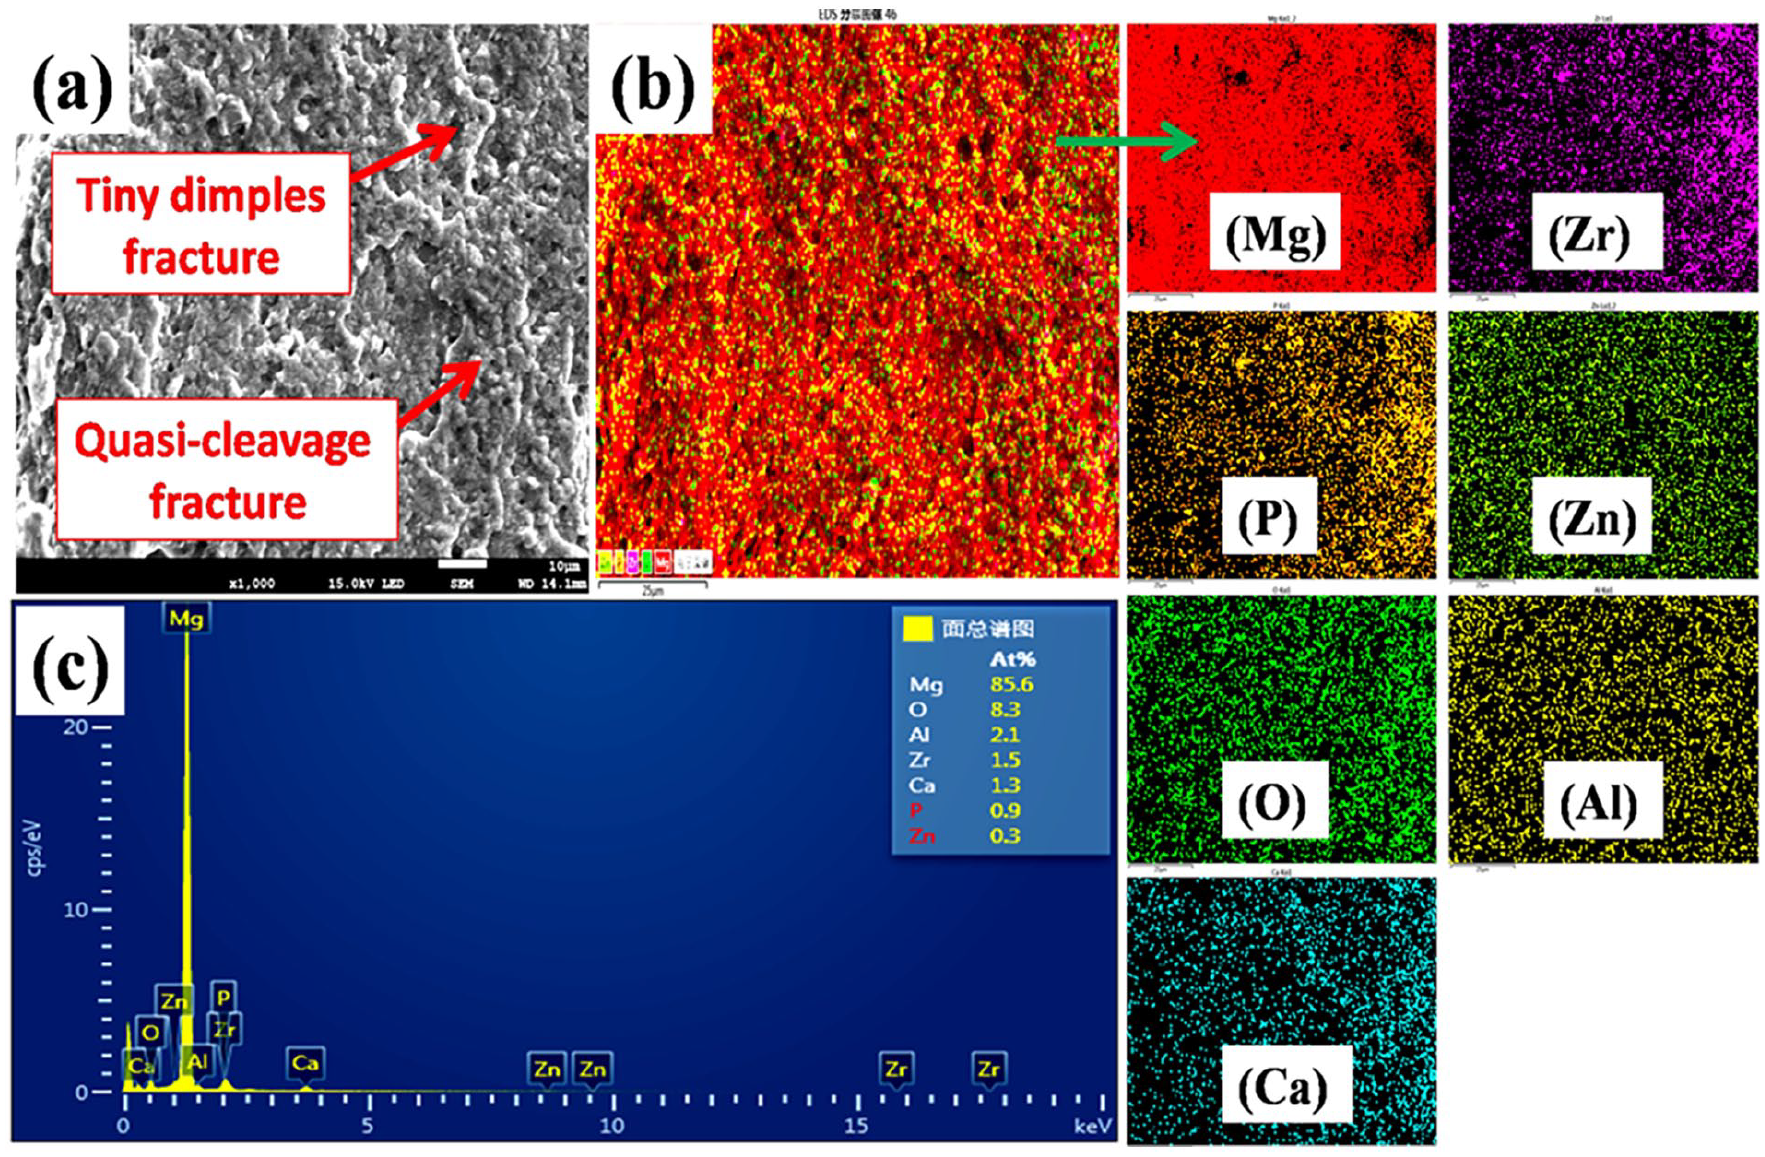
Tensile fractured analysis of composite B after 3-pass (a) SEM image (b and c) corresponding elemental mapping and EDS image.
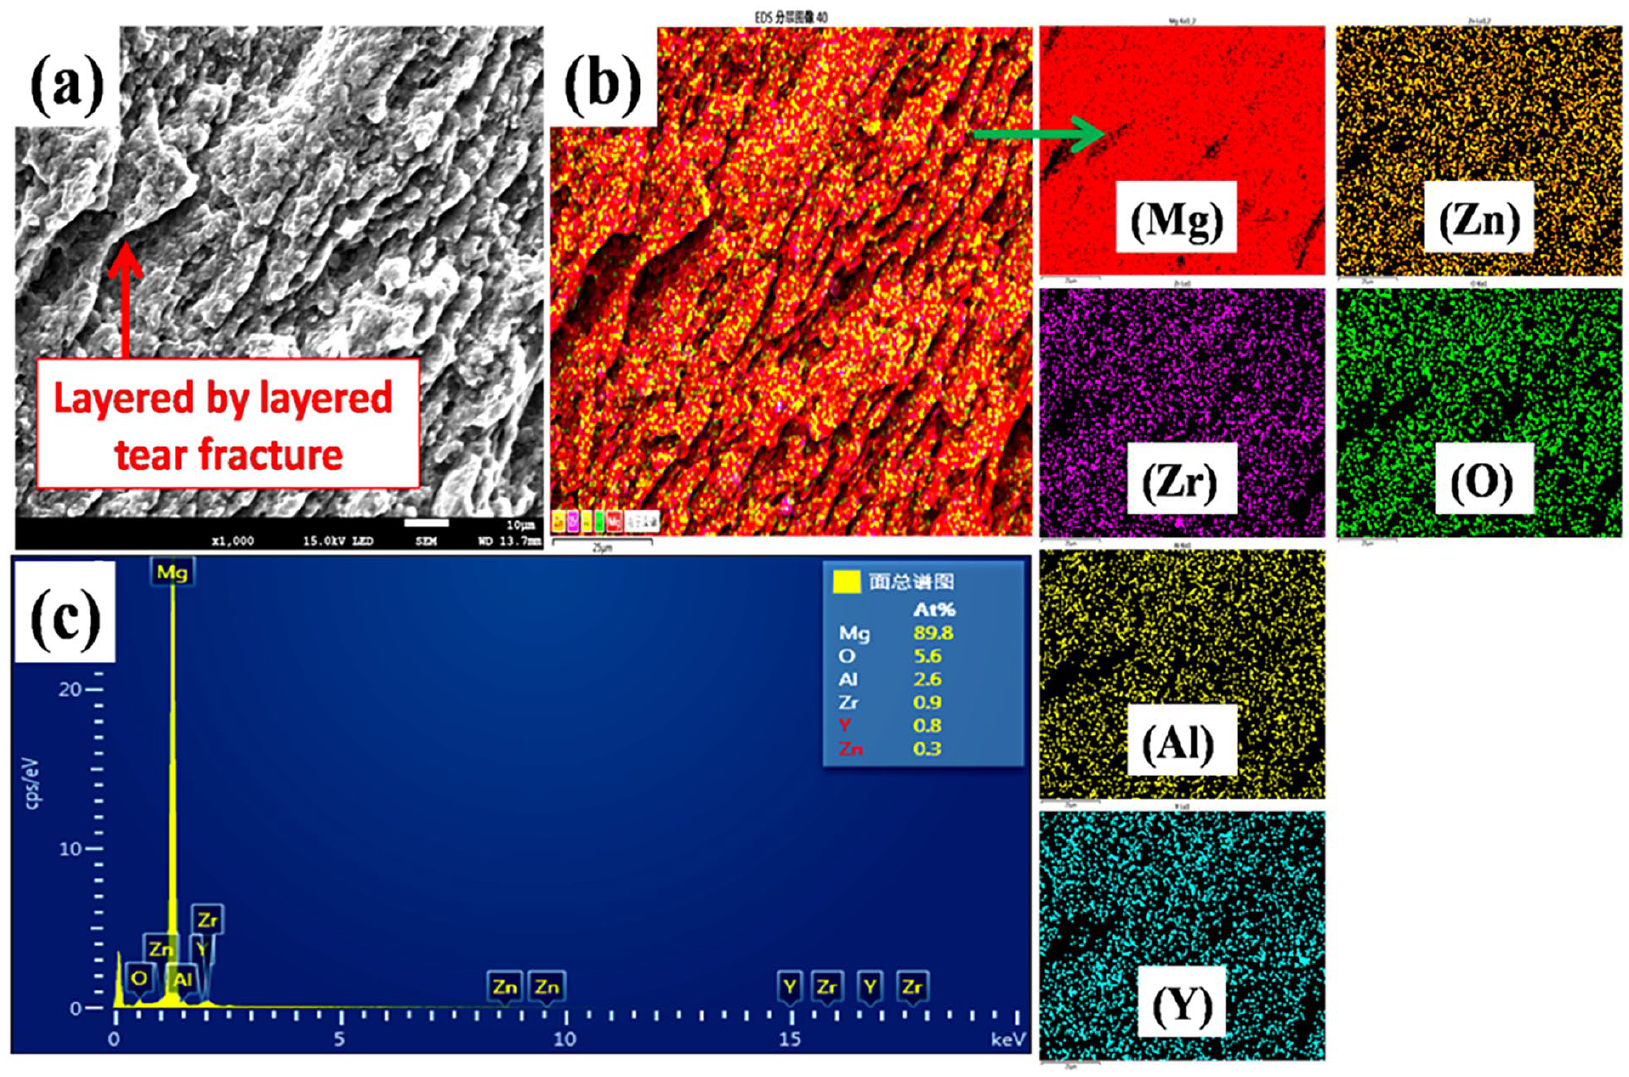
Tensile fractured analysis of composite C after 3-pass (a) SEM image (b and c) corresponding elemental mapping and EDS image.
Corrosion test
The average weight loss of the AZ91D alloy and composite A, composite B and composite C was tested at immersion times of 7, 15 and 30 days in the SBF solution and the corresponding corrosion rates were observed, as shown in Figure 20(a)–(c). The results shown in the graph indicate that the average corrosion rates of all the FSP samples are lower than those of the AZ91D alloy after different immersion periods. Compared with those of composite A and composite B, the lower corrosion rate of composite C was observed at 30 days of immersion after 3-passes, compared followed by 1-pass and 2-passes.

Corrosion test result of the AZ91D alloy and FSP surface composite after 1, 2 and 3-passes at 7, 15 and 30 days immersion (a) composite A (b) composite B and (c) composite C.
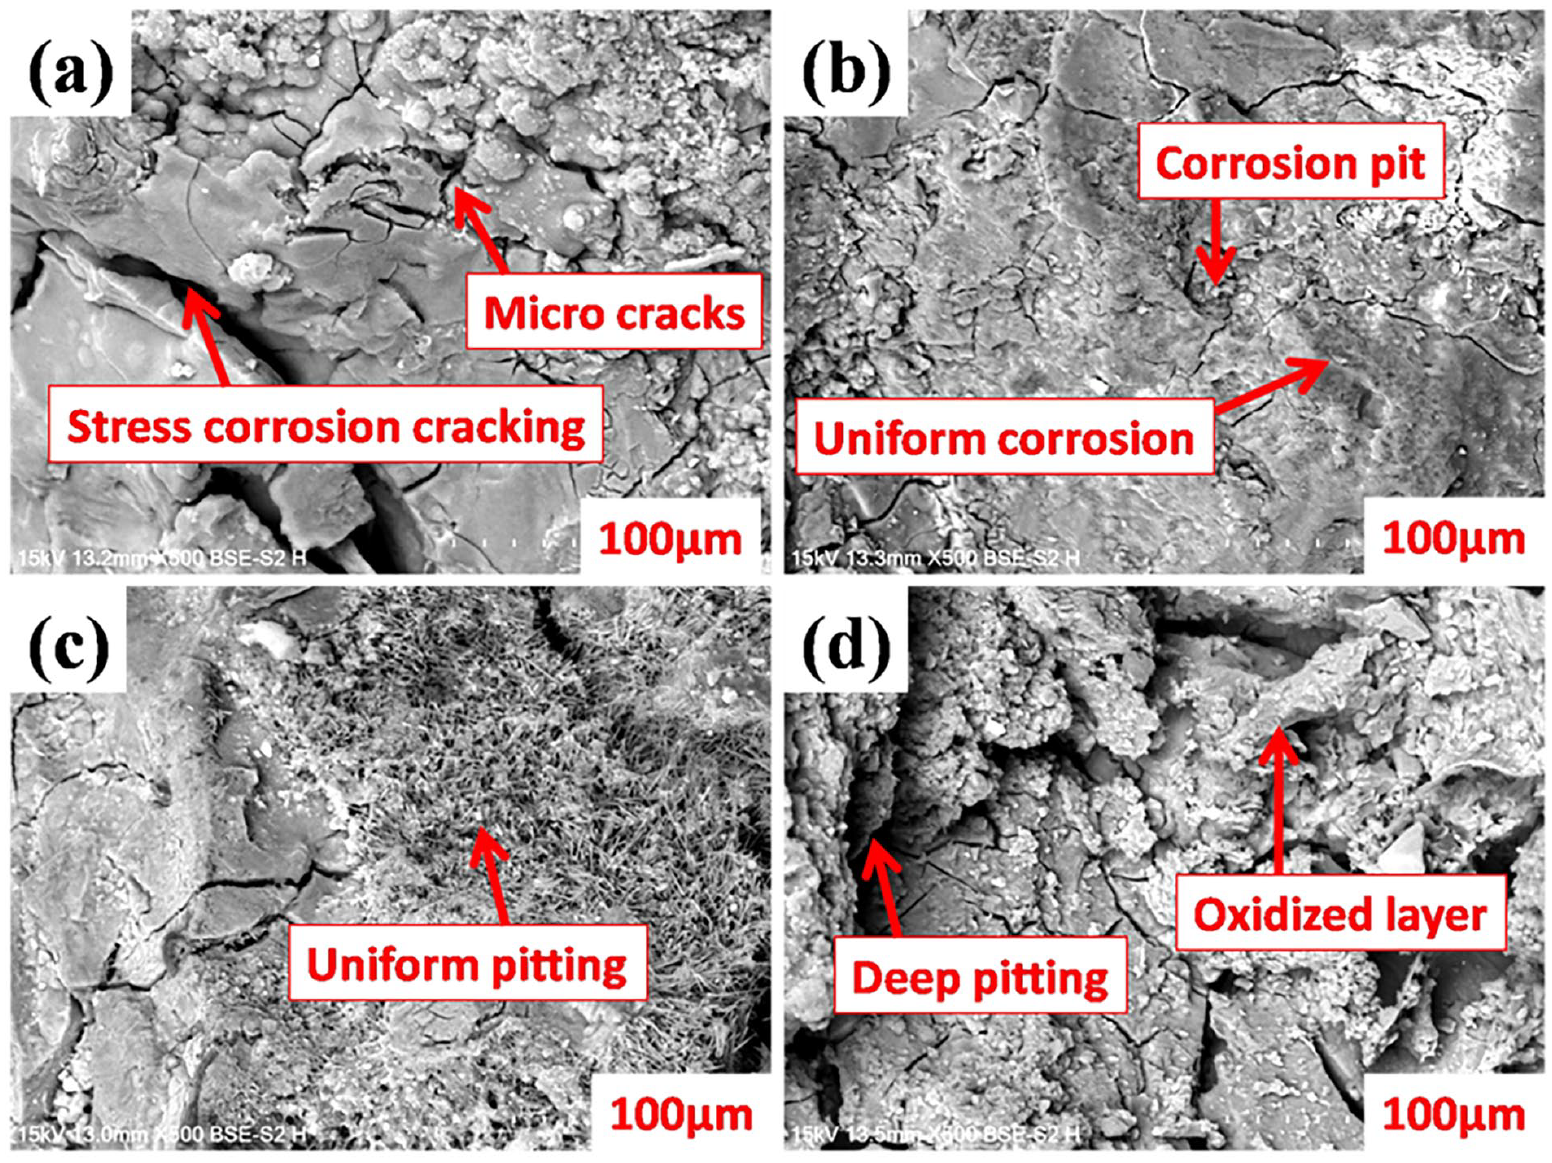
The surface morphologies of the AZ91D alloy and FSP composites after 7, 15 and 30 days are shown in Figures 21(a)–(d), 22(a)–(d) and 23(a)–(d). The surface of the AZ91D alloy corroded revealed deep pitting, deep microcracks, deep stress cracks and deep microbial corrosion as well as volcano-like shape precipitation due to the evolution of hydrogen gas in the presence of a cathodic region underneath the precipitate with increasing immersion days, as shown in Figures 21(a), 22(a) and 23(a). However, when the reinforcing particles were added to the matrix, the corrosion rate was increased with increasing immersion days time, but as the immersion duration increased, the corrosion rate decreased because of the protection of the reinforcement particles and deposition layers on the surface by the SBF solution. Furthermore, pitting and Filiform, uniform, exfoliation and large crack corrosion were observed for composite A (Figure 21(b), 22(b) and 23(b)), microbial and layered corrosion were observed for composite B (Figure 21(c), 22(c) and 23(c)) and oxidized and severe localized corrosion was observed on the corroded surface of composite C (Figure 21(d), 22(d) and 23(d)) with increasing immersion days. It is observed that collage or filiform corrosion takes place due to shattering in the corrosion product film by H2 emission, causing infiltration of the solution underneath this broken layer as shown in equations 3 and 4. These corrosion reactions occur during immersion in an SBF solution. 53
Worn analysis after 7 days immersion (a) AZ91D alloy and FSP composite after 3-passes (b) composite A (c) composite B (d) composite C.

Worn analysis after 15 days immersion (a) AZ91D alloy and FSP composite after 3-passes (b) composite A (c) composite B (d) composite C.

Worn analysis after 30 days immersion (a) AZ91D alloy and FSP composite after 3-passes (b) composite A (c) composite B (d) composite C.


Nonetheless, the pilling-Bedworth ratio of the Mg(OH)2 layer is less than unity and consequently, it would be unable to supply functional behaviour for successive corrosion resistance. Furthermore, in a chlorinated environment such as SBF, the Mg(OH)2 layer is attacked by chloride ions and hence, becomes less protective.54,55 This is attributed to the conversion of Mg to Mg(OH)2 on the surface of the FSP composite surface. Mg(OH)2 is a defect site that support the formation of MgCl2 when Cl− ions are present in the SBF solution. 56 The formation of Mg(OH)2 and MgCl2 is described in equations (5) and (6) respectively. 53


Figure 23(a)–(d) shows the corroded surface morphology of the FSP composite after 30 days of immersion. The formation of corrosion products adhered to the surface of the composites. 57 Subsurface cracks and nonintact corrosion products formed because of the impregnation and contact of the OH−, Mg2+, Zr+, Y−, Ca2+, (PO4)3−, O2− and H+ ions present in the SBF solution. 58 The formation of corroded compounds is as follows: Mg-Y2O3, Mg3(PO4), Ca3(PO4)2, CaH(PO4)2, MgH(PO4) and Ca10(PO4)6(OH)2 for composite A, Mg-Y2O3, Mg-ZrO2 and MgO-ZrO2 for composite B; and Mg3(PO4), CaH(PO4)2 and Mg-Y2O3 for composite C. In addition, Mg-Zn-O compound formation occurs for composite A, composite B and composite C. However, the greater solubility of the Mg-Y2O3, Mg3(PO4), Ca3(PO4)2, CaH(PO4)2 and MgH(PO4) compounds favors the deposition of less soluble Mg-ZrO2, MgO-ZrO2 and Ca10(PO4)6(OH)2, therefore the corrosion resistance of composite C is higher than the composite A and composite B. In addition, the inhibition of Cl- ion penetration may lead to be the formation of MgCl2, KCl and NaCl. 59 This cumulatively enhances the corrosion resistance of the FSP surface composite, as the adherent layer of corrosion products prevents the formation of new compounds for corrosion. 60 The additional merits, the corrosion products support bone growth and implant-bone integration.
In summary, the dual reinforced AZ91D surface composites produced via FSP can additionally improve applications in orthopedics and address the limitations of alloying and surface castings concerning bio-safety and product compatibility for biocompatible and biodegradable human implants. Future studies on multi-bioactive reinforced AZ91D surface composites could improve the compatibility mechanisms of cells and tissues in human body implants. Due to the need to account for the overall effects of processing technique, reinforcement types, and their distribution, particularly agglomeration, on degradation behavior for biological environments.
Conclusions
The dual-reinforced AZ91D-based bio-ceramic surface composites were successfully fabricated via multiple FSP passes. The following conclusions are drawn:
• The higher grain refinement was observed after 3-passes for FSP composite, because of better distribution of the reinforcement nanoparticles and improved finer grain structure after 3-passes in the AZ91D alloy matrix.
• The activated (10-12) plane and twinning-induced higher dynamic recrystallization mechanism after 3-passes, due to number of dislocations and strain was increased in the FSP surface matrix.
• The microhardness of the FSP surface composites were increased due to significant change in the degree of grain refinement in the matrix. The improved microhardness after was 125.2, 146.2 and 162 Hv for composite A, composite B and composite C after 3-passes.
• The tensile strength of composite A increased to 9.1% elongation, 61.2 MPa yield strength and 152.7 MPa UTS, whereas composite B increased 8.6% elongation, 53.2 MPa yield strength and 133 MPa in UTS and composite C increased 5.8% elongation, 44.6 MPa yield strength and 111.3 MPa UTS after 3 FSP passes compared to AZ91D alloy.
• The corrosion resistance of composite C was enhanced 9.1, 11.2 and 11.5 times greater at 7, 15 and 30 days after 3 passes. However, composite A was enhanced 7.6, 7, and 8 times, and composite B was enhanced 10, 9.5 and 9.7 times, compared to AZ91D substrate alloy.
Footnotes
Author contributions
Surendra Kumar Patel: Roles/Writing – original draft, Conceptualization; Data curation; Formal analysis; Investigation; Methodology; Visualization. Guoxin Dai: Writing – review & editing, Data curation; Validation; Visualization, Investigation, Conceptualization. Lu Liu: Writing – review & editing, Data curation; Validation; Visualization, Conceptualization. Zhen Sun: Writing – review & editing, Conceptualization. Lei Shi: Writing – review & editing, Supervision, Data curation; Formal analysis; Investigation; Methodology; Visualization Conceptualization, Funding acquisition.
Declaration of conflicting interests
The author(s) declared no potential conflicts of interest with respect to the research, authorship, and/or publication of this article.
Funding
The author(s) disclosed receipt of the following financial support for the research, authorship, and/or publication of this article: The authors would like to acknowledge the financial support from the National Natural Science Foundation of China (Grant Nos. 52275349 and 52035005), the Shandong Provincial Science Foundation for Outstanding Young Scholars (Grant No. ZR2024YQ020) and Key Research and Development Program of Shandong Province (Grant No. 2021ZLGX01). The research was also sponsored by the China/Shandong University International Postdoctoral Exchange Program.