
Abstract
Adhesions are fibrous tissue connections which are a common complication of surgical procedures and may be prevented by protecting tissue surfaces and reducing inflammation. The combination of biodegradable polymers and nanocrystalline silver can be used to create an anti-inflammatory gel to be applied during surgery. In this study, sodium hyaluronate and sodium carboxymethyl cellulose were added in concentrations from 0.25% to 1% w/v to aqueous nanocrystalline silver solutions to create viscous gels. Gels were loaded into dialysis cassettes and placed in PBS for 3 days. pH was adjusted using potassium phosphate monobasic and sodium hydroxide. Release of silver into the PBS was measured at several time points. Polymer degradation was compared by measuring the viscosity of the gels before and after the experiment. Gels lost up to 84% of initial viscosity over 3 days and released between 24% and 41% of the added silver. Gels with higher initial viscosity did not have a greater degree of degradation, as measured by percent viscosity reduction, but still resulted in a higher final viscosity. Silver release was not significantly impacted by pH or composition, but still varied between experimental groups.
Introduction
Adhesions are fibrous bands of tissue which form between previously unconnected tissue surfaces and most commonly develop due to surgery, particularly in the abdominal area. 1 Adhesions lead to the development of scar tissues and conjoining of bodily surfaces potentially leading to complications such as infertility and bowel obstructions. 1 It has been reported that up to 90% of abdominal or pelvic surgeries have resulted in adhesions.1,2 Adhesion formation is initiated by trauma to the peritoneum, the inner lining of the abdominal cavity. 3 This induces an inflammatory response that includes cytokine production and the recruitment of immune cells to the site of injury.4,5 These events, combined with damage to surrounding blood vessels, activates the coagulation cascade which results in fibrin deposition.4,5 During the normal healing process, there is a balance between fibrin deposition and degradation, but during adhesion formation, this balance is disrupted.4,6 This causes an excess of fibrin production which sticks to tissue surfaces.4,6 Fibrin deposits are then strengthened with permanent extracellular matrix proteins and specialized adhesion fibroblasts. 5
An array of experimental and commercial products have been studied for their potential to reduce surgical adhesions. The most well known is Seprafilm®, a polymer sheet that acts as a physical barrier and healing aid to the damaged tissues and is composed of modified sodium hyaluronate (HA) and carboxymethylcellulose (CMC). 7 While some effectiveness has been demonstrated, Seprafilm® cannot completely prevent and lacks flexibility, as it cannot be utilized during laparoscopic surgery and is challenging to apply even during open surgery.8,9 Liquid solutions can be easily applied but are absorbed quickly. Experimental polymer gels are being developed to increase the versatility of application and tune the absorption and release of healing compounds, but are not yet available clinically.
HA and CMC have been used in adhesion prevention gels, both in combination and separately. They are frequently chosen due to their favourable physical characteristics such as being hydrophilic, biocompatible and biodegradable. 10 Both are anionic at physiological pH and form weak binding interactions with each other. 11 Hyaluronic acid has a number of biological functions; the specifics depend on the size of the molecules and its environment but high molecular weight HA functions as a lubricant and shock absorber, as well as having anti-inflammatory and immunosuppressive capabilities. 12 CMC is commonly used in food and biomedical applications. There are a large number of studies describing CMC’s incorporation into films, dressings or hydrogels for a variety of healing applications. 10 At most solution concentrations, HA and CMC are non-Newtonian fluids. Newtonian fluids have a constant viscosity at any speed of mixing, or shear rate. HA and CMC belong to a category of non-Newtonian fluids called shear-thinning fluids because the viscosity will decrease when the rotational speed (shear rate) is increased because of polymer chains aligning to the direction of flow.
One criticism of these materials is that HA normally degrades and is absorbed quickly without a stabilizing or crosslinking agent. 13 However, higher viscosity solutions, which corresponds to higher molecular weight or higher concentrations, have a longer retention in the abdominal cavity.14 –16 In this experiment, we will be using a range of concentrations for HA and CMC based on literature values.11,16
When the viscoelastic properties of hyaluronan in aqueous solutions were studied over a pH range, the complex viscosity was relatively stable for pH of approximately 3 to 11. 17 Additionally, changes to viscoelastic properties that occur outside that pH range are reversible. 17 Another study indicates that degradation of HA occurs outside of pH 4 to 11, starting early after the solution is generated, as studied by molecular weight. 18 This indicates that within the pH range studied, our polymer solutions should have a relatively stable viscosity.
Nanocrystalline silver-coated dressings are clinically successful wound and burn dressings. Nanocrystalline silver is a unique material in that it has both antimicrobial and anti-inflammatory properties that are independent of each other by releasing multiple species of silver including Ag+, Ag0 and clusters of higher oxidation state silver.19,20 In a porcine model of induced dermatitis, there was a decrease in observed oedema and erythema and a decrease in the proinflammatory cytokines with nanocrystalline silver dressing treatment. 19 Not only does nanocrystalline silver have this effect in its solid dressing-coating form, it is also effective in when dissolved into solution form. 21 This research suggests nanocrystalline silver could be a novel candidate in preventing adhesions as its broad anti-inflammatory activity could mitigate the inflammation caused by surgical trauma.
In polymer-water-drug systems, it has been found for a variety of polymers and drugs that the drug release is independent of the original drug concentration, and was instead diffusion and degradation controlled.22,23 The degradation and mass loss of the polymer mostly corresponds to drug release. 24 The phases of drug release from polymers tend to start with a burst release of drug from the surface, then a slower, constant release followed by a phase of constant, but faster, release, which can also be seen as a secondary burst.24,25,26
In this study, HA and CMC will be combined with nanocrystalline silver solutions to produce viscous, gel-like solutions. Polymer concentration and pH are altered to measure the effect on viscosity, degradation and silver release in vitro.
Materials and methods
Nanocrystalline silver solution development
An in-house sputtering apparatus was used to create experimental nanocrystalline silver films by a physical vapour deposition process. A roll of HDPE mesh was positioned in the chamber underneath a pure silver target, which acts as the cathode. Oxygen and argon are allowed into the chamber at a controlled rate for a total flow rate of 400 sccm, with 4.5% oxygen. Water is injected at a constant rate of 15 µL/min using a peristaltic pump (Masterflex L/S®, Cole-Parmer) connected to the argon gas input line. To ensure even distribution of silver across the dressing, the roll of HDPE moves at a speed of 1.65 cm/min. The process is controlled by current, set at 1.8 A and the working pressure is 40 mTorr. The advantages of this process have been studied in previous work. 27 Silver particles are ejected from the target to condense on the HDPE mesh, creating silver and silver oxide layers with nano-sized grains for a film of approximately 900 nm in thickness. The working pressure of the machine is 40 mTorr, maintained by vacuum pumps.
Pieces from the central region of the prepared film are cut into 2 × 1 in 2 sections. Nanocrystalline silver solutions are prepared by placing these sections in distilled water at 37°C overnight at a ratio of one section per 7.5 mL of distilled water. Silver concentrations of aqueous solutions are measured by acidifying with nitric acid and diluting for atomic absorption spectroscopy (AAS) as described previously. 27
Preparation of viscous nanocrystalline silver solutions
Sodium hyaluronate (Sigma PN 53,747, HA) and sodium carboxymethyl cellulose (Sigma PN 419,338, CMC) were combined with the nanocrystalline silver solution in various amounts ranging from 0.5% to 2.0% w/v by stirring with a magnetic stir bar and plate at room temperature. Viscosity was measured using a Brookfield cone and plate rheometer (RVDNX CP, CPA-51) over a range of shear rates from 3.84 to 384 1/s, or 1 to 100 rpm. This is to accommodate the changes in viscosity with shear rate from shear-thinning fluids.
Preparation of HA-CMC nanocrystalline silver solutions with varying pH
The starting pH of the aqueous nanocrystalline silver solutions is approximately 9. When polymers are added, the pH drops to approximately 6.7, as measured from preliminary tests. pH was measured with a calibrated Thermo Scientific Orion Dual Star pH/ISE meter. The targets for final pH of the viscous solutions were approximately 5, 7 and 9. The pH of the viscous solutions was adjusted using potassium phosphate monobasic (final concentration 0.1 mol/L) for acidic solutions and dilute sodium hydroxide (final concentration 1E-04 mol/L) for basic solutions. For neutral pH samples, distilled water in equal volume was added to the gel to keep the silver concentration equal. For every 9 mL of water, there was 1 mL of additive or distilled water.
Measurement of silver release and degradation
After preparation, 2 mL of viscous HA-CMC nanocrystalline silver solutions were loaded with an 18-gauge needle and syringe to a dialysis cassette (Thermo Scientific, molecular weight cutoff 10,000 Da) in triplicate. The cassettes were submerged in 100 mL of 1× PBS (phosphate buffered saline) in beakers on an incubator-shaker at 37°C and 60 rpm for 3 days. At prescribed time intervals from 1 to 72 h, a 5 mL sample of the PBS was removed. The solution was then acidified with nitric acid and diluted for AAS analysis for silver concentration. The volumes removed for AAS analysis were replaced with fresh PBS. After sampling at 72 h, the viscous solution was removed from the dialysis cassette and the viscosity measured as previously described to estimate the degradation of the polymers over time.
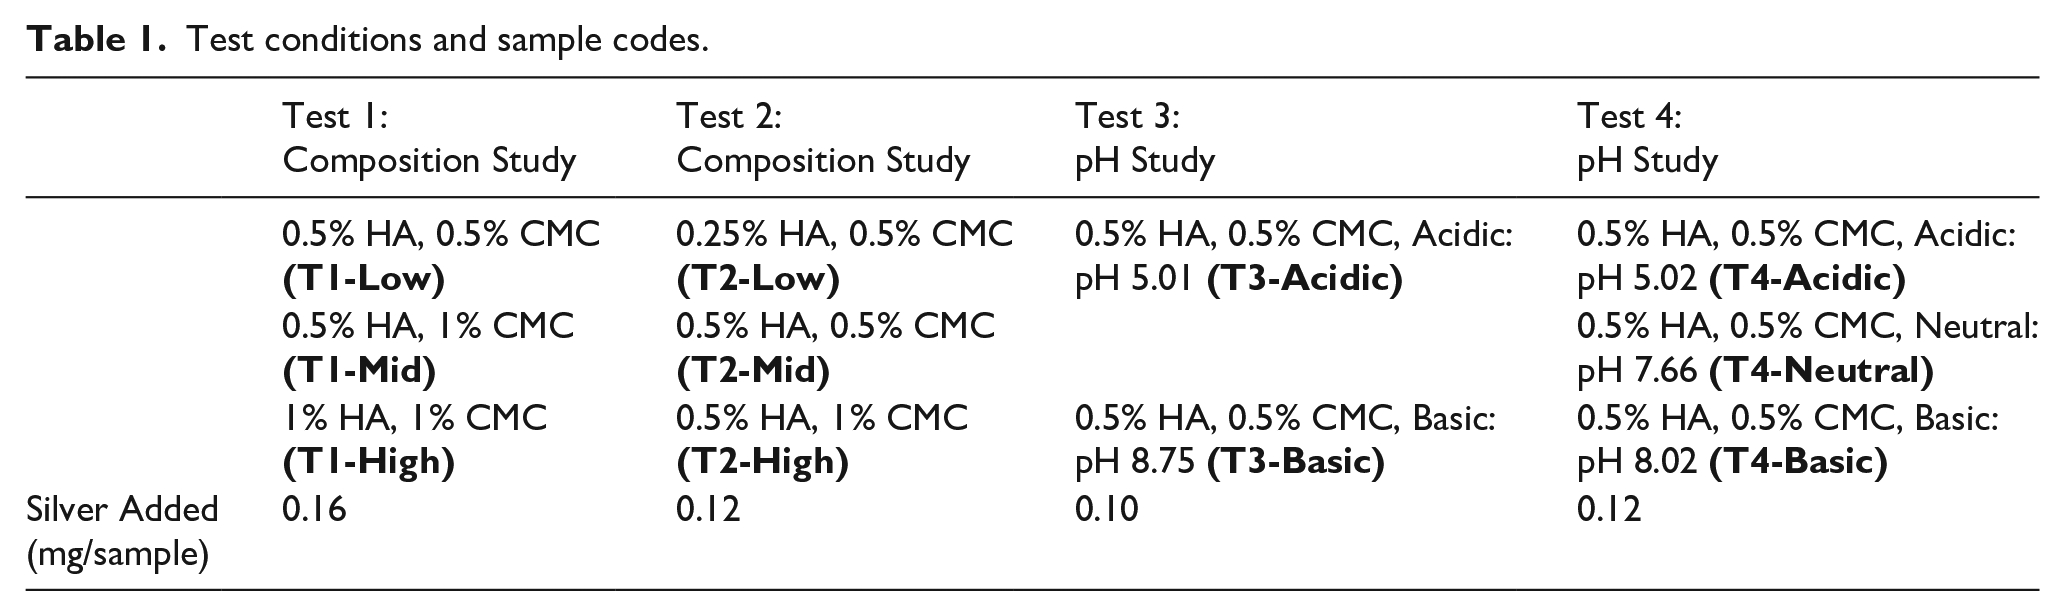
Four tests are performed and the conditions for each test and group are described in Table 1. Bolded text indicates sample group abbreviations. Tests 1 and 2 vary the concentration of polymers in solution. For Test 1, an initial selection of concentrations were chosen. The highest concentration was found to be difficult to mix and administer, so in Test 2, a lower range of concentrations was used, while replicating the concentrations that showed promise in Test 1 for reproducibility of results. Tests 3 and 4 use a fixed concentration of polymers while varying the pH. Tests 3 and 4 are replicates of each other to determine the reproducibility of results seen in Test 3. The amount of silver added to each gel varies between individual tests. This is because the silver released into aqueous solution from solid materials has some variability that cannot be measured until after the experiment has started.
Test conditions and sample codes.
Statistics
For comparisons with multiple factors, two-way ANOVA with Tukey’s post-hoc tests were used. Analysis was performed using Microsoft Excel or R. Significance is designated as p < 0.05.
Results
Composition effect on viscosity
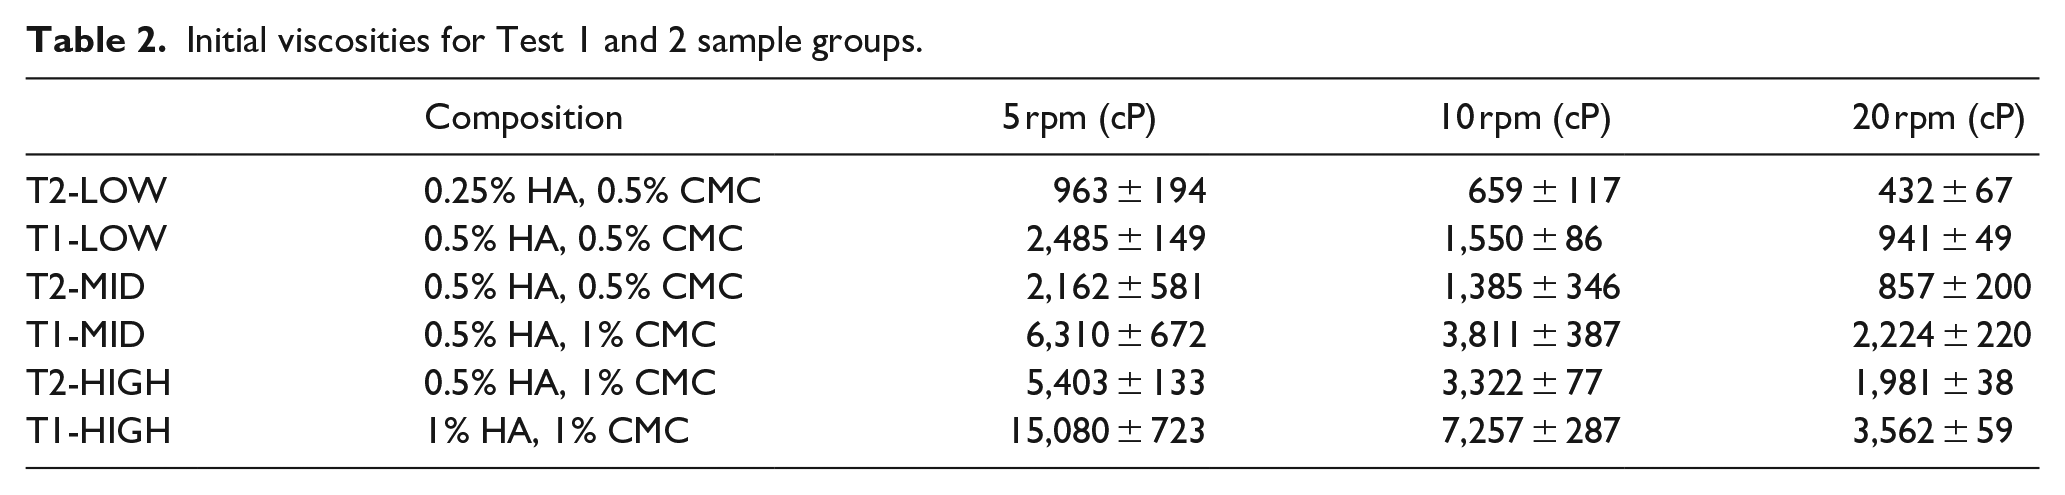
At the start and end of each test, the viscosity of each solution was measured in a range of shear rates. The measurements at the start of the experiment provide baseline measurements of the solutions while the final measurements provided insight into the longevity of the gels under degradation conditions. Figures 1 and 2 show the viscosity curves at the beginning and end of Test 1 as representative of trends in all tests. Data points shown are averages of three measurements. The initial measurements of viscosity for T1-MID and T1-HIGH were completed up to a shear rate of 76.8 1/s as further measurements exceeded the maximum torque for the apparatus. In future tests, this was corrected for. The initial and final viscosity curves for all samples demonstrate the expected shear thinning behaviour, with a significant decrease in viscosity over the 3-day incubation period. Table 2 shows the initial viscosities measured before the test for Tests 1 and 2 at the three central shear rates, which were also used for statistical analysis.
Initial viscosities for Test 1 and 2 sample groups.
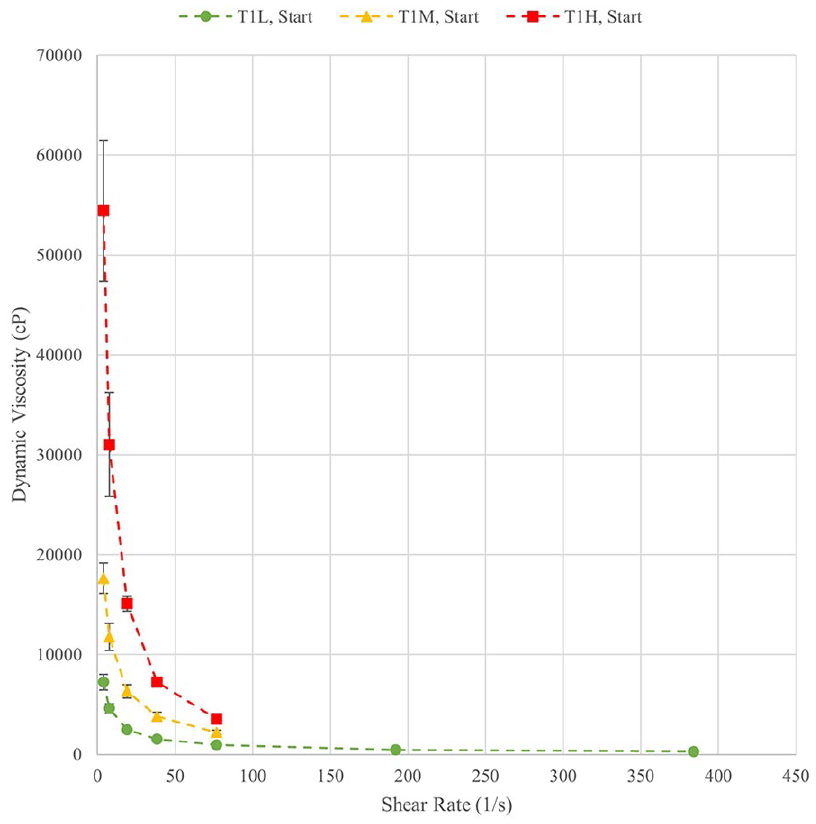
Initial viscosity curves for Test 1.
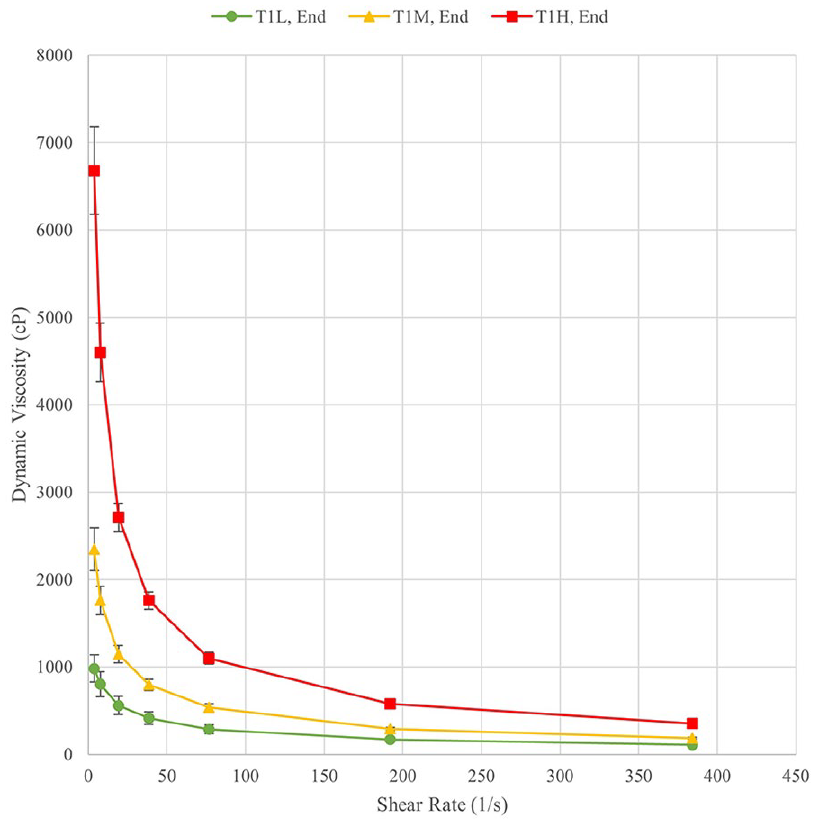
Final viscosity curves for Test 1.
The viscosity measurements from Tests 1 and 2 were each analysed with two-way ANOVA for the factors of polymer concentration (low, mid and high) and time (before/after) at three shear rates, corresponding to 5, 10 and 20 rpm. Both factors were statistically significant in changing the viscosity for both tests. The interaction between these variables was also statistically significant. At the beginning of the test, composition groups are significantly different from each other at all shear rates. After the test, comparisons between T1-MID and T1-LOW, and T1-MID and T1-HIGH at 20 rpm were not significant. For the after measurements, T2-MID and T2-HIGH are only significantly different at 20 rpm (p = 0.030) but approach significance at 5 and 10 rpm (p = 0.083, p = 0.051). There is not a significant difference for T1-LOW between before and after measurements at 20 rpm, but there is a significant difference at 5 and 10 rpm. For Test 2, comparisons of before and after within the T2-MID and T2-HIGH groups are significant at all shear rates. For T2-LOW, at 5 rpm, there is not a significant difference before and after. At 10 rpm, the difference approaches significance (p = 0.069) and the difference reaches significance at 20 rpm (p = 0.049).
Composition effect on degradation
By calculating the percent reduction in viscosity of the gels over a 3-day incubation period, the degradation of the gels in a simulated physiological environment can be estimated. The average percent change in viscosity at 10 rpm for each group in Tests 1 and 2 is calculated and displayed in Figure 3.
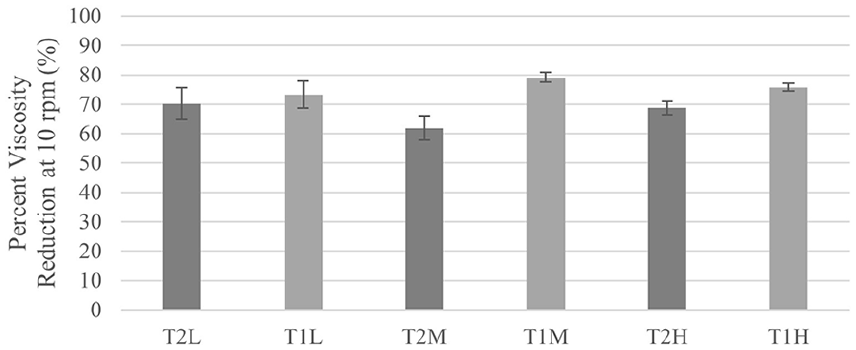
Percent viscosity reduction of viscous solutions at 10 rpm.
The gel with the greatest viscosity reduction was T1-MID, 79.1% at 10 rpm. In Test 2 the greatest reduction occurred in T2-LOW and lowest reduction in the T2-MID gel. Notably, there are different values of percent viscosity reduction between the two tests for comparable samples (T1-LOW, T2-MID and T1-MID, T2-HIGH). An analysis of these tests with a two-way ANOVA determined that both the rpm and composition of the gels have a statistically significant effect on the percent viscosity reduction for both tests. From post-hoc tests, most comparisons between groups were not significant.
Composition effect on silver release
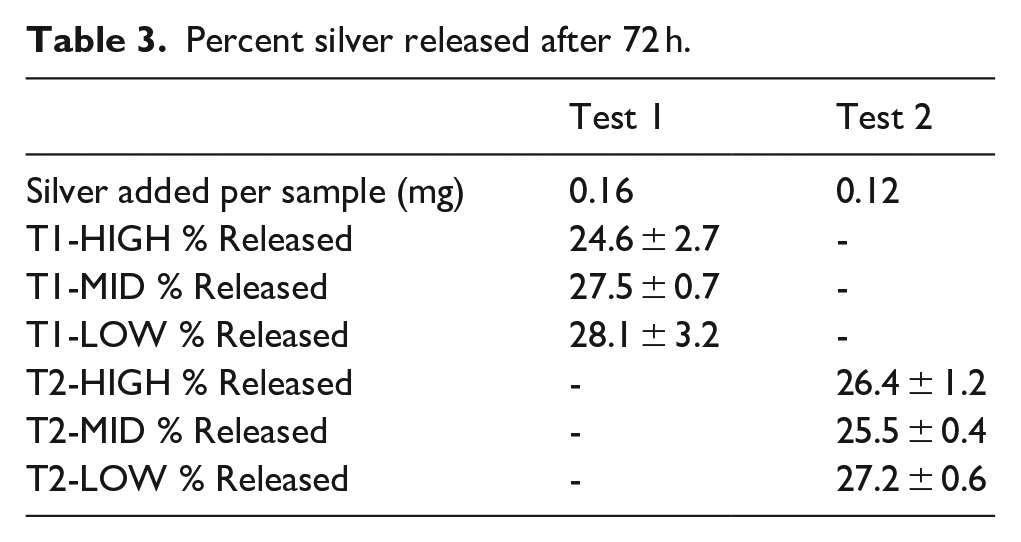
5 mL samples were taken of the PBS at 1, 2, 4, 8, 24, 48 and 72 h and analysed by AAS. Data from Test 1 are shown in Figure 4 and the trends are representative of the release profile also seen in Test 2. Data points shown are an average of three samples with standard deviations as error bars. The trend is such that the greatest silver release occurs in the first 4 to 8 h. All samples had a statistically significant difference in the amount of silver released from 1 to 4 h, some up to 8 h. After this, there are few significant differences. The percentage of silver released was calculated from the measurement of silver concentration of the initial aqueous silver solution. Table 3 shows the percentage of silver released after 72 h for Test 1 and 2. All are between 20% and 30% of the theoretical total of silver added. Between composition groups, there were no significant differences at any time point, despite the significance of both the composition and time effects from ANOVA. The data shown in Figure 5 suggests no trend between initial viscosity and silver release.
Percent silver released after 72 h.
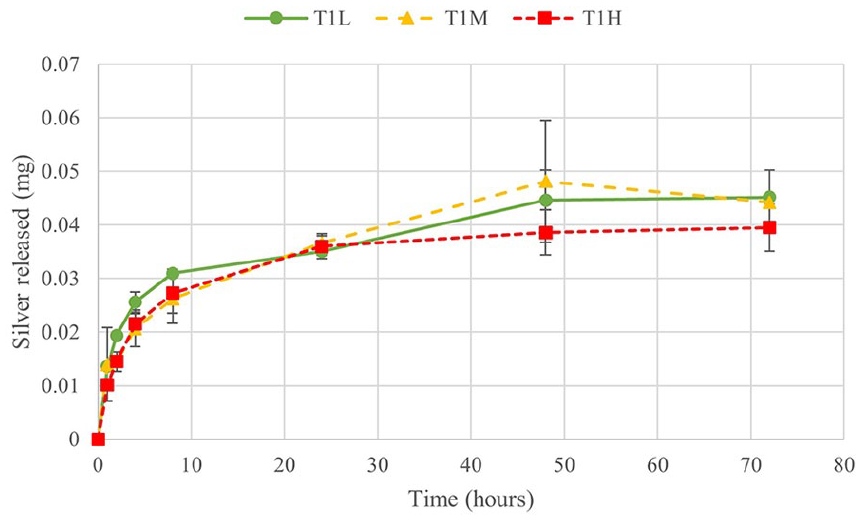
Silver release into PBS over 72 h, Test 1.
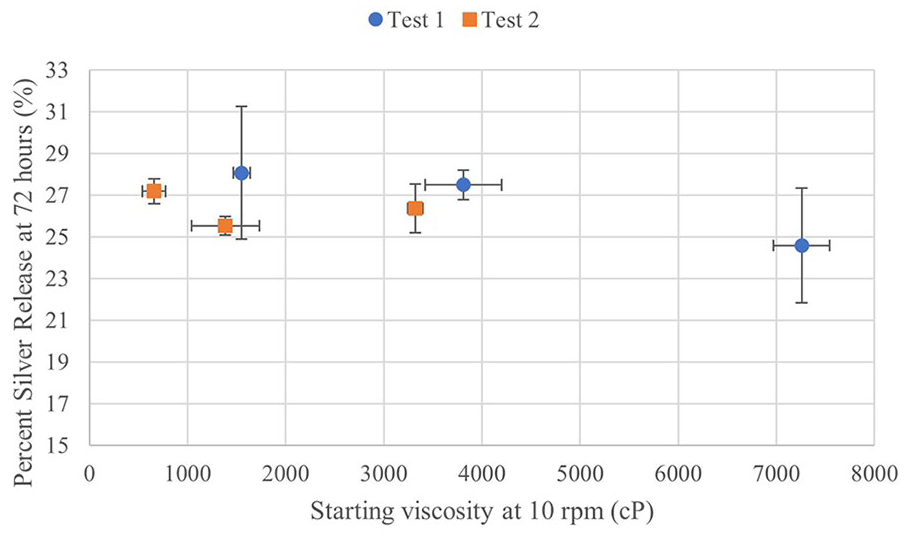
Percent silver released at 72 h compared with starting viscosity at 10 rpm.
Silver effect on viscosity and degradation
Test 1 also included a comparison to a control sample made with the same polymer concentration as T1-MID (0.5% HA, 1% CMC) but with distilled water instead of nanocrystalline silver solution to test the effect of silver on the parameters studied. The control group is referred to as T1-CONTROL. Figure 6 shows the initial viscosities and Figure 7 shows the percent viscosity reduction of these two groups. There are no significant differences between T1-MID and T1-CONTROL for the initial viscosity or the percent viscosity reduction at any shear rate. While T1-CONTROL appears to have a lower starting viscosity and percent viscosity reduction than T1-MID, there was more variability in T1-CONTROL and the differences were not significant.
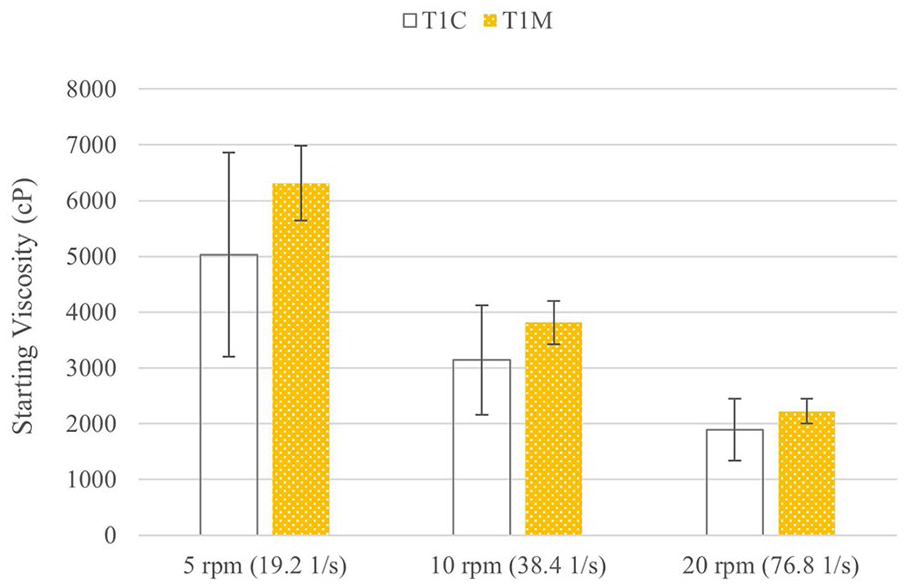
Comparison of starting viscosities for control and silver-containing gels.
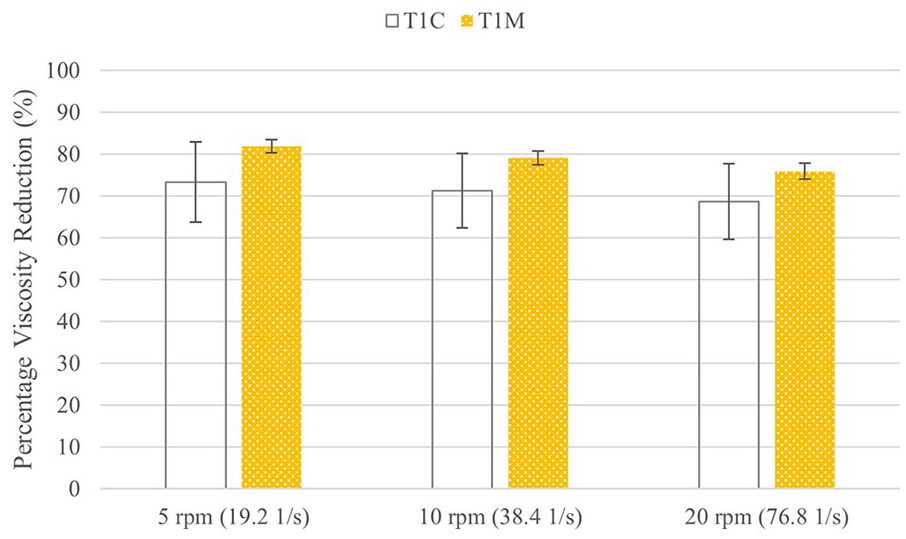
Comparison of percent viscosity reduction for control and silver-containing gels.
Effect of pH on viscosity
While Tests 1 and 2 studied the effects of varying concentrations of HA and CMC at their unmodified pH of approximately 7, Tests 3 and 4 used a set composition to test the effect of pH on degradation and silver release. 9 mL of silver solution was taken and 1 mL of potassium phosphate monobasic was added to yield a pH of approximately 5 (T3-ACIDIC, T4-ACIDIC) or 1 mL of 10 mM sodium hydroxide for a pH of approximately between 8 and 9 (T3-BASIC, T4-BASIC). T4-NEUTRAL had no modifications to pH, resulting in a pH of 7.66 at the beginning of the test. All solutions had the same polymer composition of 0.5% w/v HA and 0.5% w/v CMC.
Two-way ANOVA on the initial viscosities determined the variables of pH and shear rate have a statistically significant effect on the gels for both tests. Viscosity curves are not shown, but a comparison of starting viscosity plotted against starting pH is shown in Figure 8. While the starting viscosity is not consistent across all samples, there also is not a clear trend. In Test 4 measurements, a greater distinction is seen between pH groups is seen than at the beginning of the test than in Test 3. In Tests 3 and 4, the high pH group (T3-BASIC, T4-BASIC) had higher ending viscosities than low pH (T3-ACIDIC, T4-ACIDIC). For Test 3 post-hoc tests, the only shear rate at which there is a significant difference between pH groups is at 5 rpm (p = 2.06E-03). For Test 4 post-hoc tests, there was a significant difference between T4-ACIDIC (pH 5.02) and T4-BASIC (pH 8.02) pH groups at all shear rates. The only significant difference between T4-NEUTRAL and T4-BASIC is at 5 rpm, and there are differences between T4-NEUTRAL and T4-ACIDIC at 5 and 10 rpm.
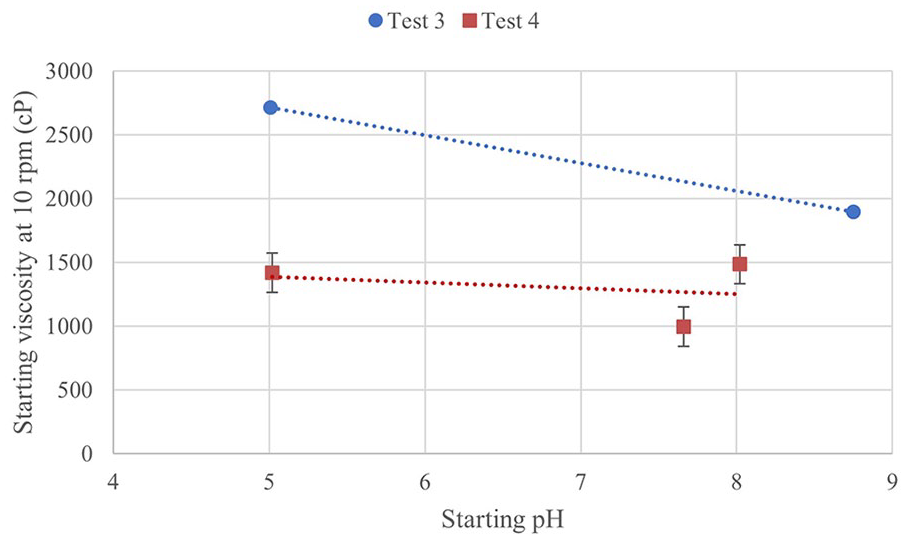
Starting viscosity at 10 rpm plotted against pH for Tests 3 and 4.
Effect of pH on degradation
For degradation, T3-ACIDIC and T3-BASIC both have a greater reduction in viscosity in comparison to T2-MID, and Test 4 samples have a lower percent viscosity reduction. A two-way ANOVA shows that both shear rate and pH have a statistically significant effect on the percent change of the gels for both tests. Trends show a potential decreasing trend in percent degradation with increasing viscosity. Few comparisons are found to be significant. The percent viscosity reduction is for Test 3 and 4 is shown in Figure 9.
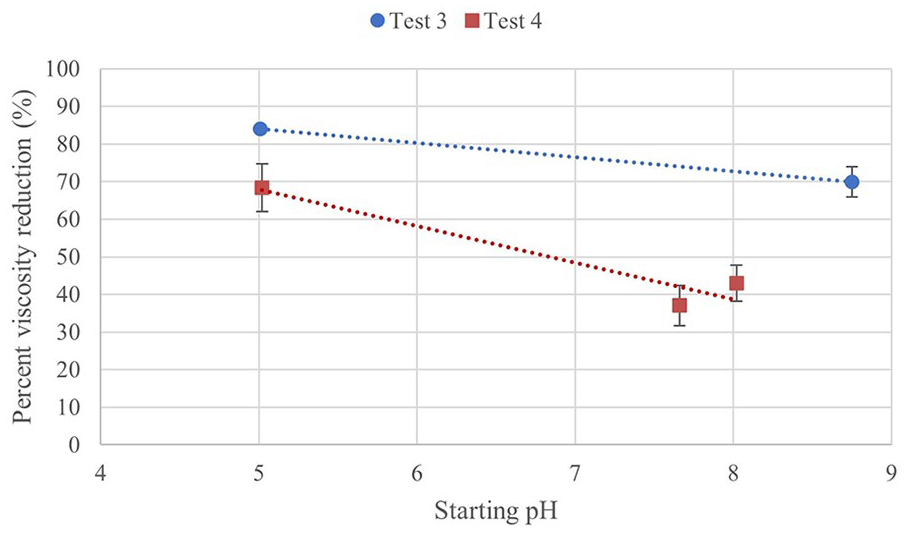
Percent viscosity reduction at 10 rpm plotted against pH for Tests 3 and 4.
Effect of pH on silver release
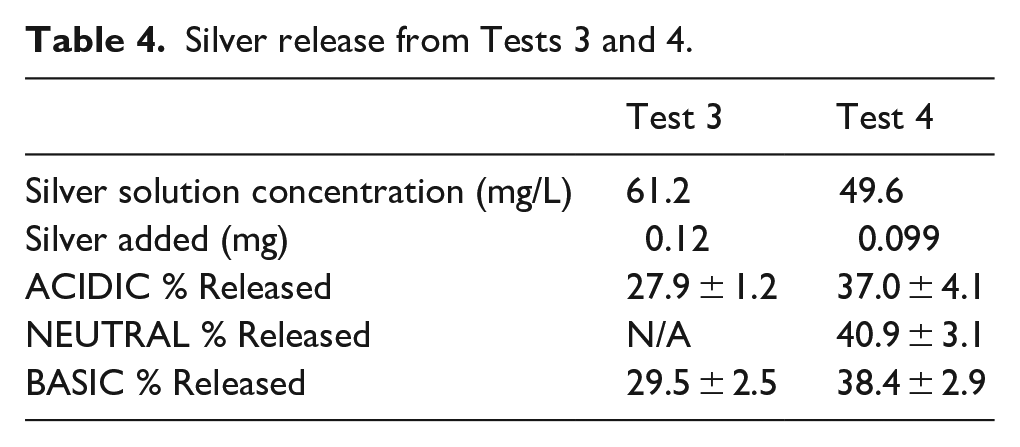
Table 4 displays the percent silver released by the end of the test at 72 h. Figure 10 shows the trend of total silver release by starting pH. The trends and comparisons are similar to what was seen with Tests 1 and 2. The silver released from the T3-BASIC gel between 8 and 24 h was significant, increasing for a longer time before reaching a plateau. The T3-BASIC and T3-ACIDIC gels followed a similar silver release profile as previously recorded, with statistically significant differences to other time points at 1, 2 and 4 h followed by no significant differences after.
Silver release from Tests 3 and 4.
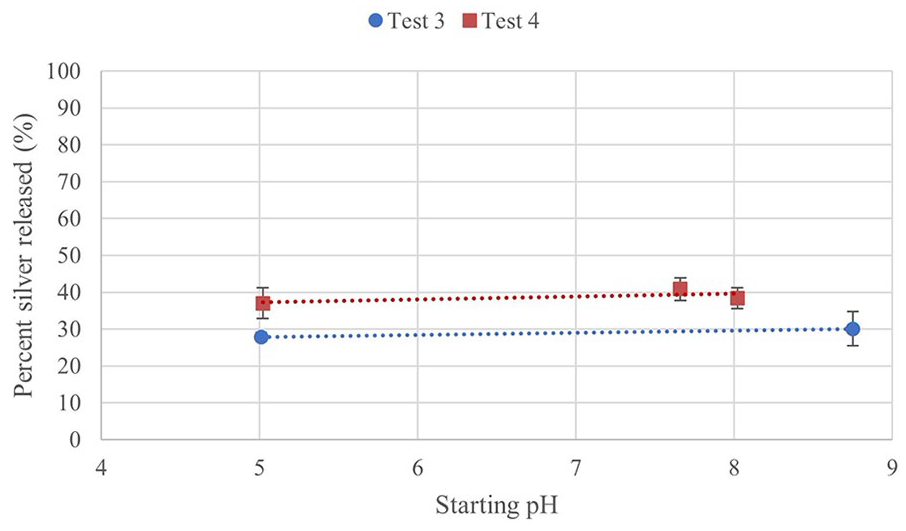
Percent silver released after 72 h plotted against starting pH.
For Test 4, the starting silver in each gel was 0.099 mg, compared to 0.12 mg in Test 3, but a larger total amount of silver was released in Test 4. There is more of a plateau after 8 h than was seen for Test 3. In Test 3, the high pH group released marginally more silver than the low pH group, this is true as well here, although the Mid pH group exceeds all other groups. By 72 h, there are no significant differences between pH groups for Test 3 or 4. Differing from previous tests, there was not a significant increase from 1 to 2 h in any group for Test 4, nor from 2 to 4 h. From 4 to 8 h, only the Low pH group had a significant increase. As with Test 3, only time had a significant effect on silver release, from ANOVA, not pH.
Discussion
Test 1 provided an initial range of viscosities for study. However, the limitation of high viscosity solutions such as the 1% HA-1% CMC (T1-HIGH) are due to the difficulty of properly mixing and the difficulty in loading and applying the gel. A challenge of measuring a wide range of viscosities, depending on shear rate, was found in using the same spindle for all samples to ensure consistency. In some cases, the maximum torque was exceeded, so the measurements at the highest shear rates were less reliable. Viscosities measured at the lowest shear rates had the most variation between samples and measurements. For these reasons, the viscosities at 5, 10 and 20 rpm were used for statistical analysis and comparison.
The viscosity curves seen through this study agree with what is expected from literature – shear thinning fluid behaviour. In semi-dilute HA solutions of 0.5 wt% to 1 wt%, the solutions display Newtonian behaviour at high shear rates due to the alignment of chains. 28 In this experiment, at high shear rates and low polymer concentrations, the viscosity curve begins to plateau around 200 1/s shear rate. CMC also has reversible shear-thinning properties, where increasing shear rates disrupt hydrogen bonding between chains, decreasing the measured viscosity. 29 It is suggested that these low shear rates increase viscosity by entangling polymer coils. 30
In this study, there does not appear to be a trend in percent viscosity reduction according to composition. At low concentrations of polymer, there are fewer significant differences before and after, despite a percent viscosity reduction of at least 50% for all samples. However, a lesser degree of shear thinning behaviour was seen for lower concentration samples, especially after the experiment, and is expected from literature. Low concentrations of polymer at high shear rates act like Newtonian fluids.
The maximum silver released in Test 1 was up to 0.05 mg, or 30% of loaded silver. Test 2 only saw a maximum release of up to 0.035 mg. It is possible that the increase in pH of the PBS is the reason for the limited release. At 24 h, for both Test 1 and 2 the amount released was just above 0.03 mg, but in Test 1, the release continued to increase, while it plateaued in Test 2.
There are limited correlations to be discerned between starting viscosity and percentage of silver released. However, the 1% HA-1% CMC gel (T1-HIGH), which had an initial viscosity at 10 rpm double the next highest group, appears to have the lowest percent release. It is expected from literature that the higher the starting viscosity, the less degradation and slower silver release. This group, despite a high percent degradation, still had an ending viscosity comparable to the initial viscosities of lower concentration samples. So, much of the silver is likely still bound to the polymer for all these gels. It is also notable that only polymer segments less than 10 kDa could be released from the dialysis cassettes into the surrounding PBS. The release profiles seen in literature are similar to what is seen in this study, however the percentage of total silver released is lower than expected. It is possible that the cause of low percentage silver release is strong binding of the silver to the polymer, even as it became fragmented.
In a 2008 release kinetics study, 4–20 mg/mL of dexamethasone was mixed into 1% or 2.3% sodium hyaluronate. 31 No change in viscosity was observed with the inclusion of the drug. 31 Release into PBS or BSS (balanced salt solution) saw comparable kinetics for drug release as seen here. 31 This study saw a release profile characterized by a moderate burst release initially, where 50% of the drug was released in the first 6 h, then release slowed after 24 h, with steady state reached after 48 h. 31 Over 3 days, 90% of the dexamethasone was retrieved, with a full replacement of the surrounding fluid. 31
It is expected that the viscosity would not change significantly with pH in the range studied. There is variation between samples, but there is not a consistent trend with pH. The potential decreasing trend of viscosity with pH in Test 3 was not seen in Test 4. There appears to be a trend of decreasing viscosity reduction with increasing starting pH, but more samples with a greater range of pH would be needed to confirm this. CMC is found to form dense aggregates at low pH (pH 1.6), but are uniformly distributed with little entanglement at pH 7. 32 The dense aggregates resulted in a lower bulk viscosity, as it is easier to orient large molecules to the flow of applied shear stress. 32 Above its pKa, CMC chains are negatively charged, with more repulsive forces increasing sample viscosity and decreasing the degree of shear thinning behaviour. 32
Independent of pH there may be an effect of adding certain ions to the polymer solution on viscosity. HA solutions of concentration 0.05% to 0.5% were modified with phosphate buffers and NaOH in a 2008 study. 18 At all pH values, there was Newtonian fluid behaviour for low concentrations of HA. 18 For 0.5% HA solutions, at high pH (approximately 13), there is such disruption in intermolecular bonds that the viscosity is very low and the profile is of Newtonian flow, with some of this effect also seen at very low pH (pH 1–2). 18 At pH 7 there is minimal rupture of chains. 18 In an earlier study, it was seen that below 1.5, the disruption of HA chains was irreversible, but around pH 5, there is a reversible decrease in intrinsic viscosity. 33 HCl lowers the pH below the pKa of NaCMC (pKa = 3.65), decreasing the charge density and facilitating interactions between CMC chains. 34 The addition of 0.5 M NaOH (resulting in pH 13.5) decreases viscosity and 0.5 M HCl (pH 0.5) increase viscosity, by decreasing available bonds, or decreasing the charge density. 34 The pKa of HA is approximately 3.
The addition of salts decreases the solubility of polyelectrolytes like CMC, but chains are more likely to aggregate, which could increase the viscosity. 34 NaOH bonds with available blocks on the cellulose backbone, preventing these blocks from interacting with other CMC chains. 34 Another study of CMC gels found that sodium, chloride, and hydrogen ions had the effect of decreasing the viscosity, however this was only seen if the CMC is dissolved in water after the ions have been added, by shielding CMC from intermolecular interactions with itself. 29 However, this lower viscosity may be due to incomplete dissolution, as salts slow the dissolution process. 34 This may account for some of the differences in viscosity between Tests 3 and 4, where the point at which the pH modifying ingredient was added may have been different.
The inclusion of silver in the gel does not appear to have had an effect on the viscosity or degradation in this experiment. In some cases, the inclusion of drugs or other compounds can increase or decrease the viscosity depending whether it disrupts or supports hydrogen bonding, but nanocrystalline silver does not participate in hydrogen bonding, and should therefore not have an effect. 35 While there were no significant differences in initial viscosity or degradation rate, there were seen trends that the control gel may have a lower viscosity and slower degradation. If this is true, then the inclusion of silver may increase initial viscosity and degradation over time, but more data would be needed to support this claim.
Temperature at measurement of viscosity or time of mixing was not controlled or measured during this study but may be partially responsible for the differences in viscosity between different tests of similar composition. Some work suggests that at the polymer concentrations that are used in this present study, the differences in viscosity between 25°C and 37°C should have only a marginal effect on relative viscosity. 28 However, in solutions of CMC only, a 1% solution could decrease by approximately 50% in measured viscosity between 20 and 40 degrees at 50 rpm. 29 Changes in viscosity with temperature are more significant with lower temperatures. 36 The difference in apparent viscosity from 30°C to 40°C is minimal, but there is a significant difference from 10°C to 20°C. 36
Conclusions
There does not appear to be one composition group significantly different than others for silver release or degradation. From literature, it would be expected that higher viscosity polymers (like T1-HIGH) would degrade slower and release less silver. However, this was not directly seen in terms of percentage of viscosity lost. Potassium phosphate could be consistently used to decrease the pH without changing the initial viscosity, with a similar, but less consistent effect of increasing the pH with sodium hydroxide. pH did not appear to change the initial viscosity, degradation or silver release in vitro, but the differences may be seen in affecting the inflammatory response in vivo.
Footnotes
Acknowledgements
Thanks to Shiraz Merali at the University of Alberta for assistance with Chemical Analysis.
Declaration of conflicting interests
The author(s) declared no potential conflicts of interest with respect to the research, authorship, and/or publication of this article.
Funding
The author(s) disclosed receipt of the following financial support for the research, authorship and/or publication of this article: University Hospital Foundation, Alberta Innovates Graduate Student Scholarship, Natural Sciences and Engineering Research Council of Canada