
Abstract
When it comes to using bio-metals, the chemical and biocompatibility properties of titanium led to its widespread use in biomedical implants. However, pure titanium possesses lower mechanical properties than Ti alloys containing cytotoxic elements. Severe plastic deformation (SPD) techniques were able to cause a significant strength increase, corrosion behavior improvement, and the release of the alloying elements. In this study, the ECAP process was performed on commercially pure titanium with a square cross-section at two and four passes, which resulted in a finer grain size and a more uniform microstructure. In order to improve cell behaviors, etch treatment was performed to produce nano-rough and nano-texture surfaces for all Ti samples. The effect of surface etching on corrosion, surface roughness, and cell behaviors on ECAP and untreated samples was also investigated. Optical/Field Emission Scanning Electron Microscopy, Atomic Force Microscopy, and X-Ray Diffraction were used to study the microstructural characterizations of samples. In addition, the impact of grain structure on the contact angle, electrochemical corrosion behavior, osteoblast response, and cell viability was investigated. The titanium that was ECAPed four times provided finer grains (200 nm) than the unprocessed sample (25 µm). The potentiodynamic polarization test revealed that corrosion resistance of ECAPed samples was enhanced, which was associated with grain refinement, affecting the passive film formation. Corrosion resistance and wettability experienced an apparent increase after each ECAP pass. In conclusion, improvement of grain size and surface roughness was due to the simultaneous effect of ECAP and etching treatment that led to the osteoblast response and cellular activity of samples.
Introduction
Titanium is extensively used in biomedical products for its properties, including its inertness and biocompatibility. 1 One downside related to the employment of commercially pure titanium in a wide range of industrial and medical settings, compared with Ti alloys, is its comparatively lower mechanical strength, especially fatigue strength. However, considering Ti-6Al-4V as an example, the added aluminum and vanadium ions can cause toxicity to the organic environment.2,3 Nanostructured titanium produced using severe plastic deformation (SPD) techniques was introduced to overcome these problems as a good candidate. Titanium’s mechanical characteristics such as strength and fatigue resistance can be increased even more than those of Ti-6Al-4V by forming nanostructures using such methods.4,5 Moreover, since an amorphous titanium oxide layer covers the nanostructured titanium’s surface, its biocompatibility and corrosion resistance can also be improved. 6
One of the SPD methods, which can provide homogeneous ultrafine grain (UFG) titanium with high-angle grain boundaries, is equal-channel angular pressing (ECAP), attracting a big deal of attention.7–10 ECAP deformation refined grain size, according to Roodposhti et al. 8 which was followed by the formation of new high angle boundaries and a large number of deformation twins. UFG-produced solids had relatively homogeneous structures and average crystal sizes of less than ∼1 μm. 11 It was also proved that increasing the number of ECAP passes affected the grain size of the titanium and decreased it.12–14
Faghihi et al. 15 demonstrated that ultra-fine crystals (<50 nm) (using the ECAP method) improved the physical and biological behavior of the CP Ti. The ultra-fine grain titanium prepared by ECAP showed a remarkable corrosion behavior improvement in simulated body fluid. Besides, after each ECAP pass, the content impurities became more dispersed, leading to a rise in corrosion resistance. 16 Sandeep Kranthi Kiran et al. 17 created a nanostructured Ti surface using piranha treatment on ECAP sample, which prevented bacterial adhesion but stimulated host cell adhesion. Literature showed that the properties of the titanium oxide nano-layers reduced adherence of bacteria such as Staphylococcus epidermidis and increased adherence of osteoblasts. In vitro studies demonstrated that nanostructured titanium had better cell viability and proliferation than coarse-grained counterparts.18,19 Kim et al. 20 proved that wettability, cell adhesion, and proliferation of mouse fibroblasts led to the better biocompatibility of ultrafine grain titanium obtained by the ECAP method.
The ability of the ECAP process to produce CP-Ti with a variety of grain sizes and textures was investigated in this study, and the effect of etching solution on these parameters was investigated for ECAPed and untreated samples. In addition, the effect of surface characteristics such as surface topography and grain size on the corrosion behavior and viability of osteoblast cells was investigated.
Experimental
Sample preparation
For ECAP treatment, a square billet of CP Ti (Grade 2) with a ten square millimeter-meter cross-section and a 70 mm length was wire cut from the plate. Then, at 800°C, the annealing process was performed 4 h before ECAP.
Figure 1(a) represents the used ECAP scheme with a channel/corner angle of 105°and 20°. The microstructure evaluations of titanium samples before ECAP, after ECAP, and after ECAP with etching process were demonstrated in Figure 1(b) to (d), respectively. According to Figure 1(d), the grain boundaries’ metallography image was well defined compared to the other samples.

(a) ECAP tool used for SPD treatment to CP Ti (grade 2) with the open channeling die. Microstructure OM: (b) before ECAP, (c) after ECAP, and (d) after ECAP and etch treatment.
In order to process CP- Ti billets, the rectangular specimens were pressed utilizing route BC by using ECAP die, consisting of a sequence of rotations of the workpiece 90° along its longitudinal axis between proximal passes. To lubricate the connected surface, molybdenum disulfide was applied. Before each ECAP run, the Ti billet and die were preheated to 400°C. The as-received sample was considered as a control sample. The samples were then sliced perpendicular to the exit channel of the ECAP die path and polished with 100–2000 grit papers. The deformed compression samples were cut along the compression axis from the center. Samples were dipped in an etching solution containing 10% HF, 10% HNO3, and 80% H2O, for 10 s to remove the compact TiO2 layer. After that, they were washed with ionized water and degreased with ethanol. 21
As-received, two and four passes ECAP samples after etch treatment was marked as P0, P2, and P4 in this study, respectively.
Surface characterization
The surface microstructure was studied using an optical microscope (OLYMPUS-BX41M, Japan) and field emission scanning electron microscopes (VEGA II, TESCAN, USA). Then, their obtained images were analyzed to determine the grain size. The XRD evaluation was carried out using a Panalytical Xpert Pro system with a θ-θ geometry diffractometer in reflection mode at λ = Co K-α wavelength. To obtain the surface topography data and investigate the roughness of the sample surface, an atomic force microscope (DualScope™ DS95, DME, Denmark) was employed, and its data was analyzed by DME image software.
Before FE-SEM characterization, samples were etched in a solution containing 10% HF, 10% HNO3, and 80% H2O. Then, they were washed with water and degreased with ethanol. After that, the samples were coated with a thin layer of gold by using gold sputter-coating (Technics Hummer V, CA, USA) in a 100 mTorr vacuum argon environment for a 3 min period and 10 mA of current. The area selected for AFM imaging was considered 5 µm × 5 µm. Investigation of the surface topographies was performed between 0.1 nm and 10 µm. During the measurements, the temperature and moisture of the experiment environment were adjusted at 25°C and 40%, respectively.
Surface wettability
Before contact angle measurements, the surface of the samples was degreased with acetone, washed with water, and then dried at room temperature. The wettability of the surface of the samples was obtained by the Sessile Drop Method, which often made direct measurements of the contact angle, using an IRASOL (CA-500A) instrument equipped with a digital camera and recorded with the DROPimage advanced v 2.8 software. In order to maintain the same volume of deionized (DI) water droplets, an automatic pipette was used (0.5 mL). Further, to obtain accurate results, the experiments were carried out at constant conditions (temperature and moisture, 22°C and 60% respectively) in three different positions on each sample at a 1-min interval.
Corrosion test
In order to conduct electrochemical measurements to study the corrosion behavior of samples, ohmic contact with copper wire and one side active surface area of the samples was obtained around 25 mm2 by stripping them in epoxy resin obtained the conductivity of the samples. The samples were degreased in ethanol and rinsed in double-distilled water. Table 1. represents the composition of simulated biological fluid (SBF) used as the corrosive electrolyte which its pH and temperature were adjusted at 7.4 and 37°C ± 2°C, respectively. 22
Chemical composition of simulated biological fluid (SBF) used as the electrolyte for electrochemical tests.

Electrochemical measurements were carried out using an Autolab PGSTAT12 (Metrohm Autolab B.V., The Netherlands) with an FRA module. A conventional electrochemical cell including platinum as the counter electrode, Ag/AgCl (3M KCl) as the reference electrode, and the ECAPed samples as the working electrode was employed. The potential of samples was stabled for 2 h at open circuit potential (OCP), and then electrochemical impedance spectroscopy was conducted at the same potential. The AC voltage amplitude and the frequency range of EIS were considered ±10 mV and 50 kHz–10 mHz, respectively. NOVA 1.10 software was used to interpret the results of the EIS. Potentiodynamic polarization measurements were made with a 10 mV/s scan rate in the range of −600 to 1000 mV with respect to OCP under free atmospheric conditions. Corrosion current density and potential values for studied samples were calculated using Tafel extrapolation methods. Electrochemical tests were performed after dipping the samples in SBF electrolyte for 2 h.
Human osteoblast cell line culture
Control (as-received titanium) and ECAPed (two and four passes) samples were sterilized in an autoclave at 120°C for 30 min. Dulbecco’s modified Eagle’s medium (DMEM) culture medium was then used to incubate the samples into it. After adding 10% fetal bovine serum (FBS) to the medium, Saos-2 osteoblast cells were cultured. The culture was held in a simulated humidified atmosphere involving 95% air and 5% carbon dioxide at 37°C. The medium of culture was updated every day. Saos-2 osteoblast cells were used for biocompatibility tests. The samples were removed after 24, 48, and 72 h and fixed with 2.5% glutaraldehyde buffer. Then, dehydrating sequentially in 30%, 50%, 70%, 95%, and 100% ethanol series and attaching cells on samples were investigated by SEM. The assessment of the viability of the cells for as-received titanium and ECAPed one was performed using the MTT assay. Ultra high molecular weight polyethylene was used as a negative control. The samples were cultured similarly, with 720 μL of culture medium and 80 μL of MTT solution. After carefully removing the supernatant, dimethyl sulfoxide (DMSO) was applied to each well to dissolve the purple formazan completely. Spectrophotometry at a wavelength of 570 nm was used to measure the viability percentage.
Results and discussions
Characterization of the substrates
FESEM and Optical Microscopy (OM) investigation
The microstructure evaluations of samples are shown in Figure 2 Optical microscopy images are shown in Figure 2(a) to (c) illustrate homogenous equiaxed microstructures for all samples. As can be seen, the metallography image of a CP-Ti before ECAPs showed a larger grain size in comparison with the ECAPed samples, and the most refined grains were achieved after four passes of the ECAP process. Figure 2(d) to (f) shows FESEM images which present microstructures of as-received, P2 and P4 samples. As shown in Figure 2(d) to (f), ultrafine grains were obtained after two and four passes of the ECAP process. After two passes of ECAP, a pure shear force led to deformation of grains and elongation of grains occurred along the longitudinal direction. The deformed microstructure showed that the shear bandwidth was smaller than the second pass in the fourth pass. The proportion of high-angle grain boundaries increased with the increasing number of passes, which caused the uniformity of the microstructure to increase. 23 Further, restoration, primarily recovery and recrystallization, was proved to significantly impact grain refining at temperatures of 200°C–450°C.24,25 ImageJ software was used to determine the average grain size of samples as an image analysis software. The grain size average of 25 μm, 1 μm, and 200 nm were achieved for as received, P2, and P4 samples, respectively.

Microstructure OM (left) and SEM (right) images for (a and d) as-received, (b and e) P2, (c and f) P4 samples illustrate homogenous equiaxed microstructures for all samples before and after the ECAP process.
XRD study
XRD analyses were conducted to study the crystallographic properties and existing phases of all the samples’ surfaces before and after the ECAP process (Figure 3). Peaks related to all samples appeared at 2θ = 35.23, 38.49, 40.67, 52.78, 63.23, 70.84, and 76.12, associated with the phases (100), (002), (101), (102), (110), (103), and (112), respectively. 8 Despite some differences in intensities, the results showed that all samples had relatively identical crystalline phase compositions. The ECAP XRD peaks appeared wider than those of the untreated sample, indicating that the titanium crystallite size became fine and the micro-lattice strains increased during ECAP. Furthermore, the ECAPed samples showed a slight change in peak position (nearly 1° to the right), which can be linked to the residual compression caused by grain boundaries refinement. 12

X-ray diffraction of: (a) as-received, (b) P2, and (c) P4 samples.
AFM study
In order to study surfaces roughness and topography of titanium samples, the three-dimensional AFM analysis was carried out, as shown in Figure 4(a) to (c). The results proved that the ECAP process affected the surface roughness of ECAPed-titanium samples and increased it. As for calculating the surface roughness, both the average roughness (Ra) and the route mean square roughness (RMS) were evaluated. RMS was much more sensitive than Ra to large and small height deviations from the mean. Ra and RMS values were 49 and 60 nm for P2 and 67 and 91 nm for P4, respectively, which were more than those calculated for as-received titanium surfaces of Ra = 31 nm and RMS = 38 nm. The lack of deep valleys on the surface of as-received titanium can explain the slight differences in Ra and RMS values. However, the existence of deep valleys on the P4 floor accounts for the notable difference between Ra and RMS. The results obtained from AFM were consistent with FESEM microstructure images. The observed surface roughness was related to the simultaneous effect of ECAP and etch treatment.
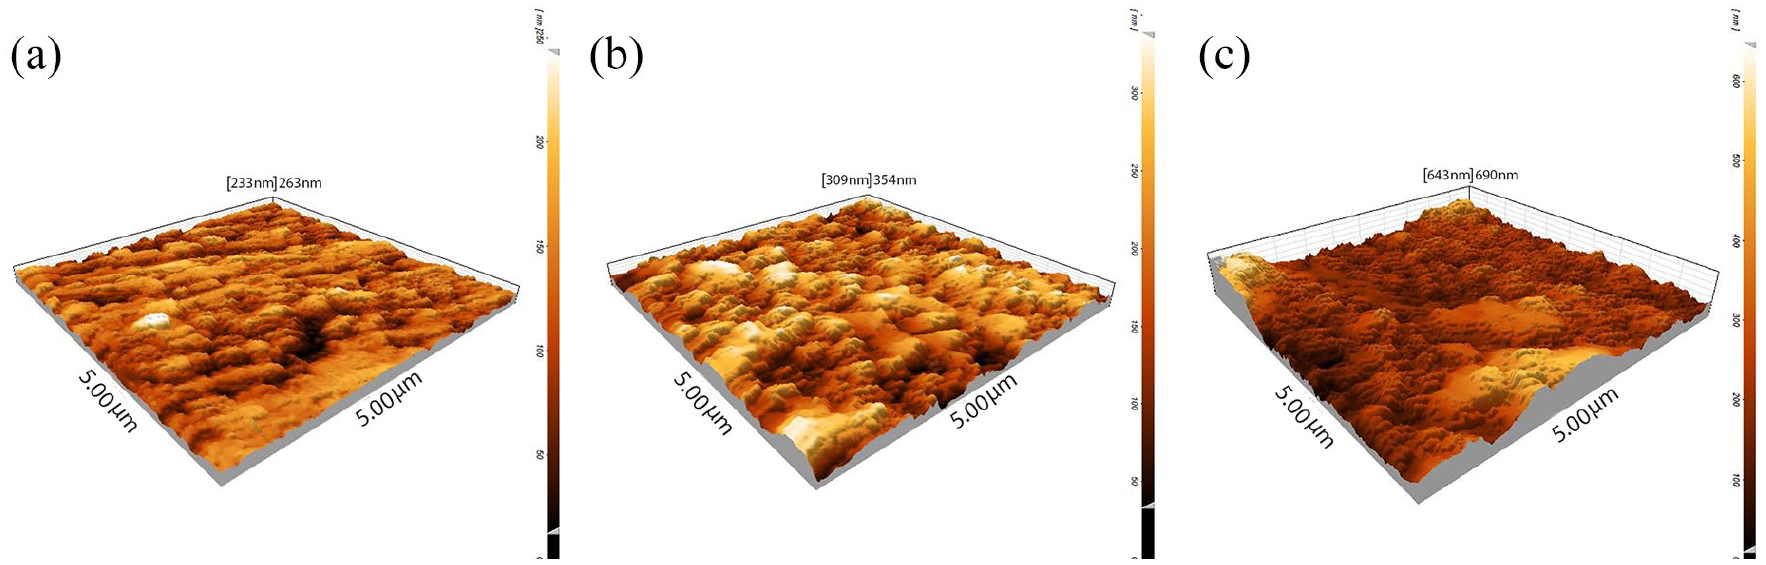
AFM-3D- images for: (a) as-received, (b) P2, and (c) P4 samples. (5 μm × 5 μm scanning areas) ECAP process leads to a roughness increase on the Ti surface.
It was reported that the surface topography affected the cell behavior of the titanium alloy surfaces, and the ECAP process, therefore, can lead to higher activity, osteointegration, and biomechanical fixation of Ti implants.26–28
Wettability
The wettability of titanium samples, their contact angles were measured by contact angle test and reported in Figure 5. As can be seen, a lower contact angle was measured for the modified Ti samples accompanied by better wettability. In the P4 sample, the contact angle was reduced by 24° and for the P2 sample, this value decreased by 16° compared to as-received titanium. The higher wettability of ECAP samples can be attributed to the rougher surface, which was analyzed using AFM, as well as the finer grain size, which caused a rise in the energy of the surface. Better wettability was proved to improve the implant substrate’s contact with the surrounding tissue.29,30
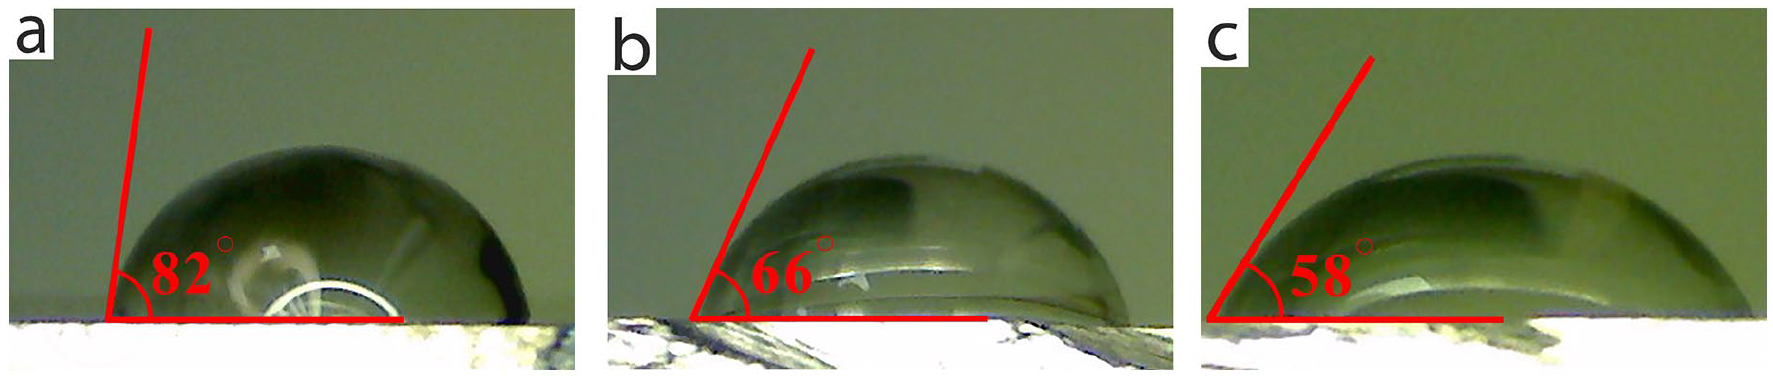
Wettability of: (a) as-received, (b) P2, and (c) P4 samples determined by Sessile Drop Method.
Electrochemical tests
In order to investigate the electrochemical stability of the under observation titanium surface, a potentiostatic polarization test was evaluated. Corrosion potential was linked to the thermodynamic behavior of the immersed samples in SBF solution, and its magnitude cannot be used to characterize the corrosion phenomenon in the present system. Generally, corrosion was less likely to happen in metals with a lower Ecorr value. However, for metals that followed active-passive behavior in a different potential, a more negative value of corrosion potential can be connected with less cathodic reactions resulting from quicker passivation. As shown in Figure 6, the lowest Ecorr value was related to the P4 sample, suggesting that passivation may occur more quickly for P4, leading to inhibition of cathodic reactions. 22

The polarization curves of as-received, P2, and P4 samples dipped in simulated biological fluid solution for 2 h.
Some parameters, including corrosion current density (Icorr), passivation current density (Ipass), corrosion potential (Ecorr), and passivation potential (Epass) derived from the polarization plot, are listed in Table 2. The value of corrosion current density more represented the kinetic activity of corrosion systems more accurately, and the lower Icorr values of ECAPed samples suggested a lower corrosion rate. An apparent fall in corrosion rate occurred after ECAP treatment, and the value of Icorr for the P4 sample (4.3 × 10⁻⁶ A cm−2) was approximately eighteen times lower than the as-received titanium (8.1 × 10⁻⁵ A cm−2).
Potentiodynamic polarization curves derived parameters corresponding to the as-received, P2, and P4 samples.

Furthermore, for metals and alloys which show active-passive behavior, passivation potential, and current can also be used to evaluate the corrosion rate. According to Table 2, the ECAP process had a minor influence on Epass in SBF solution. However, The Ipass value was affected by the ECAP process and decreased after each pass, indicating that the ECAP method improved titanium corrosion resistance in the under observation solution. This was due to the easier formation of the passive surface layer and distribution of impurities in the titanium bulk, following mechanical treatment. 13 The results show that the oxidation of titanium occurred at low current densities and TiO2 film formed on the surfaces of ECAPed samples at a greater rate than on the surface of as-received sample. Also, the ECAPed samples had a high density of nucleation sites for passive films, which led to a high fraction of passive layers and low corrosion rates. 16 Furthermore, the corrosion inhibition of ECAPed Ti can also be attributed to the passive layer adherence increase, resulting from the high density of grain boundaries, accompanied by the finer grain size of ECAPed samples. 31 Since grain boundaries had higher energies than the bulk, a high density of grain boundaries led to reactivity increase of the surface by provoking electron activity and diffusion. 22
Electrochemical Impedance Spectroscopy (EIS) measurements conducted at OCP, shown by Bode module/phase diagrams, are presented in Figure 7. The data followed a typical passive system capacitive behavior, consisting of two-time constants, one capacitive loop in the low-frequency range and the other in the high-frequency range. 32
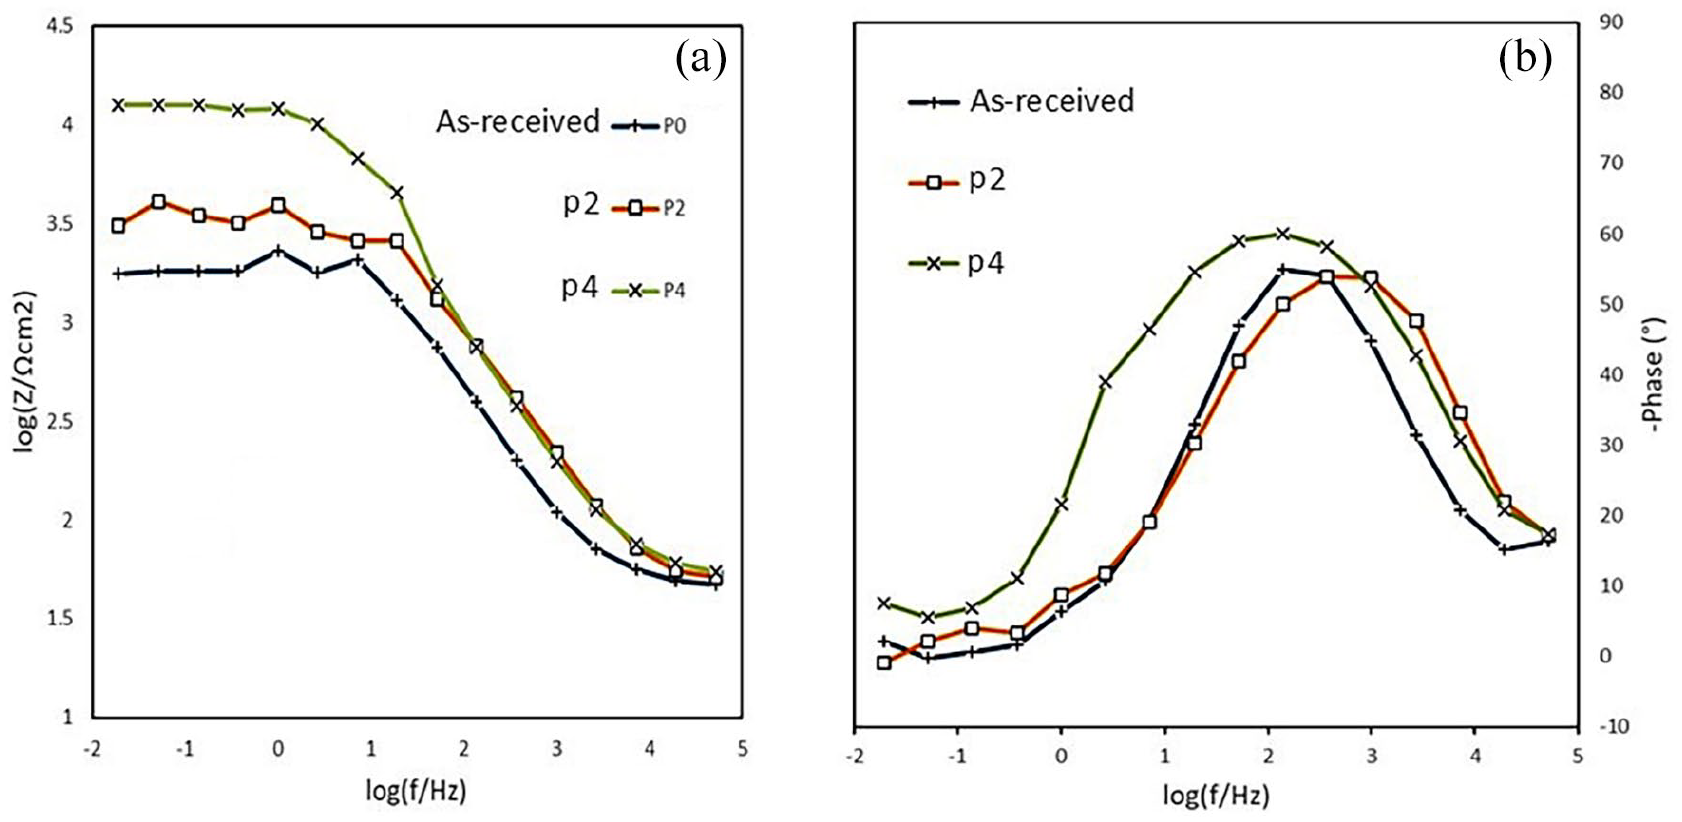
Impedance spectra before and after ECAP process: (a) Bode module and (b) Bode phase of pure as received, P2, and P4 samples.
As shown in Figure 8, an equivalent circuit was employed to obtain fitted data from the experimental impedance data. In this model, Rs represented solution resistance, R1 was the resistance of passivation film and R2 was corresponding to the resistance of charge-transfer reactions. CPE1 (CPE2) indicated the constant phase element of passivation film (the electric double layer). 33

An equivalent circuit (EC) was used to fit the impedance data. Rs: solution resistance, R1: resistance of the outer nanotube layer, CPE1: constant phase element of the outer nanotube layer, R2: resistance of the inner barrier layer, and CPE2 is corresponding to the inner barrier layer.
The fitted electrochemical parameters, extracted from EIS data with lower than 4% error, are shown in Table 3. The fitted and experimental data were well-matched, as shown by the low X2 value of about 0.01. All the samples showed high corrosion resistance, which can be linked to the passive layer formation on the all Ti surface, regardless of ECAP processing. The higher R2 value compared to R1 value for all samples indicated that the compact passive layer was almost responsible for the corrosion protection.
Electrochemical parameters extracted from EIS spectra of as-received, P2, and P4 samples.

The results indicated a slight reduction in the titanium corrosion rate in SBF with a decline in the average grain size. Ralston and Birbilis 34 proposed that the corrosion rate of active and passive metals was proportional to their grain size. Generally, small grain size microstructures had a high grain boundary volume, which was more active than coarse grain-sized ones. For active-passive metals, however, the more active sites caused by smaller grain size can form a more stable passive layer, preventing the surface from more corrosion. 35 This is the result of the easier formation of Ti(OH)2 passive film for ECAPed Ti compared to as-received one.36,37 The EIS results verified polarization outcomes.
Cell culture
A human osteoblast cell line, Saos-2 osteoblast, was employed to study in vitro biocompatibility of ECAPed Ti and as-received Ti, considered as the control sample. The qualitative assessment of Saos-2 osteoblast cells morphology was carried out after 3 days using SEM images, as shown in Figure 9. On the as-received and ECAPed samples, Saos-2 osteoblast cells attached, developed, and expanded well; they stick to one another with cellular micro-extensions, as well as to the framework. However, the number of cells on the P2 and P4 were relatively more than that on the as-received surface. Cells on P4 also had more elongation and confluence than the P2 cells, as shown in Figure 9(b) and (c). In contrast, cells on the as-received sample exhibited few filopodia and showed no confluent layer formation on the surface due to the lower surface energy and biocompatibility. A considerable amount of ECM mineralization on ECAPed Ti surface (P4) also showed that the surface energy of Ti enhanced wettability and in vitro biocompatibility.

SEM image of Saos-2 osteoblast cell attachment, growth and spreading after 3 days on: (a) as-received, (b) P2, and (c) P4 surfaces.
The MTT assay resulting from the samples after various periods of cell culture with Saos-2 osteoblast is shown in Figure 10. The percentage of viability values of osteoblasts were significantly grown up on the ECAPed samples after being incubated for 24, 48, and 72 h. After 72 h of incubation, the cell viability percentage became the highest, and the proliferation of cells was confirmed. Overall, the results of the MTT assay showed cell proliferation with the increase of culture time.

MTT assay cells cultured using Saos-2 osteoblast after being incubated for 24, 48, and 72 h, showing cell proliferation with increased culture time.
Superior biocompatibility of the titanium after four passes can be associated with the higher surface roughness and its topography reported in section 3.1. Decreasing the grain size through the ECAP process, resulting from the enhancement of nano-peaks on the surface, can be considered an important factor affecting the mechanical and biocompatibility of materials. Another effective factor for the increased adhesion cell of ECAPed titanium was their higher surface hydrophilicity.38,39
Conclusion
In this work, ECAP treatment, with two and four passes in BC mode, was processed using commercial titanium, and the considerable conclusion is listed below:
1. Microstracrul observations proved that four pass ECAP sample grain size, 200 nm, was finer than the as-received sample, 25 µm.
2. The ECAP process did not affect crystalline phase compositions; it could form the new fine-grain boundaries according to XRD results.
3. Better hydrophilicity and wettability, accompanied by the lower contact angle, were obtained after applying the ECAP process, which was linked to the obtained finer grain.
4. Lower Icorr values in polarization curves for ECAPed samples in comparison with as-received in SBF solution revealed the higher corrosion resistance resulted from quicker passivation of the surface.
5. ECAP process and etching treatment improved cytocompatibility.
6. After 72 h of cell culture, the control sample showed significantly fewer attached cells than ECAPed samples with higher nanoroughness and wettability.
Footnotes
Author contributions
All authors have participated in (a) conception and design, or analysis and interpretation of the data; (b) drafting the article or revising it critically for important intellectual content, and (c) approval of the final version.
Declaration of conflicting interests
The author(s) declared no potential conflicts of interest with respect to the research, authorship, and/or publication of this article.
Funding
The author(s) received no financial support for the research, authorship, and/or publication of this article.
Guarantor
E. B.