
Abstract
Allium cepa extracts (AC) allow the fabrication of a biomaterial that, together with chitosan and PLGA, could be osteoconductive and promote a better and faster regeneration of bone tissue, with biocompatibility and biomineralization properties. In this work, scaffolds were developed by the thermally induced phase separation (TIPS) technique. An in vitro bioactivity analysis was performed using simulated body fluid (SBF). Scanning electron microscopy (SEM), energy dispersion spectroscopy, and infrared spectroscopy were used for the scaffolds characterization. The results showed a structure with a pore size distribution between 50 and 100 μm, which allowed the uniform formation of biological apatite crystals on the surface of the scaffolds. The chitosan/policaprolactone/Allium cepa scaffold (ChPAC) showed the most promising results with a ratio of P/Ca between 1.6 and 1.7, a value very close to that of hydroxyapatite.
Keywords
Introduction
Biomaterials of natural origin such as proteins or polysaccharides are being widely studied because they do not release cytotoxic substances during their degradation, 1 allowing their use in medical areas such as tissue engineering. The regeneration of bone tissue in the last decades has been based on three-dimensional scaffolds with structures similar to the extracellular matrix of bone. 2 Natural polymers have been used on these structures due to their biocompatibility, biodegradability, and bioactivity. 3 Such is the case of chitosan that is a non-toxic material which has functional groups of hydroxyl, carboxyl, and amines that helps the bondage with biological particles that promotes the regeneration of bone, 4 allowing its functionalization by mixing other polymers or compounds to improve their properties such as the case of poly (DL-lactic-co-glycolic) (PLGA).5–6 PLGA contains groups such as lactic acid and glycolic acid monomers. 7 The mixture of chitosan with PLGA produces compounds that exhibit complementary properties. The low mechanical resistance of the chitosan is improved by the PLGA presence and this compound can be used as a vehicle for the supply of drugs and proteins. Additionally, PLGA and chitosan are Food and Drug Administration (FDA) approved.8–10
To obtain a better osteogenic activity and biocompatibility in the polymeric compounds, extracts of natural plants can be added, which help to enhance the bioactivity with the formation of hydroxyapatite on the surface of biomaterials. 11 In this work, Allium cepa is used, consisting mainly of water, lipids, carbohydrates, fiber, potassium, sulfur, phosphorus, calcium, vitamin C, vitamin E, vitamin B-6, folic acid, glutaminic acid, arginine, lysine, and leucine. 12 These substances can form organosulfur compounds, such as allyl propyl disulfide, diallyl sulphide, cysteine, and methionine that are converted into active and functional substances by means of the enzyme alinasa, 13 which can form silanol groups, which in previous studies have been found that they promote the growth of hydroxyapatite when in contact with the simulated physiological fluid. 14 In the same way, phenolic compounds are formed such as flavonoids, saponins, tannins, thiosulfinatos, anthraquinones, and isoflavones that have high antioxidant activity and are characterized as being biologically active for acting as chelators agents. 15
The Allium cepa poses several bioactive compounds such as quercetin and campherol that are natural antioxidant flavonoids. 16 Quercetin is the main flavonoid due to its content of hydroxyl groups that determine the activity of the biological compound since it helps to the formation of connective tissue fibers called collagen and elastin as well as the ability to synthesize and phagocytose collagen and the components of the extracellular matrix in processes of connective tissue remodeling. 17 The main derivatives of quercetin are glycosides and ethers. For the most part, flavonoid structures contain alkyl in their molecules, making them a much more stable compound, which helps to protect the tissues against the damage by oxidative stress. 18 Saponins help the cells regeneration by reducing free radicals and the creation of complexes with extracellular proteins in tissues such as the skin. 19 For these reasons, they have been used in treatments such as anti-hepatic fibrosis activities in vitro, 20 oxidative stress, atherosclerosis, 21 and the activation of fibrinollosis. 22 Fibroblasts have the potential to accelerate the healing of epithelial tissue, stimulate cell migration, and produce extracellular matrix in a similar way to osteoblasts. 23 In this work, it is intended to use flavonoids to help the mineralization of scaffolds by the production of a hydroxyapatite layer on their surface to aid tissue regeneration.
Materials and methods
Allium cepa extract
The Allium cepa was obtained from the region of Delicias Chihuahua, Mexico. It was lyophilized (FreeZone 25 plus) for 96 h. Later it was pulverized. Then 10 grams of the obtained powder were taken and 130 mL of concentrated methanol (J.T, Baker 100%) were added, the resulting solution was centrifuged at 3400 rpm (Velab centrifuges model Ve-4000) for 5 min. The resulting precipitates were removed by decantation, the decanted part containing the methanol extract was dried at room temperature until the methanol was completely evaporated and the final extract was obtained. 24
Synthesis of scaffolds
Different scaffolds were prepared: Chitosan (Ch), PLGA (P), Chitosan + PLGA (ChP), Chitosan + Allium cepa (ChAC) and Chitosan + Allium cepa + PLGA (ChPAC). A 2% polymer solution of PLGA 70:30 (Lactel Absorbable polymers) in concentrated acetic acid (J.T. Baker Analized) was used (0.35 g of PLGA and 21 mL of acetic acid). The solution was magnetically stirred for 2 h. Once dissolved, 0.25 g of 75% deacetylated chitosan (Sigma aldrich) was mixed with 12.5 mL of a 1% acetic acid solution, with a magnetic stirrer. Then, 15 mg of Allium cepa extract was added with continuous agitation, until obtaining a homogeneous mixture. Then, 5.3 mL of the PLGA solution (at 2% concentration) was added to 12.5 ml of the chitosan solution obtaining a concentration of 42% (V). Immediately, the resulting solution was stirred in ultrasound (Branson 3510) for 1 h 30 min at room temperature. Then, the solution was frozen with dry ice for 6 h, and then it was lyophilized for 72 h.
The lyophilized composites were immersed in absolute anhydrous ethanol (J.T. Baker) for 12 h at a temperature of −4°C. The ethanol was removed by decantation. Then, they were immersed in a 0.5% w/w NaOH (JT Baker) solution for 12 h at −4°C. Subsequently, the NaOH solution was removed and samples were allowed to dry. To cross-link the samples, a solution of genipin (98% CBC) 10 millimolar was prepared using concentrated ethanol, which was added to the composites for 10 min and five times rinsed with ethanol. 25 The pH of the rinse water was measured to ensure NaOH removal and final neutralization. Finally, samples were lyophilized for 12 h.
In vitro bioactivity
To evaluate the apatite mineralization capacity of the scaffolds, a simulated body fluid (SBF) containing 1.5 times the concentration of ions in human blood plasma was used. This solution was prepared according to the methodology described by Oliveira et al. 26 Samples of 0.5 cm × 0.5 cm were immersed in 5 mL of SBF (pH of 7.4) in an incubator at 37°C during a period of 7, 14, 21, and 28 days. The SBF fluid was weekly changed in all samples. At the end of each period, the samples were rinsed with deionized water and dried. Three samples were made for each condition.
Characterization
The scaffolds morphology was analyzed using a Scanning Electron Microscope (SEM JEOL JSM-7000F). An energy dispersion system EDS 7557 INCA Oxford Instruments was used to analyze the dispersion and distribution of apatite particles and to detect the concentration of calcium and phosphorus in the surface after being exposed to the SBF during different periods of time, determining the Ca/P ratio. The average pore size was measured using the Scandium Universal SEM Imaging Platform software. At least 300 pores per sample were measured. The chemical characterization was performed by FTIR (Nicolet 6700, Thermo Scientific, USA). All spectra were recorded using 100 scans and 16 cm−1 resolution. All the samples were scanned within the range of 550–4000 cm−1.
Results and discussion
Figure 1(a)–(e) shows the obtained morphology of the prepared scaffolds where a porous structure is observed in all materials. Figure 1(a) and (d) show similar pore sizes 101 ± 40 and 106 ± 48 μm respectively, (see Table 1). No significant differences were found. Although there are not reported results of this type of material, studies were found where the pore size of chitosan increases with the addition of Mimosa tenuiflora extract and ascorbic acid. 27 By the addition of PLGA to chitosan (Figure 1(c)), the pore size decreases to 63 ± 17 μm. This addition causes the structure of the chitosan to close, giving it a better mechanical resistance but maintaining porosity and interconnected tunnels. Similar results have been reported where the PLGA pore is 47 ± 10 μm. When glycolic acid is added to the PLGA, the pores increase to 88 ± 43 μm and a loss of bioactivity occurs but there is a notable improvement in the properties of the bone tissue.27,28

SEM images of scaffolds: (a) Ch, (b) P, (c) ChP, (d) ChAC, and (e) ChPAC.
Average pore size and porosity distribution of the different scaffolds.

With the objective to improve the bioactivity, the Allium cepa extract was added to the mixture of chitosan with PLGA. Figure 1(e) shows how the pore size average increases in the ChPAC scaffold compared to that of ChP of 63 ± 17 at 68 ± 16 μm, maintaining the scaffold structure that contains interconnected pores with a diameter smaller than 100 μm. These pore size average values have been reported as ideal sizes to work in bone engineering 29 which can induce a better formation of hydroxyapatite on the surface of ChPAC scaffolds compared to the rest of the prepared scaffolds. Table 1 shows the pore size average and pore size distribution, where it is observed that the highest pore size distribution percentage corresponds to pores of 50 and 100 μm. Minimum and maximum pore size values were 7 and 200 μm, respectively. Tissue engineering studies have been reported pores of 100 μm that result in rapid penetration of vascular connective tissue, while pores smaller than 100 μm impede significantly the internal growth of soft tissues. 30 However, there is great controversy in the size of the optimal pores for the activity of osteoblasts in tissue engineering scaffolds, because it depends on the type of material and manufacturing conditions. 31
Figure 2 (a–e) shows the scaffolds surfaces obtained after their exposure in the SBF solution during 7, 14, 21, and 28 days. It is observed that after the first week, there is apatite crystals formation. Precipitated particles can be seen on the surfaces of the different scaffolds. According to the SEM image, these precipitates cover more samples surface within the pass of the time. In Figures 2(a) and 2(c), the formation of crystals is attributed to the salts contained in the SBF solution, due to the ability of the chitosan to contribute to this growth. Deposition of the apatite layer in the scaffolds can be attributed to the presence of deprotonated and negatively charged carboxyl groups (−COOH), 14 which can cause electrostatic attraction of Ca+2 ions from the SBF, as an initial step for the nucleation that is completed with PO4−3 ions, which leads to spontaneous growth and transformation into apatite crystals similar to the natural bones growth through the consumption of Ca+2, PO4−3, OH−, and CO3−2 ions from the SBF solution. 32 However, the presence of the crystals at the sample surface, according to SEM images, is less evident after 7, 14, and 21 days in the ChP scaffold (Figure 2(c)) concerning that of Ch scaffolds (Figure 2(a)). This is because the PLGA has low surface bioactivity during the first weeks (Figure 2(b)), so when mixed with chitosan slows down this mineralization process. Similar results have been reported when PLGA is added to calcium silicate and bioactive glass.33,34 It was found that the bioactivity is lost, but it helped to obtain better mechanical resistance.

SEM Mineralization of apatite in vitro in 7 (1), 14 (2), 21(3), and 28(4) days in SBF. (a) Ch, (b) P, (c) ChP, (d) ChAC, and (e) ChPAC.
When the extract of Allium cepa is added to the Ch (Figure 2((d) 1–4)) and ChP scaffolds (Figure 2((e)1–4)) the bioactivity increases, and therefore a greater amount of crystals is seen on their surface. After 21 days, the scaffolds surface is completely covered, showing apatite layers overlapped. This may be due to the addition of hydroxyl and carboxyl groups provided by Allium cepa,35,36 presenting an interaction of the amino groups of chitosan with the functional groups of Allium cepa. Similar behavior was reported in studies using Mimosa tenuiflora and starch where the increase in the carboxyl groups made the surfaces of the scaffolds more bioactive. 31 This indicates that the extract of Allium cepa helps to improve the bioactivity of the material. On the other hand, elements such as silicon, aluminum, sulfur, potassium, and chlorine were found by Allium cepa extract EDS analysis which can also intervene in the mechanism of apatite formation (see Figures 3 and 4).

EDS energy dispersion analysis of Allium cepa extract.

A scheme of the mechanism of apatite formation. Calcium and phosphate ions contained in the SBF solution begin to form prenucleation crystals, these iones and prenucleation crystals are attracted to the polar surface groups of the scaffolds, depositing biological apatite on the surface.
Previous studies have shown that the silanol (Si–OH) radicals and organosulfur compounds help to have a surface susceptible to the nucleation and growth of calcium phosphate in the presence of simulated body fluid. Their polar groups increase the affinity of the silicate ions, which provide specific sites for the apatite nucleation, simultaneously joining the calcium and phosphate ions, which leads to an accumulation of the ions on the surface, inducing the formation of apatite or precursors of it (Figure 4). 37 The same mechanism is proposed for this work, where the compounds that form the sulfur and chlorine contained in the simulated fluid, form the polar groups on the scaffold surface and attract the ions of Al and Si contained in the Allium cepa, producing Si–OH and Al–OH groups with a negative charge by dissociation. These groups interact with the calcium ions of the fluid and due to their accumulation acquire positive charge, 38 so they attract electrostatically the phosphate ions negatively charged in the SBF, achieving the formation of apatite nuclei which grow spontaneously by consuming the calcium and phosphate ions of SBF. 39 Therefore, when combining the extract of Allium cepa with chitosan and PLGA, a bioactive material is obtained to be used in tissue engineering, because the synthetic polymer provides mechanical resistance to chitosan with the disadvantage of lowering bioactivity. However, when adding the extract of Allium cepa, the bioactivity is increased with a Ca/P ratio for the ChAC and ChPAC scaffolds between 1.6 and 1.7 which are very close values to that of the real bone of 1.67. 40 The rest of the scaffolds also showed values very close to 1.67 (Table 2). The radicals combination that forms silicon and sulfur is sufficient to form the first layer of the hydroxyapatite phase, due to the Ca/P ratio that was obtained for the two scaffolds containing Allium cepa after 7 days of immersion in SBF. The secondary phase occurred due to the calcium and phosphate ions consumption from the medium to reach the biological hydroxyapatite as reported by several authors.
Ca/P atomic ratio of the surface of HA after soaking time in SBF.

Figure 5 shows the EDS obtained for the ChAC and ChPAC scaffolds in the first and last week, where calcium and phosphorus are identified. The presence of these elements is related to the formation of calcium phosphate phases. 35 There are also elements such as carbon, oxygen, sodium, aluminum, chlorine, and magnesium, which are part of SBF preparation. As it is well known, Martel et al., not only the calcium ions promote the apatite formation but also other elements such as chlorine, silicon, aluminum, and sulfur in the system are consumed forming carbonated apatite that enhances the rapid formation of the biological apatite evidenced by the Ca/P ratio (previously mentioned) obtained in the scaffolds. 22

Analysis by dispersion of energy (EDS) in a time of 7 and 28 days: (a) ChAC and (b) ChPAC.
In previous studies, it has been reported that during the process of formation of apatite layers on the surface of scaffolds containing large amounts of Ca and P, Ca can be replaced by OH, CO3−2, Na+, K+, and Mg+2 ions of the solution, obtaining biological apatite. 41 In this work, the obtained Ca/P values (from 1.6 to 1.67) on the surface of the scaffolds are very close to the real bone Ca/P ratio, so it is considered that the Allium cepa and PLGA combined with chitosan make it a good alternative to manufacture scaffolds for use in tissue engineering.
The FTIR spectra of the obtained scaffolds are shown in Figure 6. The characteristic bands of chitosan are observed at 1665 cm−1 (stretch of C=O), 1587 cm−1 (NH flexion), 1379 and 1433 cm−1 (flexion of COOH), 1157 cm−1 (CO bonds), and 1030 cm−1 (COC stretch). 40 While for the PLGA, there is a stretching of the COC band at 1175 cm−1, the CH bands are present at 1390 and 1440 cm−1 and at 1760 cm−1 the band C=O is found. 41 When PLGA is added to Chitosan, it is observed that the intensity of the COOH and NH bands decreases, but the bands increase when the Allium cepa is added, due to the interaction between groups. The characteristic bands of the extract are in 1740 cm−1 representing the stretching of ester groups, while the stretching of the phenyl groups is found at 1618 cm−1. The asymmetric deformation of CH3 is found in the vibration of 1405 cm−1. At 1339 cm−1 the C–O stretching combined with the stretching of the phenyl ring is assigned. A secondary band is present at 1255 cm−1 assigned to amide III. The region between 1200 and 950 cm−1 contains functional groups of carbohydrates. The bands at 1025 and 985 cm−1 are assigned to the vibration frequency of CH2OH and CH3O respectively. The 925 and 868 cm−1 bands are assigned to the DNA structure of the Allium cepa. 42

FTIR of the scaffolds obtained prior to the contact of SBF.
Figure 7 shows the FTIR spectra of the scaffolds after immersion in the SBF during a time of 7, 14, 21, and 28 days. Analyzing ChAC and ChPAC scaffolds, the presence of PO4−3 and CO3−2 groups can be observed from the first to the fourth week (Figure 7(a)) on both scaffolds, 43 where the formation of phosphate and carbonate crystals is favored. These results support the capacity for biomineralization observed by SEM where it was observed that the surface is completely covered with calcium phosphate crystals after 21 days. The band present at 936 cm−1 is related to the symmetric stretching vibrations of PO4−3 and the peaks at 1020 and 1081 cm−1 are attributed to the asymmetric stretching vibrations of PO4−3. 31 Also, the characteristic bands of CO3−2 were observed at 1453 cm−1, which are due to the elongation of C–O by the substitution of carbonate ions in the structure of apatite. 39 Some authors reports showed similar results where the intensity of the peaks appearing at 1060 and 1100 cm−1 is attributed to the Si–O–Si stretching vibration, 40 which after a prolonged time in contact with SBF serve as apatite promoters, which grows in successive layers and completely covers the surfaces of the samples. The peak at 950 cm−1 is characteristic of the Si–OH stretch vibration of the silica phase, 40 this decrease with the immersion time in SBF, as the biological apatite is formed. The PLGA scaffold shows the same hydroxyapatite characteristics band. Only, in the third week, the PO4–3 group band increases. This is in agreement with the SEM images, where the low capacity of the PLGA for bioactivity is observed. The behavior of chitosan remains constant from the first week since the representative bands of PO4−3 and CO3−2 groups can be seen. They present only a slight increase in intensity in the third week. In the ChP sample infrared spectrum, it is observed that the intensity of the bands of the phosphate and carbonate groups in the first week decreases concerning the spectrum of chitosan alone, but this increases in the second and fourth week, which coincides with the SEM images obtained. Regarding to the ChAC scaffolding, it can be observed that in the second and fourth week, the bands of the groups PO4−3 and CO3−2 are intensified, which could indicate that the extract of Allium cepa helps the chitosan to the apatite formation. In the same way, when comparing the ChPAC supports with ChP and ChAC, it is observed that the most favored scaffold in all exposure times was the ChPAC, showing a greater intensity in the carbonate and phosphate peaks, which could indicate that a better formation of the apatite layer on its surface. According to the scaffolds pore size and the apatite’s formation SEM images, the intensity of the group’s characteristic bands of CO3−2 and PO4−3 increases gradually with the SBF exposure days. The presence of carbonated calcium phosphate phases (due to the possible substitution of the CO3−2 groups by the PO4−3 groups) allowed better mineralization results throughout the exposure time of the materials containing Allium cepa with PLGA.
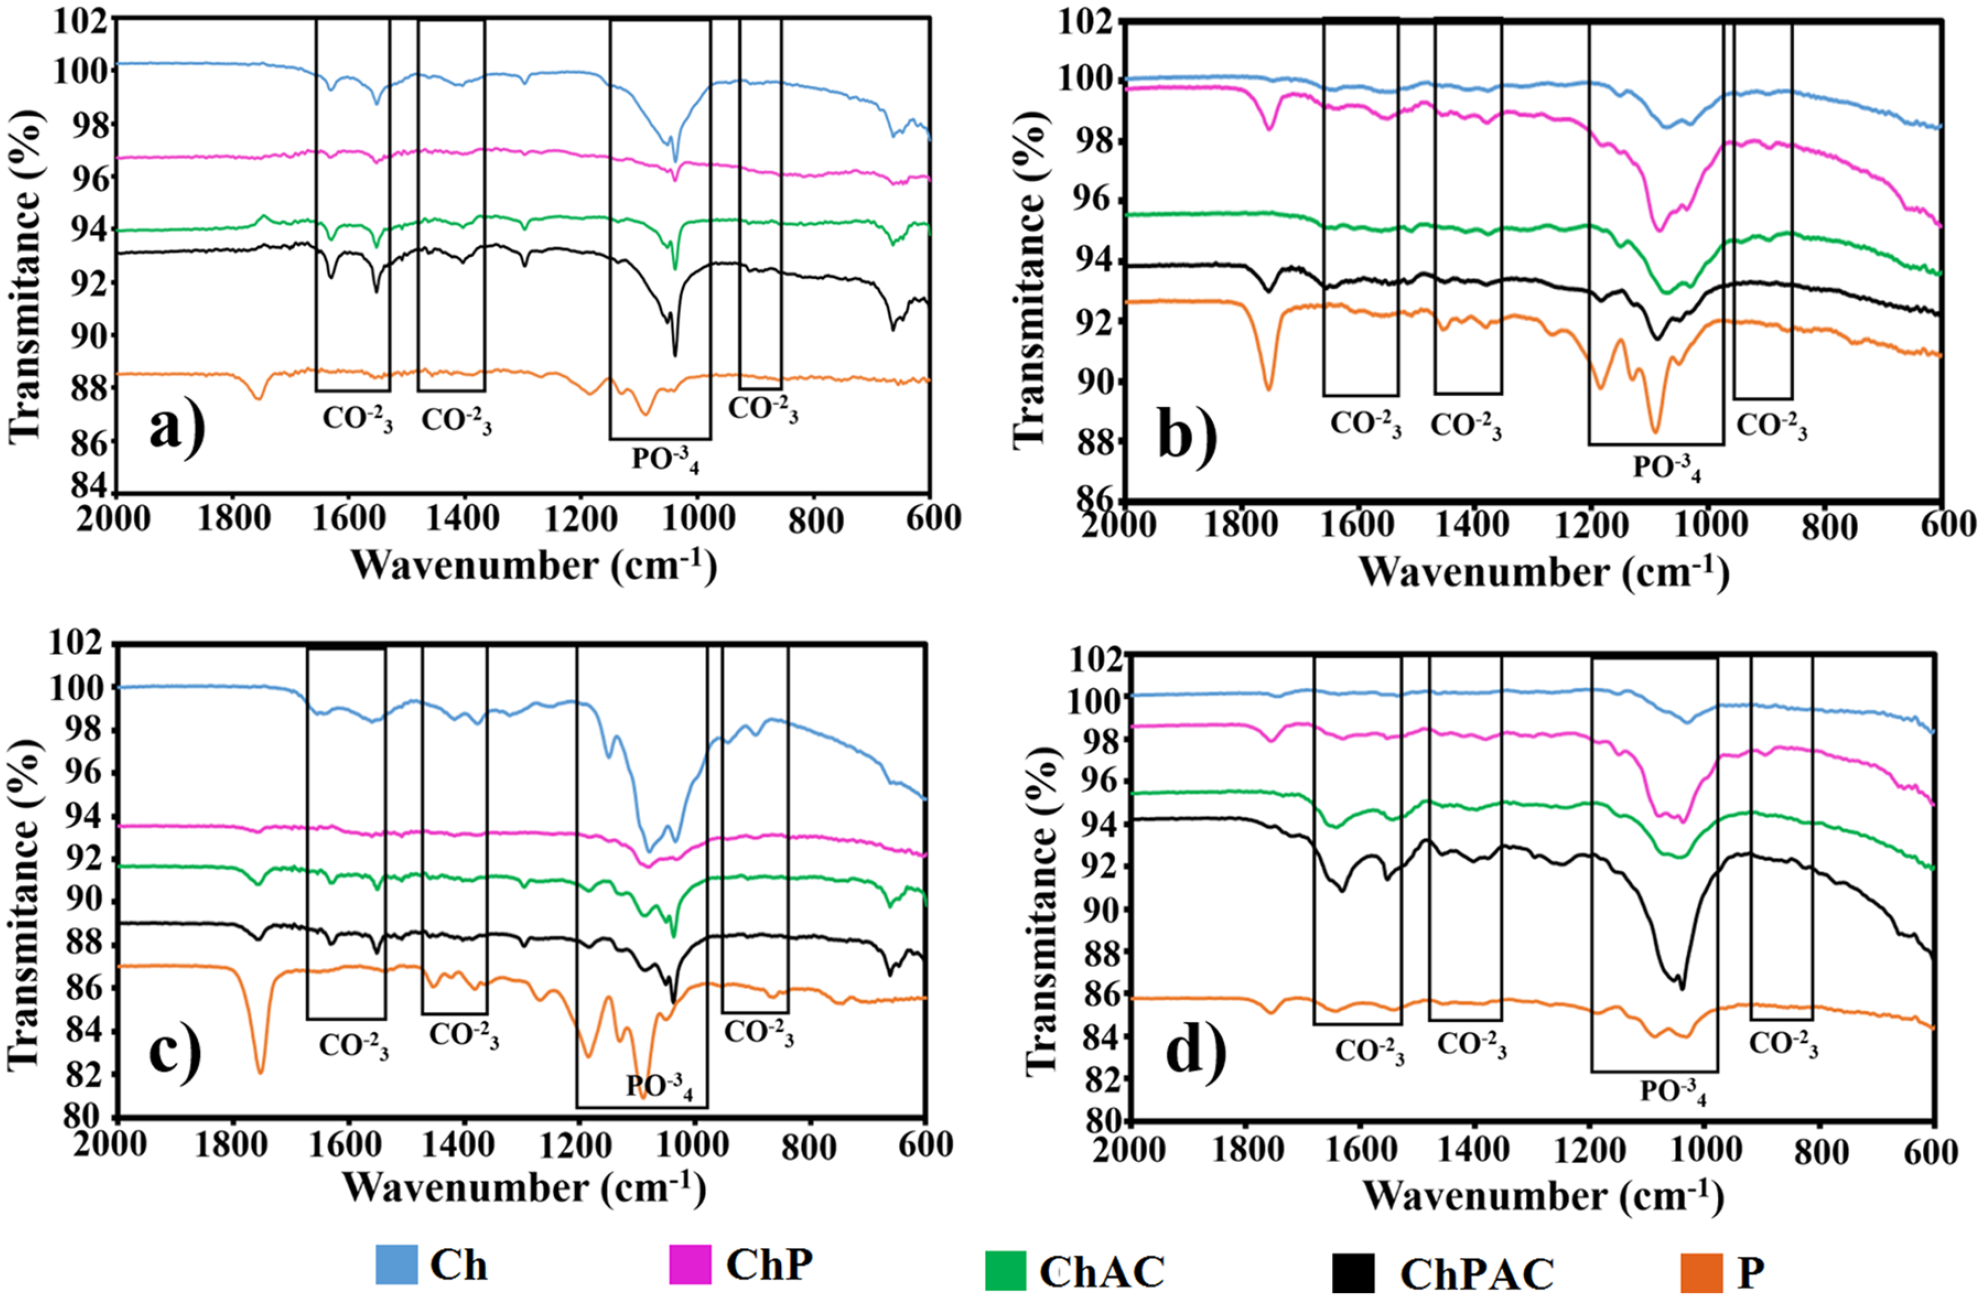
FTIR of the scaffolds after 7 (a), 14 (b), 21 (c), and 28 (d) in contact with SBF.
Conclusion
Three-dimensional scaffolds base chitosan/PLGA/Allium cepa extract with porous morphology were successfully synthesized. It was demonstrated that the combination of chitosan, PLGA with Allium cepa extract promotes the nucleation of the amino and carboxyl groups, accelerating the process by silane groups to form a uniform layer of phosphate crystals and carbonates, on the surface. The P/Ca ratio was very close to that of the real bone in all the scaffolds where the Allium cepa was used, which indicates that the extract of Allium cepa improves the property of natural bioactivity of chitosan, which makes the ChPAC and ChAC support promising candidates for being used in tissue engineering.
Footnotes
Declaration of conflicting interests
The author(s) declared no potential conflicts of interest with respect to the research, authorship, and/or publication of this article.
Funding
The author(s) disclosed receipt of the following financial support for the research, authorship, and/or publication of this article: The authors acknowledge the financial support of the Mexican Public Education Secretary (SEP) through the Teacher Professional Development Program (PRODEP) and Technology (CONACyT) through project SEP-CONACyT CB 2015-01-252439.