
Abstract
Water permeability of textile vascular grafts has been considered as a key indicator for predicting blood permeability after implantation. However, a correlation between water and blood permeability has not been established yet. Therefore, even though the water permeability of a vascular graft can be tested according to the standard ISO 7198, the results fail to guide a manufacturer or a surgeon to judge whether this vascular graft needs pre-clotting or not prior to implantation. As a result, all commercial graft products show almost zero water permeability, which leads to the loss of advantages that textile vascular grafts have the pore size-controlled porous wall. To solve this problem, four types of woven vascular grafts were designed and manufactured in the present work. Then their permeability to water, simulated plasma, and anticoagulated whole blood were measured at graded pressures from 8 to 16 kPa. Moreover, the correlations among the water permeability, the simulated plasma permeability, and the anticoagulated whole blood permeability were established. The results suggest that relatively steady correlations exist between the water permeability and the anticoagulated whole blood permeability, and that the evaluation of the blood permeability using the water permeability is feasible and objective. The present work provides a quantitative method for evaluating the blood permeability using the water permeability, and the latter is thus endowed with practical significance for guiding designs and clinical pre-clotting operations of textiles vascular grafts.
Introduction
Early attempts to replace pathological arteries with solid tubes often experienced immediate occlusion, which led to rapid abandonment of such endeavors. 1 One major challenge is that the wall of solid tubes lacks cell ingrowth channels for transmural vascularization and does not support the regeneration of new endothelium on the luminal surface,2,3 while they are crucial for long-term patency of a vascular graft.4,5 Moreover, the solid wall is not beneficial for the internal and external mass exchange of vascular graft walls. 6 Therefore, porous prostheses, such as textile vascular grafts, were then considered favorable to form a new endothelium, to facilitate an appropriate vascularization7–9 and a long-term patency. 10 In particular, a complete regenerated endothelium has been widely seen as an ideal strategy to guarantee a long-term patency of a vascular graft.11,12
While recognizing porous vascular grafts as a promising candidate for pathological artery substitutes, the potential risk of blood leakage raises the concerns, especially if the pores cannot be controlled appropriately. One way to avoid blood leakage is to pre-clot the vascular graft prior to implantation. 5 In order to identify a balance point between the blood leakage and the mass exchange, a concept of water permeability was established by the international standard ISO 7198. 13 It refers to the amount of water going through 1 cm2 of wall area during 1 min at 120 mmHg pressure. 14
However, the absolute value of the water permeability tested in a lab has limited meaning due to the lack of correlations between the water permeability and the blood permeability. In other words, even with the water permeability tested, it remains uncertain whether the vascular graft will leak blood or not, and whether it needs pre-clotting or not. As a result, the water permeability of current commercial textile vascular grafts has actually been set at almost zero to avoid possible blood leakage. As expected, this certainly leads to the loss of the advantages and original intention of porous vascular grafts.
In recognition, the present study aimed to establish indicative correlations among water permeability, simulated plasma permeability and anticoagulant whole blood permeability, and to explore the mechanisms by which the permeability is influenced, which could be used to better guide new designs of textile vascular grafts and determine more objective testing conditions. In this study, four types of woven vascular grafts were specifically designed and fabricated, and their water permeability, simulated plasma permeability and anticoagulant whole blood permeability were subsequently tested at graded pressures from 8 to 16 kPa. Furthermore, influences of the fluid type, weft counts and the testing pressures on the permeability were also investigated. Blood cells adhesion onto the flow surfaces of vascular grafts under varying testing pressures was extensively examined and analyzed via scanning electron microscopy (SEM). Taken together, the present study may pave a way to address the manufactural and clinical significance of the integral water permeability of textile vascular grafts.
Methods
Design and fabrication of woven vascular grafts
Biomedical grade PET monofilaments (30D) and multifilament yarns (50D/24f) (Suzhou Zhenwu Medical Sutures and Suture Needles Factory, Wujiang City, Jiangsu Province, China) were employed to weave 1/1 plain vascular grafts with 4 mm in diameter on a narrow ribbon shuttle loom developed by Donghua University. The mechanical properties of the PET filaments were shown in Table 1. The monofilaments were set in the direction of blood flow (warp) and the multifilament yarns were perpendicular to blood flow (weft).
Mechanical properties of the yarns.

The weft counts were adjusted from 300/10cm to 900/10cm while the warp count was kept constant to yield four types of vascular grafts (Table 2). Heat setting was utilized for structural stabilization at 120°C for 30 min on a stainless-steel mandrel.
Weaving parameters of textile vascular grafts.

Pore characteristics of the vascular grafts
All the vascular grafts were respectively examined by a benchtop scanning electron microscope (Hitachi TM3000, Hitachi, Tokyo, Japan) and a light microscope (model E200-F, Nikon, Tokyo, Japan). The distribution of pores and pore sizes were calculated and analyzed based on SEM micrographs. The pore size was expressed as the diameter of an equivalent circle. 15 The porosity was calculated by the equation (1) as follows: 16

where P (%) is porosity, M is the weight of the graft per m2 (g/m2), t is the thickness of the wall (mm), ρ is the density of PET (g/cm3).
Mechanical properties of the vascular grafts
Probe burst strengths, circumferential tensile strengths, and suture retention forces were tested on a versatile mechanical tester (Model YG-B 026H, Wenzhou Darong Textile Instruments Co., Ltd., Wenzhou, Zhejiang Province, China) according to the standard ISO 7198: 2016 (Figure 1) (n = 3).
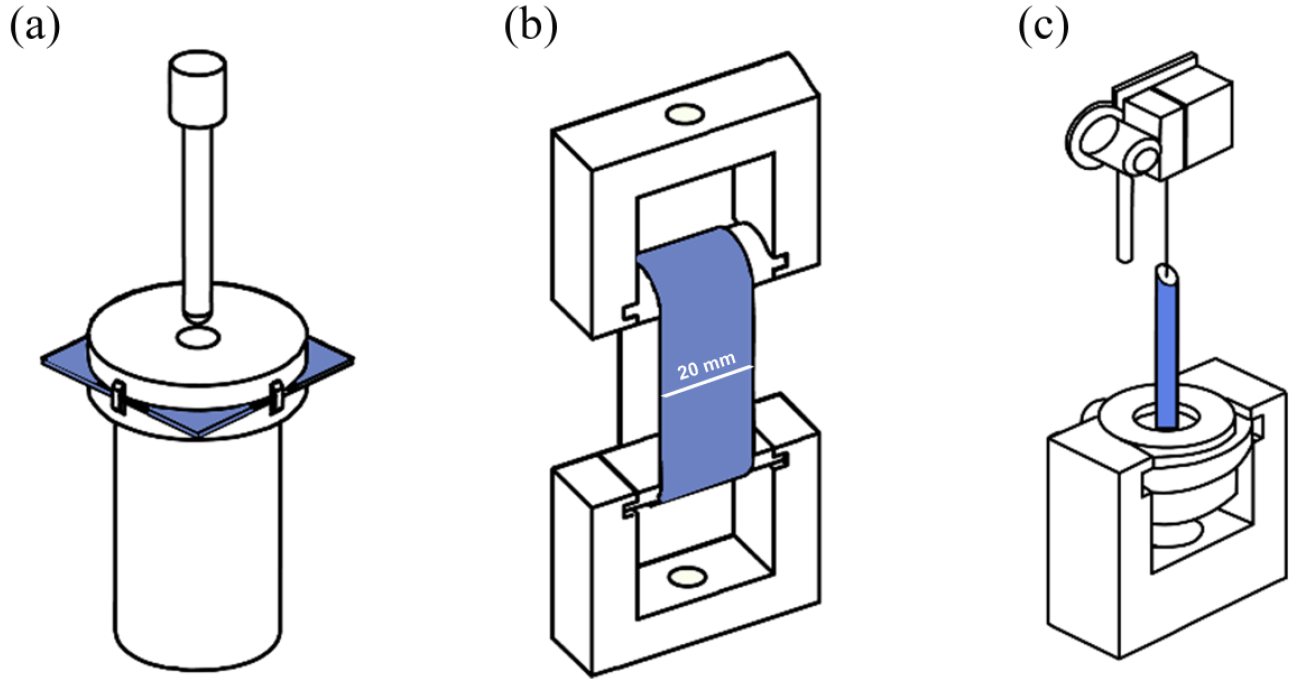
Schematic drawings of testing setups for mechanical properties: (a) probe burst strengths, (b) circumferential tensile strengths, and (c) suture retention forces.
The probe burst strength was determined by a probe with a diameter of 1.5 mm. The displacement rate of the probe was set as 50 mm/min. The probe burst strength was calculated by the equation (2):

where S is the probe burst strength (N/mm2), F is the force at the breaking (N), r is the radius of the probe (mm).
The length of samples for the circumferential tensile strength was 20 mm. The displacement rate was set as 100 mm/min. The circumferential tensile strengths were calculated by the following equation (3):

where F is the force at the breaking (N), L is the length of the sample (mm).
The suture retention force was measured with a 2-0 braided polyester suture (Jinhuan Medical Supplies Co. Ltd, Shanghai, China). The suture passed through the wall of each graft at 2 mm away from the edge. The suture was then pulled up at a speed of 50 mm/min until it detached from the graft.
Fluid permeability of the vascular grafts
The fluids employed to measure the permeability of the vascular grafts included water, simulated plasma and anticoagulated whole blood. The permeability was tested at graded pressures from 8 kPa (60 mmHg) to 16 kPa (120 mmHg) on a specifically designed equipment. 17 The water permeability was measured with distilled water at room temperature. Dextran 40 sodium Hospira chloride injection (Hospira Inc., Lake Forest IL, USA) was selected as the simulated plasma. Fresh whole blood was collected from healthy swine in anticoagulated bags containing heparin for the blood permeability tests. 18 Then consecutive 60-s tests for each sample were conducted in triplicate (n = 3). The permeability of the vascular grafts was calculated by the equation (4) according to the standard ISO 7198: 2016:

where W is the permeability (mL/cm2·min), Q is the volume of the fluid passing through the wall of the vascular graft (mL), A is the working area of the wall of the vascular graft (cm2), t is the testing time (min).
Blood cells adhesion on the flow surface following the blood permeability tests
Since the number of blood cells was influenced by the volume of blood that flowed through the graft, the volume of blood that flowed through the graft was controlled and kept constant by the consistent testing time, continuous ten 60-s time intervals. Each sample was observed under three distinct views with the same magnification, and at least five sites were selected for counting the blood cells for each microscopic view. The counting area is about 230 μm × 170 μm. Each sample tested with the anticoagulated whole blood was observed by SEM (Hitachi TM3000). The vascular grafts were first fixed in 4% (v/v) paraformaldehyde aqueous solution at 4°C for 24 h. Then it was dehydrated by ethanol solutions of graded concentrations until absolute ethanol. After air drying, the samples were sputter-coated with gold to guarantee the conductivity. The flow surfaces of the grafts were observed under SEM (Hitachi TM3000) at a 15 kV accelerating voltage.
Statistical analysis
For all the experiments, the number of replicates was more than three (n ⩾ 3). All data were expressed as x̄ ± SD (standard deviation), and significant differences were analyzed using unpaired student t tests. A difference was considered significant when p < 0.05 and extremely significant when p < 0.01.
Results
Morphology of the textile vascular grafts
Four vascular grafts were woven in a straight fashion. Micrographs of four samples showed regular structure and uniform pore size (Figure 2). The average pore size and porosity decreased with the increase of the weft counts (Figure 2, Table 3). Sample S1 with the lowest weft count showed the average pore size of 106.1 μm with a porosity 67.6% ± 0.8%; minimum and maximum pore sizes reached 74.07 and 118.52 μm, respectively. In contrast, S4 with the highest weft count had the lowest pore size of 21.8 μm and porosity of 48.5% ± 0.5%, and the minimum and maximum pore sizes reached 19.0 and 29.2 μm, respectively. To be noted, the maximum pore size of S4 was much lower than the minimum pore size of S1.

Stereomicroscopic (A, B, C, D) and SEM micrographs (a, b, c, d) of S1 (A, a), S2 (B, b), S3 (C, c), S4 (D, d). Black arrows indicate the pores.
Pore sizes and porosity of the textile vascular grafts.

Mechanical properties of the textile vascular grafts
The mechanical properties of these vascular grafts, including the probe burst strengths, the circumferential tensile strengths and the suture retention forces, were shown in Figure 3. Compared to S1, the probe burst strengths of the S2, S3, and S4 were significantly higher (p < 0.01, Figure 3(a)), suggesting that the weft count plays a crucial role in adjusting the mechanical properties. Whilst, the probe burst strengths of the S2, S3, and S4 did not show distinct differences. As to the circumferential tensile strengths, the S4 obtained the highest while the S1 was the lowest (p < 0.01, Figure 3(b)). The circumferential tensile strengths of the S2 and S3 did not show remarkable differences but they were higher than that of the S1 (p < 0.05). The influence of the weft count on the suture retention forces was not as obvious as the probe burst strengths and the circumferential tensile strengths (Figure 3(c)). The suture retention force of the S4 was higher than those of the S1, S2, and S3 (p < 0.05), but no distinct differences were found among them.The mechanical properties of four vascular grafts were not lower than that of the commercial ePTFE vascular graft with medium diameters of Goretex®. The circumferential tensile strength and the suture retention force of the ePTFE vascular graft are 5.067 N/mm and 4.312 N, respectively.

The mechanical properties of the textile vascular grafts: (a) probe burst strengths, (b) circumferential tensile strengths, and (c) suture retention forces.
Permeability of the textile vascular grafts to water
The water permeability of each vascular graft under graded pressures from 8 to 16 kPa was recorded every minute, and the results were shown in Figure 4. Overall, the water permeability increased with the growth of the testing pressures but decreased gradually over time (Figure 4(a)), and decreased with the increase of the weft counts (Figure 4(b)).

The water permeability of S1 (a), S2 (b), S3 (c), and S4 (d) at graded pressure (A) and at 16 kPa (B).
For the same sample at the same testing pressure, volume differences existed due to the time-dependent phenomenon. The volume difference hereby is defined as the difference between the volume of the first minute and the volume of the last minute. It reflects the decline rate of the water permeability. It can be found that the volume differences increased with the testing pressure. The volume differences of S1, S2, S3, and S4 were respectively 4.85 mL·cm−2·min−1, 3.02 mL·cm−2·min−1, 2.31 mL·cm−2·min−1, and 1.61 mL·cm−2·min−1 at 8 kPa, while they were 23.26 mL·cm−2·min−1, 25.33 mL·cm−2·min−1, 24.42 mL·cm−2·min−1, and 19.56 mL·cm−2·min−1 at 16 kPa, respectively.
Permeability of the textile vascular grafts to the simulated plasma
The vascular grafts’ simulated plasma permeability showed a similar trend to the water permeability (Figure 5). They decreased over the testing time and with the increase of the weft counts, while increased with the testing pressures. Similarly, the volume difference between the first and last minute volumes under a higher pressure was also much higher than that under a lower pressure, suggesting that the simulated plasma permeability declined faster at a higher pressure than at a lower pressure.18,19
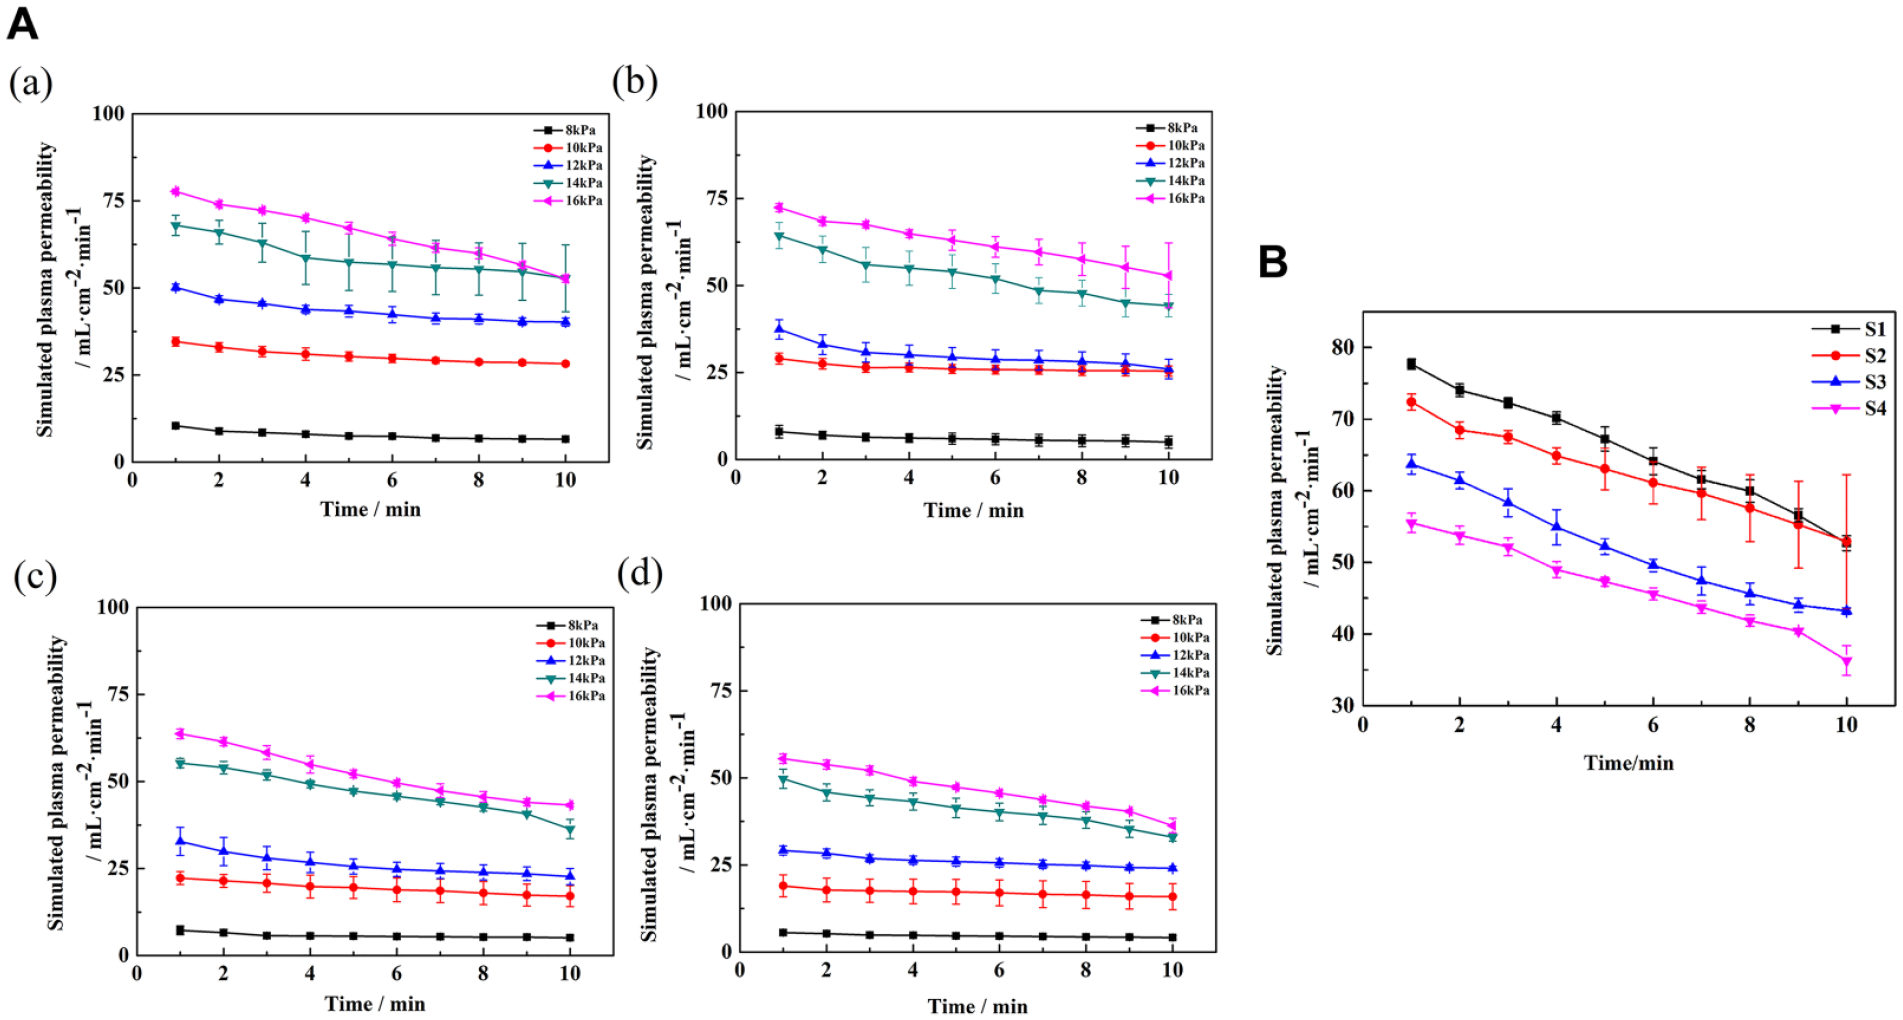
The simulated plasma permeability of S1 (a), S2 (b), S3 (c), and S4 (d) at graded pressure (A) and at 16 kPa (B).
However, compared to the water permeability, the simulated plasma permeability at the same pressure for the same sample was smaller, mainly from the high viscosity of the simulated plasma (1.1 mpa·s). These results are in accordance with previous reports that the lower permeability was related to the higher viscosity of the simulated plasma.20,21
Permeability of the textile vascular grafts to the anticoagulated whole blood
The permeability of textile vascular grafts to the anticoagulated whole blood was tested, and the results were shown in Figure 6. The permeability decreased over the testing time and with the growth of the weft counts (see the insets of Figure 6), however the volume differences between the first and the last minute were not as pronounced as those with the water or the simulated plasma and even at the high pressure. The reason might be that the anticoagulated blood permeability was significantly lower than those of the water and the simulated plasma. However, the volume differences at higher pressures were still more significant than those at lower pressures. The anticoagulated whole blood permeability of S1 and S2 were 15.11 mL·cm−2·min−1 and 7.75 mL·cm−2·min−1 at 16 kPa, respectively. While those of S3 and S4 fell to 0 mL·cm−2·min−1. Moreover, the differences of four samples’ permeability were not as obvious as the above with the increase of weft counts.

The anticoagulated whole blood permeability of S1 (a), S2 (b), S3 (c), and S4 (d) at graded pressure (A) and at 16 kPa (B).
Compared to water and the simulated plasma, the anticoagulated whole blood shows a much higher viscosity (4.2 mpa·s) due to the presence of additional components such as proteins and blood cells. 10 Therefore, the blockage to the pores by cells and pseudo-endothelium significantly contributes to the low permeability. To confirm this hypothesis, the textile vascular grafts tested with the anticoagulated whole blood were further examined and analyzed in the following part.
Correlations of the water permeability and the anticoagulated whole blood permeability
The correlations between the water permeability and the anticoagulated whole blood permeability were similarly observed with those of the simulated plasma and the anticoagulated whole blood (Figure 7, please refer to Supplemental Materials for the correlations between the simulated plasma and the anticoagulated whole blood permeability), since the viscosity of water is close to that of the simulated plasma. From the above results, it can be found that both viscosity and components can influence the permeability, and the complicated components may play a more crucial role in reducing the permeability.
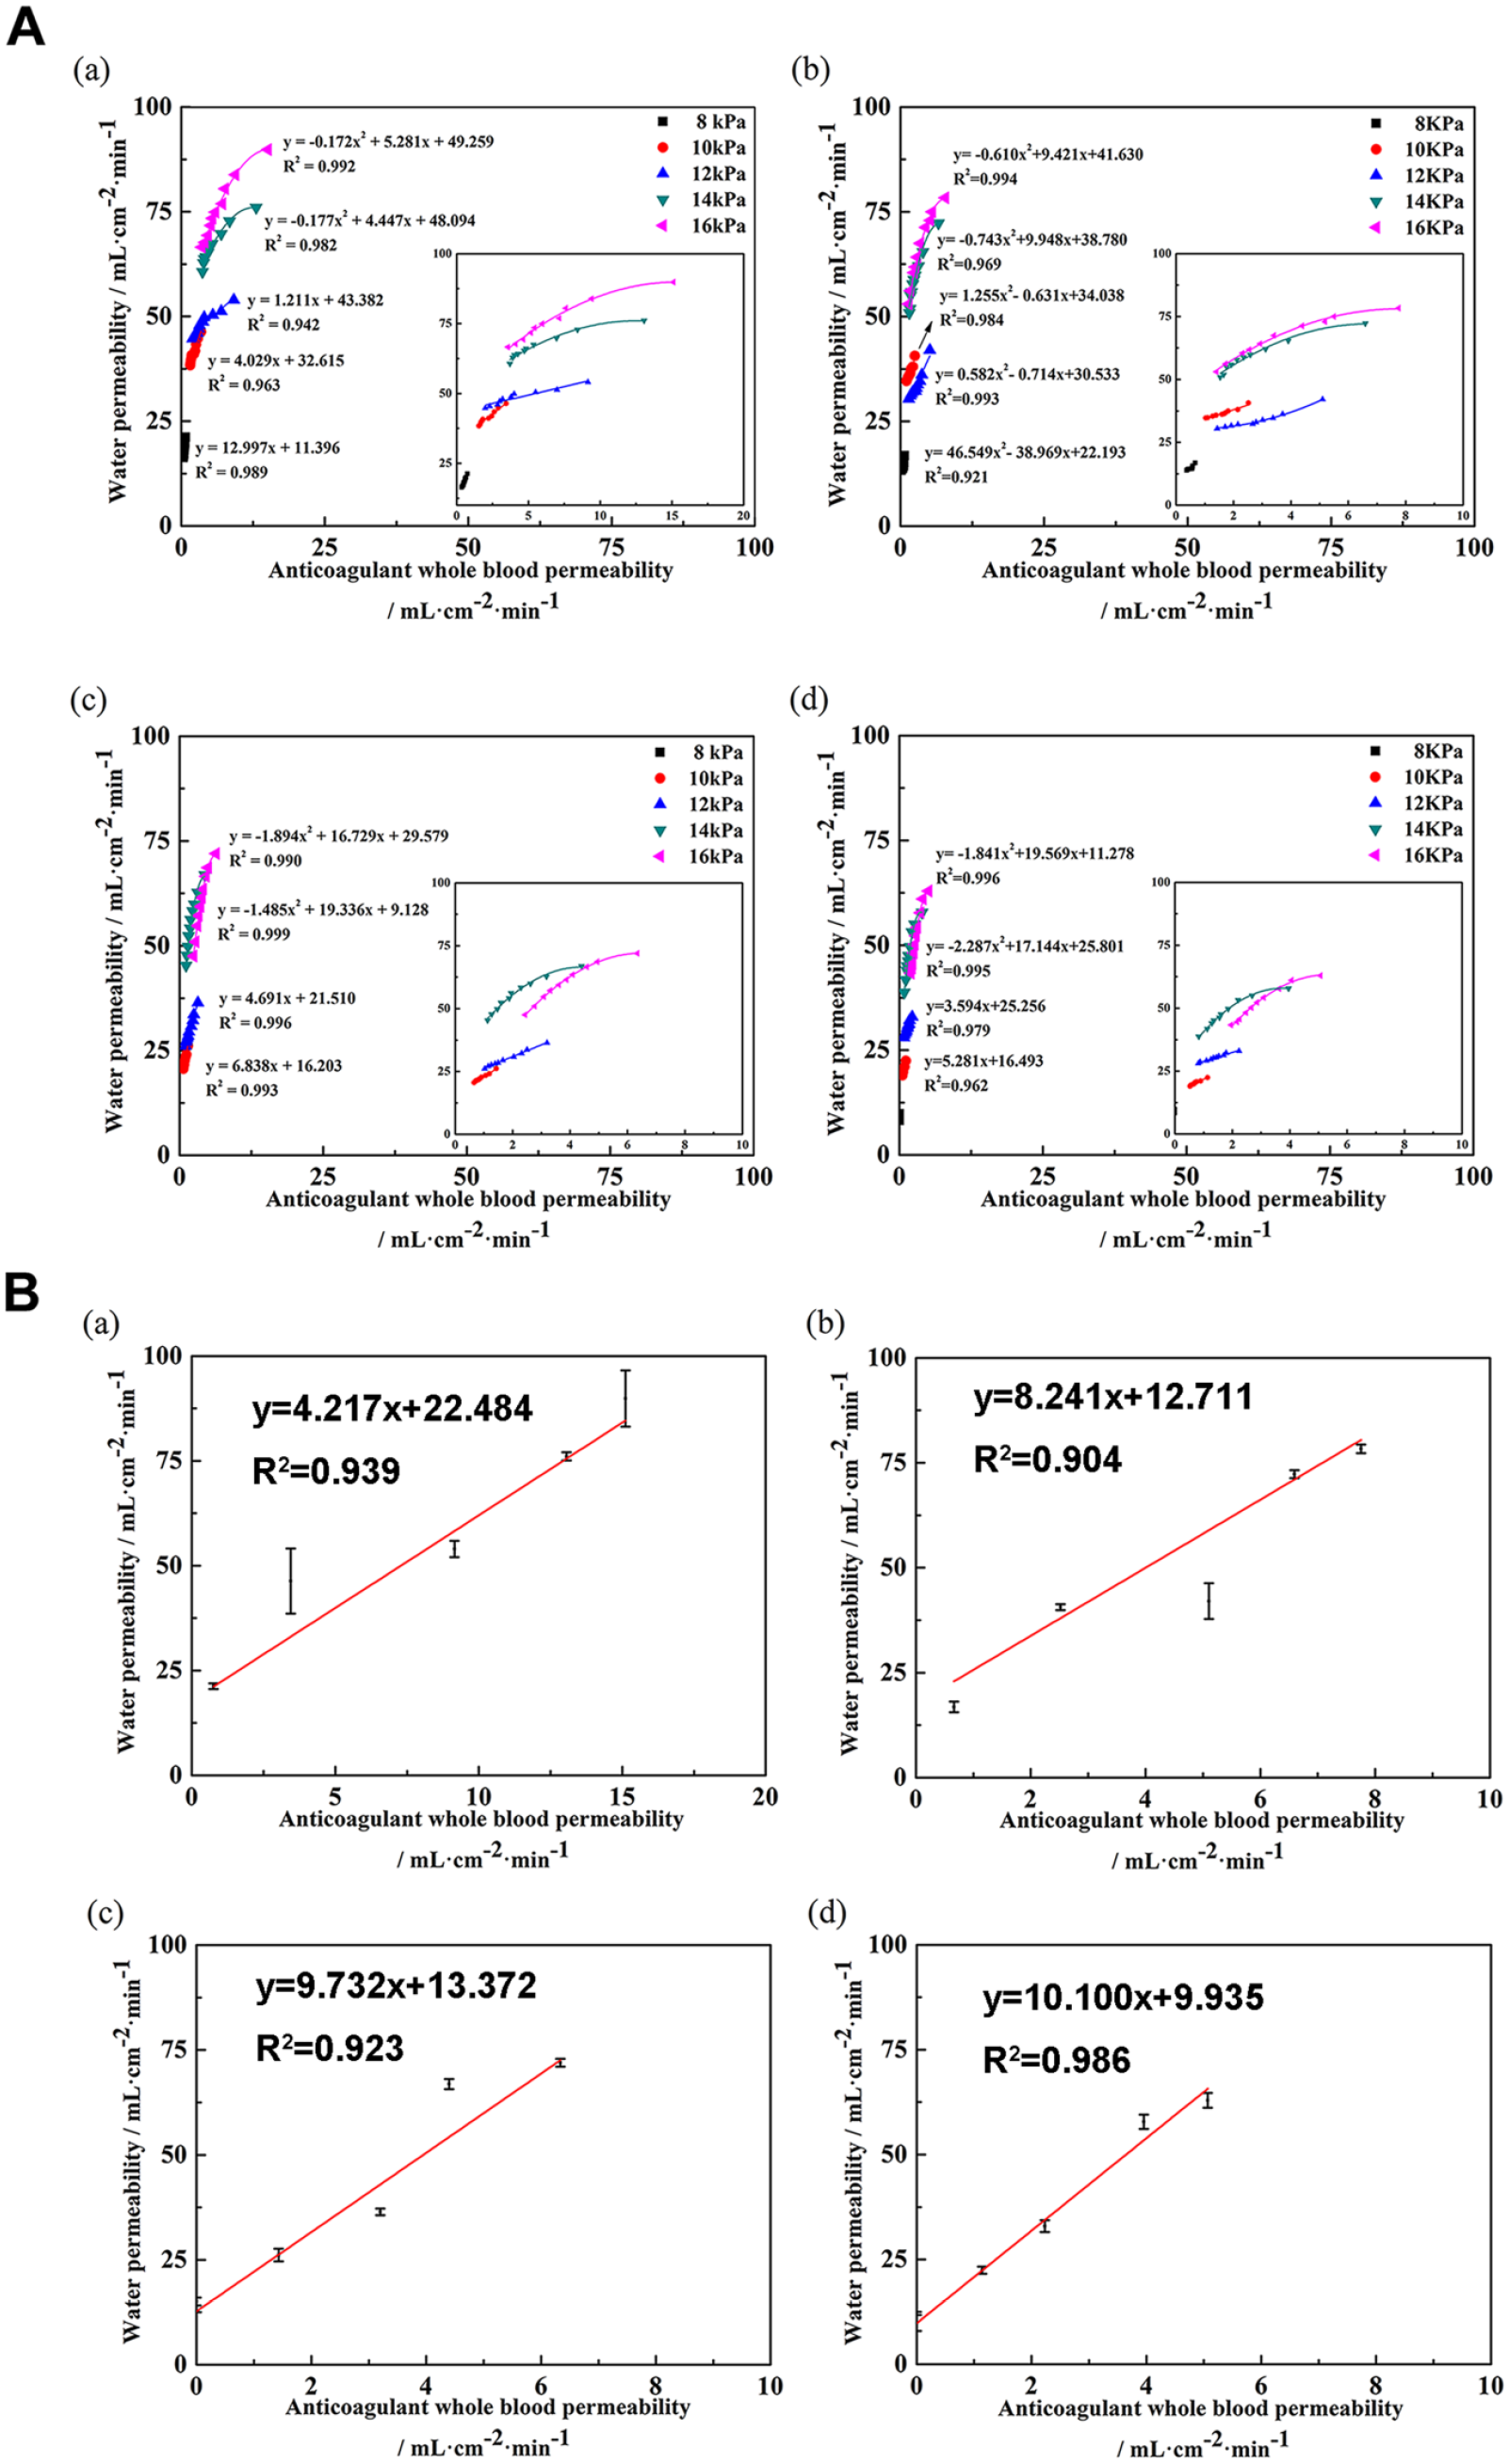
(A) Correlations between the water permeability and the anticoagulated whole blood permeability and (B) correlations of the first minute permeability at varying testing pressures: (a) S1, (b) S2, (c) S3, and (d) S4.
Blood cell adhesion on the luminal surfaces
As shown in Figure 8, the luminal surfaces of the vascular grafts held variable amounts of individual blood cells and clusters at the end of the blood permeability tests. The detained cell numbers varied from sample to sample and with the pressure. More cells were seen with high weft count and high pressure. Several scattered blood cells could be found on the luminal surface of S1 under 8 kPa, while large aggregates accumulated on the luminal surface of S4 under 16 kPa. The number of blood cells increased with pressure for each sample owing to the increase of the permeating volume. Moreover, the number increased with the increase of the weft counts (S1 < S2 < S3 < S4) at the same testing pressure.

SEM micrographs of the luminal surfaces of the vascular grafts after testing the anticoagulated whole blood permeability.
Besides, the blood cells tend to adhere more to the surfaces of the multifilament yarns that behave more like filters. When the pore size was smaller than the cell size, the cells were trapped. Furthermore, the amount of detained cells increased with the flow volume. With the detained cells and proteins, the pores were then blocked, and the permeability decreased with the testing time and the pressure. A sharp increase could be seen for S1 under 16 kPa compared to other testing pressures, and an abrupt increase was found for S4 under 14 kPa and 16 kPa due to the increase of the weft count (Figure 9). A higher weft count, which led to a smaller pore size and increased surface area, exhibited a more significant influence on blood cell adhesion under a higher testing pressure. The diameter of red blood cells is about 7 μm.

The numbers of blood cells adhered onto the luminal surfaces of the vascular grafts as a function of the weft counts (S1 < S2 < S3 < S4) (a) and of the testing pressures (b).
Discussion
Four types of woven vascular grafts with PET monofilaments as warp (blood flow direction) and multifilaments as weft were designed and fabricated in the present work. The selection of the fibers, the determination of both warp and weft counts, and the employment of the plain structure were proved reasonable, since gradient pore sizes and porosity were attained by adjusting the weft counts from 300/10 to 900/10 cm. This is an essential foundation for establishing these correlations. Furthermore, appropriate water, plasma, and blood permeability were attained, and the correlations among them have been established then through testing permeability of varying samples at graded pressures. Steady correlations exist between any two groups of them. Based on the correlations, the blood permeability can be well predicted by testing the water permeability, and thus the necessity of pre-clotting a vascular graft can be objectively evaluated.
To be noted, for the correlations of permeability among these fluids, only the correlations between the water and the simulated plasma permeability showed favorable linear ones. The correlations of permeability between the water and the whole blood did not show high linear correlations. In contrast, the correlations of the first-minute permeability for three fluids at varying testing pressures showed satisfactory linear correlations. The reason may be that the first-minute permeability is a function of the testing pressure that is the only single impact factor. No other influencing factors were involved in the process, such as the yarns rearrangement. Therefore, predicting blood permeability based on the first or the first several minutes’ water permeability might be possible and feasible.
The basic structure and weaving parameters were determined based upon the structural analyses to commercial woven vascular grafts. 22 However, the procedure was modified to form a gradient permeability and facilitate the creation of these correlations. Since the water permeability of the commercial textile vascular grafts is generally almost zero to avoid blood leakage,5,23 which is not beneficial to establish the correlations. So the warps hereby utilized the monofilaments and a constant count, while the wefts selected the multifilaments and graded weft counts. The results showed that these modifications were suitable and appropriate.
The prepared four vascular grafts showed comprehensively satisfying mechanical properties, and they could be anastomosed to the native blood vessels via suturing. Furthermore, the results of the tensile and the probe bursting tests showed their stable structure and robust durability, indicating that these structural modifications have not undermined their clinical applicability.
On the whole, the water, the simulated plasma, and the whole blood permeability of four samples showed typical weft count, testing pressure, and time-dependent characteristics. They decreased with the increase of the weft counts and over time, while increased with the increase of the testing pressures. The only difference for the same sample at the same testing pressure is that the simulated plasma permeability is less than the water permeability due to the high viscosity, and that the whole blood permeability is even less than the plasma permeability as a result of the higher viscosity and complicated components, such as proteins and blood cells. As mentioned before, viscosity plays a key role in influencing the permeability, while the blockage effects of proteins and cells may be more critical.18,24 This point has also been proved by the SEM results of the samples following the blood permeability tests (Figure 8).
On the declining trend over time, a possible hypothesis on the mechanism is that the liquid and the solid interfaces’ interactions experienced a phase change process at the beginning moment, namely from gas-solid, liquid-solid to liquid-liquid phase.20,25 The interaction force of the liquid-solid phase might be weaker than the liquid-liquid phase due to the hydrophobicity of PET materials. 26 Moreover, the liquid flow may rearrange the multifilaments to produce a number of small pores during the tests, 27 which may result in screen effect and the decrease of the permeability until reaching an equilibrium over time.
Fortunately, all the permeability profile curves are similar to the in vivo blood permeating process of textile vascular grafts following implantation. 28 The wall of any polyester prosthesis needs to be blood tight at the initial contact with blood. However, an open structure is necessary to permit the generation of an artery-like structure.29,30 Immediately following exposure to blood flow, the surface of the prosthesis becomes covered by blood proteins, platelets, red blood cells, and fibrin strands.31,32 Within a few hours, it culminates in a relatively thick layer of disorganized fibrin, entrapping red blood cells, and other blood elements. 33 Therefore, the results obtained in the present work matched well with the clinical clotting process, namely the permeability decreased over time.
Therefore, whether it is possible to judge the necessity of pre-clotting using the first-minute permeability (or the beginning several minutes permeability) instead of the average permeability of ten 60-s ones could be further discussed. 13 The former is generally larger than the latter, while it is more instructive for the judgment. The reason is that although blood leakage may occur at the beginning, the blood permeability would reduce sharply due to the pseudo-endothelium formation and the blockage effects of blood cells. 34 Thus, this vascular graft is still safe. More importantly, it retains the potential for transmural endothelialization, which is crucial for an implantable substitute. 9 Because the flow surface endothelialization will contribute to a long-term patency, 35 it can tolerate a low thrombotic threshold velocity.5,6 On the other hand, the water permeability is normally much higher than the blood permeability. Therefore, the current threshold value for pre-clotting a vascular graft can be enlarged further.
Although the testing pressures showed little influence on the correlations, it is still important to note that the blood pressure of the target blood vessel should be recommended as the most appropriate testing pressure for a specific vascular graft. Most textile vascular grafts for implantation tend to implant sites whose blood pressures are less than 16 kPa or 120 mmHg.1,3 If the testing pressure is fixed as 120 mmHg described in the standard ISO 7198, false-positive results may be obtained. In other words, when the permeability is tested, an inappropriate and higher testing pressure will be employed. Therefore, this probably happens that a vascular graft could have been employed for implantation, but the testing results showed that it could not, which is not beneficial for developing novel vascular grafts and not reasonable to their applications.
Conclusions
Textile vascular grafts have shown irreplaceable advantages clinically due to their regular and controllable structure, robust mechanical properties, and inter-connective pores. Their permeability thus can also be well controlled via adjusting the structures and the counts. However, the water permeability of current textile vascular graft products is too low due to fear of blood leakage, leading to the advantages of porous vascular prostheses not being fully utilized. Therefore, the present work aims to provide theoretical and experimental references for enlarging the water permeability to use their advantages as porous vascular grafts. Additionally, through the establishment of the water and the blood permeability correlations, it is expected that the blood permeability can be objectively predicted by testing the water permeability. Moreover, this study provides the guidance that the testing pressure should employ the target blood vessel’s blood pressure instead of 120 mmHg. The present findings showed that a steady correlation between the water and the blood permeability exists. Thus, evaluation of the blood permeability through testing the water permeability is feasible and reliable. The present work also gives the integral water permeability of textile vascular grafts practical significance, guiding a manufacturer or a surgeon to develop or select a more appropriate graft for a specific patient.
Supplemental Material
sj-pdf-1-jbf-10.1177_22808000211014007 – Supplemental material for Exploration into practical significance of integral water permeability of textile vascular grafts
Supplemental material, sj-pdf-1-jbf-10.1177_22808000211014007 for Exploration into practical significance of integral water permeability of textile vascular grafts by Guoping Guan, Chenglong Yu, Xuan Fang, Robert Guidoin, Martin W King, Hongjun Wang and Lu Wang in Journal of Applied Biomaterials & Functional Materials
Footnotes
Declaration of conflicting interests
The author(s) declared no potential conflicts of interest with respect to the research, authorship, and/or publication of this article.
Funding
The author(s) disclosed receipt of the following financial support for the research, authorship, and/or publication of this article: This study was supported by Fundamental Research Funds of Central Universities (No. 2232019G-06, No. 2232020G-01), “111 project” (BP0719035).
Supplemental material
Supplemental material for this article is available online.
References
Supplementary Material
Please find the following supplemental material available below.
For Open Access articles published under a Creative Commons License, all supplemental material carries the same license as the article it is associated with.
For non-Open Access articles published, all supplemental material carries a non-exclusive license, and permission requests for re-use of supplemental material or any part of supplemental material shall be sent directly to the copyright owner as specified in the copyright notice associated with the article.