
Abstract
Background:
Health is vital for survival and societal well-being, with global goals focusing on improved access and achieving progress in public health. In Bangladesh, investigating health determinants and disparities is crucial for effective interventions.
Objective:
This study investigates spatial and temporal variations in the influence of socioeconomic and health-related factors on the health index at a detailed district level in Bangladesh, aiming to discern disparities in health indicators among districts. Based on 21 years of secondary data across 64 districts in Bangladesh, this research deploys four Bayesian spatial-temporal models to analyze the health index and relevant variables.
Design and methods:
The study identifies the optimal model by evaluating linear, analysis of variance, and autoregressive models of orders one and two. Comparative analysis utilizing the WAIC and DIC aids model selection. The MCMC method enhances precision in determining health index determinants, providing valuable insights for policymakers and researchers.
Results:
Our findings reveal that the AR (2) model demonstrated superior performance among all the spatiotemporal models. The health index demonstrated a consistent upward trend overall, but regional variations in residents’ health indices were noted. Positive spatial autocorrelation was identified in the health index, emphasizing interconnected health outcomes. Spatiotemporal models underscored the significance of the income index, child mortality, life expectancy, and the proportion of the active population as crucial factors shaping the health index in Bangladesh.
Conclusions:
This study provides actionable insights for targeted health interventions in districts with specific needs, emphasizing focused policies on poverty, education, and healthcare to enhance overall well-being in Bangladesh.
Keywords
Introduction
The role of human capital in the development process involves prioritizing the preservation, growth, and enhancement of the well-being of human populations and is now widely acknowledged as a pivotal strategy for fostering sustainable development, particularly in developing nations like Bangladesh. 1 Access to representative and comparable health data within a nation is essential for formulating evidence-based health policies, planning educational and awareness initiatives, and conducting public health research. Governments globally allocate substantial budgets to healthcare expenditures, recognizing its indispensability for enhancing human productivity and sustaining a healthy nation. Since gaining independence in 1971, Bangladesh has demonstrated a steadfast commitment to progress, achieving notable success in economic growth, poverty reduction, healthcare, and education. This remarkable development trajectory, often termed the “Bangladesh Miracle,” has transformed the nation from a struggling, war-torn country into one of the world’s most promising emerging economies. 2 However, the government must address the concept of balanced regional growth, a constitutional requirement. 3 Disparities in regional development are common in nations like Bangladesh, reflecting uneven growth. Previous plans and initiatives for the country’s development lacked a regional approach, resulting in variations in socioeconomic development across regions. These differences manifest in literacy rates, health indices, income levels, child health, life expectancy, and other critical indicators. In navigating the challenges of regional disparities, the government must adopt strategic and targeted interventions to ensure balanced and inclusive development across the nation. Smart and region-specific policies and initiatives are essential to address the existing imbalances and pave the way for holistic and sustainable progress.
In a session of the United Nations General Assembly, nations pledged to prioritize health investments in the resolution titled “Transforming our world: the 2030 Agenda for Sustainable Development.” This commitment involved a dedication to achieving universal health coverage and reducing health inequalities for people of all ages.4,5 Bangladesh actively implemented the “Health, Population, and Nutrition Sector Program (HPNSP)” in 2022, showcasing the nation’s commitment to advancing healthcare, population management, and nutrition initiatives. 5 Various macro-level studies have identified a range of factors linked to the overall health status, including the level of socioeconomic development, educational attainment, environmental factors, healthcare expenditures, urbanization, and lifestyle choices.6,7 Various factors have been utilized in health studies to elucidate individuals’ health status. Numerous studies, including references,6–10 underscore the significant role of income as a determinant of health. Education is closely linked to better healthcare outcomes. An educated population is more likely to have access to healthcare services, leading to improved public health. Education also emerges as a crucial factor influencing health outcomes in various ways.1,6,9,11,12 Individuals with higher levels of education tend to secure better employment opportunities and higher incomes and engage in fewer risky behaviors. Investments in education enhance productivity and income levels, according to research, which helps the economy flourish. 13 Urbanization is identified as another determinant of health7,9 presenting both positive and negative impacts. Positive aspects, such as increased access to medical facilities and information, and negative impacts, like pollution, which can affect overall health. 10 In the contemporary landscape, life expectancy stands out as a key determinant for gaging population health. According to a study, 9 there are regional implications for life expectancy because of uneven health facilities. Life expectancy serves as a statistical measure representing the average time an individual or creature is expected to live from birth to their current age. Again, according to WHO, a more active population is required for a healthier world, which is also an important determinant of the health index. 14
This study pioneers the application of spatial patterns, autocorrelation, and spatio-temporal models in assessing the distribution of health indices in Bangladesh from 2001 to 2021. Employing a Bayesian Hierarchical Spatial-temporal model, the research identifies the most suitable spatial model, offering valuable insights for decision-makers. 15 This innovative approach, a pioneering effort in Bangladesh, integrates spatial and temporal dimensions, providing a comprehensive understanding of health facility distribution. The study’s findings aim to inform targeted interventions and serve as a foundational resource for future spatio-temporal research endeavors.
Methods and materials
Data source
The Global Data Lab’s Area Database (https://globaldatalab.org/areadata/) was considered the main source of data that is accessed and free to use. 16 The GDL is an independent data and research center at the Nijmegen School of Management (https://www.ru.nl/nsm/) of Radboud University (https://www.ru.nl/). Bangladesh Bureau of Statistics (BBS) is also used as a secondary source for our data. 17 The data was collected for the time duration of 2001–2021. Sixty four districts of Bangladesh (the second level of administration) are considered as the spatial domain in this study; therefore, all the data is collected for each district and each predefined period (yearly). In cases where district-level data were missing, information from neighboring districts was used to impute the missing values and ensure a complete subnational dataset.
Study variables
The health index refers to a composite measure that assesses various health-related factors, including income, healthcare accessibility, quality of life, and health outcomes in different regions in Bangladesh, which is the main response variable of this study. In this research, we have considered the health index according to the district for the predefined period as our response variable. To support our research objectives, we included several covariates drawn from existing literature and their relevance to health outcomes in Bangladesh.
These include the literacy rate, which influences health awareness, preventive behavior, and the ability to access and interpret health information11,14; the income index, which reflects economic capacity to afford healthcare services and maintain a healthy lifestyle8,10; and life expectancy and child mortality, which are both widely recognized as direct measures of population health status.6,9,14,18 The proportion of the active population (working-age individuals) is included as it affects productivity, dependency ratios, and resource distribution, while population density captures the effects of congestion, resource competition, and disease transmission.7,19,20 Urbanization reflects access to infrastructure, sanitation, and health services, but also potential exposure to pollution and urban stressors.21,22 These covariates provide a broader context for understanding the factors influencing the health index.6-13
Additionally, the study’s spatial domain encompassed 64 distinct district names, while the temporal domain spanned 21 consecutive years across these districts. Consequently, each variable within the dataset comprised a total of 1344 observations (64 districts multiplied by 21 years), reflecting the comprehensive nature of the study across both spatial and temporal dimensions.
Spatio-temporal modeling
Examining, evaluating, and modeling spatiotemporal data characteristics that indicate the geometric or geographic properties of the data along with temporal characteristics is referred to as spatio-temporal analysis. The focus of spatio-temporal analysis is on variation in the variable in combinations of place and time units over the study area and study period.
Spatio-temporal pattern analysis
An integral aspect of spatio-temporal analysis involves examining the patterns of a response variable over space and time. Spatial autocorrelation is employed as a method to analyze these patterns. Here, autocorrelation in spatio-temporal data has been analyzed using Moran’s I (Global and Local Moran’s I) and Geary’s C 23 to observe the spatial pattern of the response variable (health index).
Global Moran’s I
Global Moran’s I is a widely used measure of overall spatial autocorrelation, defined as
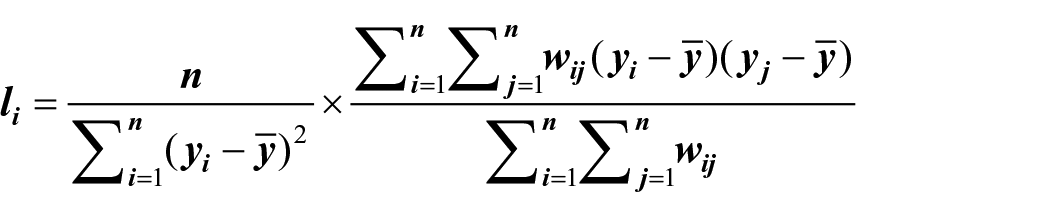
Where
Local Moran’s I (LISA)
To detect spatial heterogeneity, Local Indicators of Spatial Association (LISA) were computed. The local Moran’s I for district

This statistic identifies localized clusters, including high-high (HH) and low-low (LL) groupings, as well as spatial outliers (high-low or low-high), which are essential for targeted policy decisions.
Geary’s C
In addition to Moran’s I, Geary’s C was used to capture local dissimilarities and spatial contrast:

is the sum of all spatial weights. While both Moran’s I and Geary’s C assess spatial autocorrelation, Geary’s C emphasizes local dissimilarity. A value of
Although in theory Geary’s coefficient and Moran’s index are comparable, Geary’s coefficient is based on a sample, and Moran’s index is based on the population.21,22 In this study, spatio-temporal autocorrelation checking has been done as an extension of Moran’s I and Geary’s C. 24
Bayesian hierarchical model
In this context, the response variable, denoted as the health index

Where,

Where
For independent error general linear regression model matrix of unknown regression coefficients is denoted as

Here,
Results
Exploratory data analysis
Exploratory Data Analysis (EDA) is a crucial phase in the data analysis process where the primary goal is to gain insights and a deeper understanding of the dataset. It involves the use of statistical graphics, plots, and summary statistics to explore the main characteristics, patterns, and relationships visually and quantitatively within the data.
Distribution of response variable
It is assumed that
From the above graph, it is seen that over the past 21 years, the health index has been rising in Bangladesh (Figure 1(a)). In the most recent year of 2019, Bangladesh had a maximum health index of

Annual Health Index: (a) time series plot and (b) spatial distributions.
Correlation matrix of variables
Utilizing pairwise correlations, Figure 2 illustrates Bangladesh’s health index connections with relevant covariables. Notably, strong positive correlations exist between the health index and the life expectancy of people. Income, education, and active population also strongly align with the health index (0.67, 0.77, 0.73), supporting the growth of high-quality healthcare facilities in financially stable, educated, and active communities.

Correlation matrix of the selected variables.
Urbanization and population density have a positive impact on health, specifically in urban areas with higher indices, as indicated by correlation coefficients of 0.14 and 0.17, respectively. However, the overall correlation is less, influenced by regional disparities. The inverse correlation between urbanization and child mortality underscores effective medical services. Notably, no discernible link between the health index and Dhaka from a distance indicates minimal geographical impact. This study offers compelling evidence that financial standing, educational attainment, and an active population foster health consciousness and ensure widespread access to healthcare in Bangladesh.
Spatial analysis of influencing factors
Figure 3 underscores pronounced regional differences in Bangladesh, highlighting Dhaka’s high population density compared to sparser mountainous areas and distant northeastern districts.
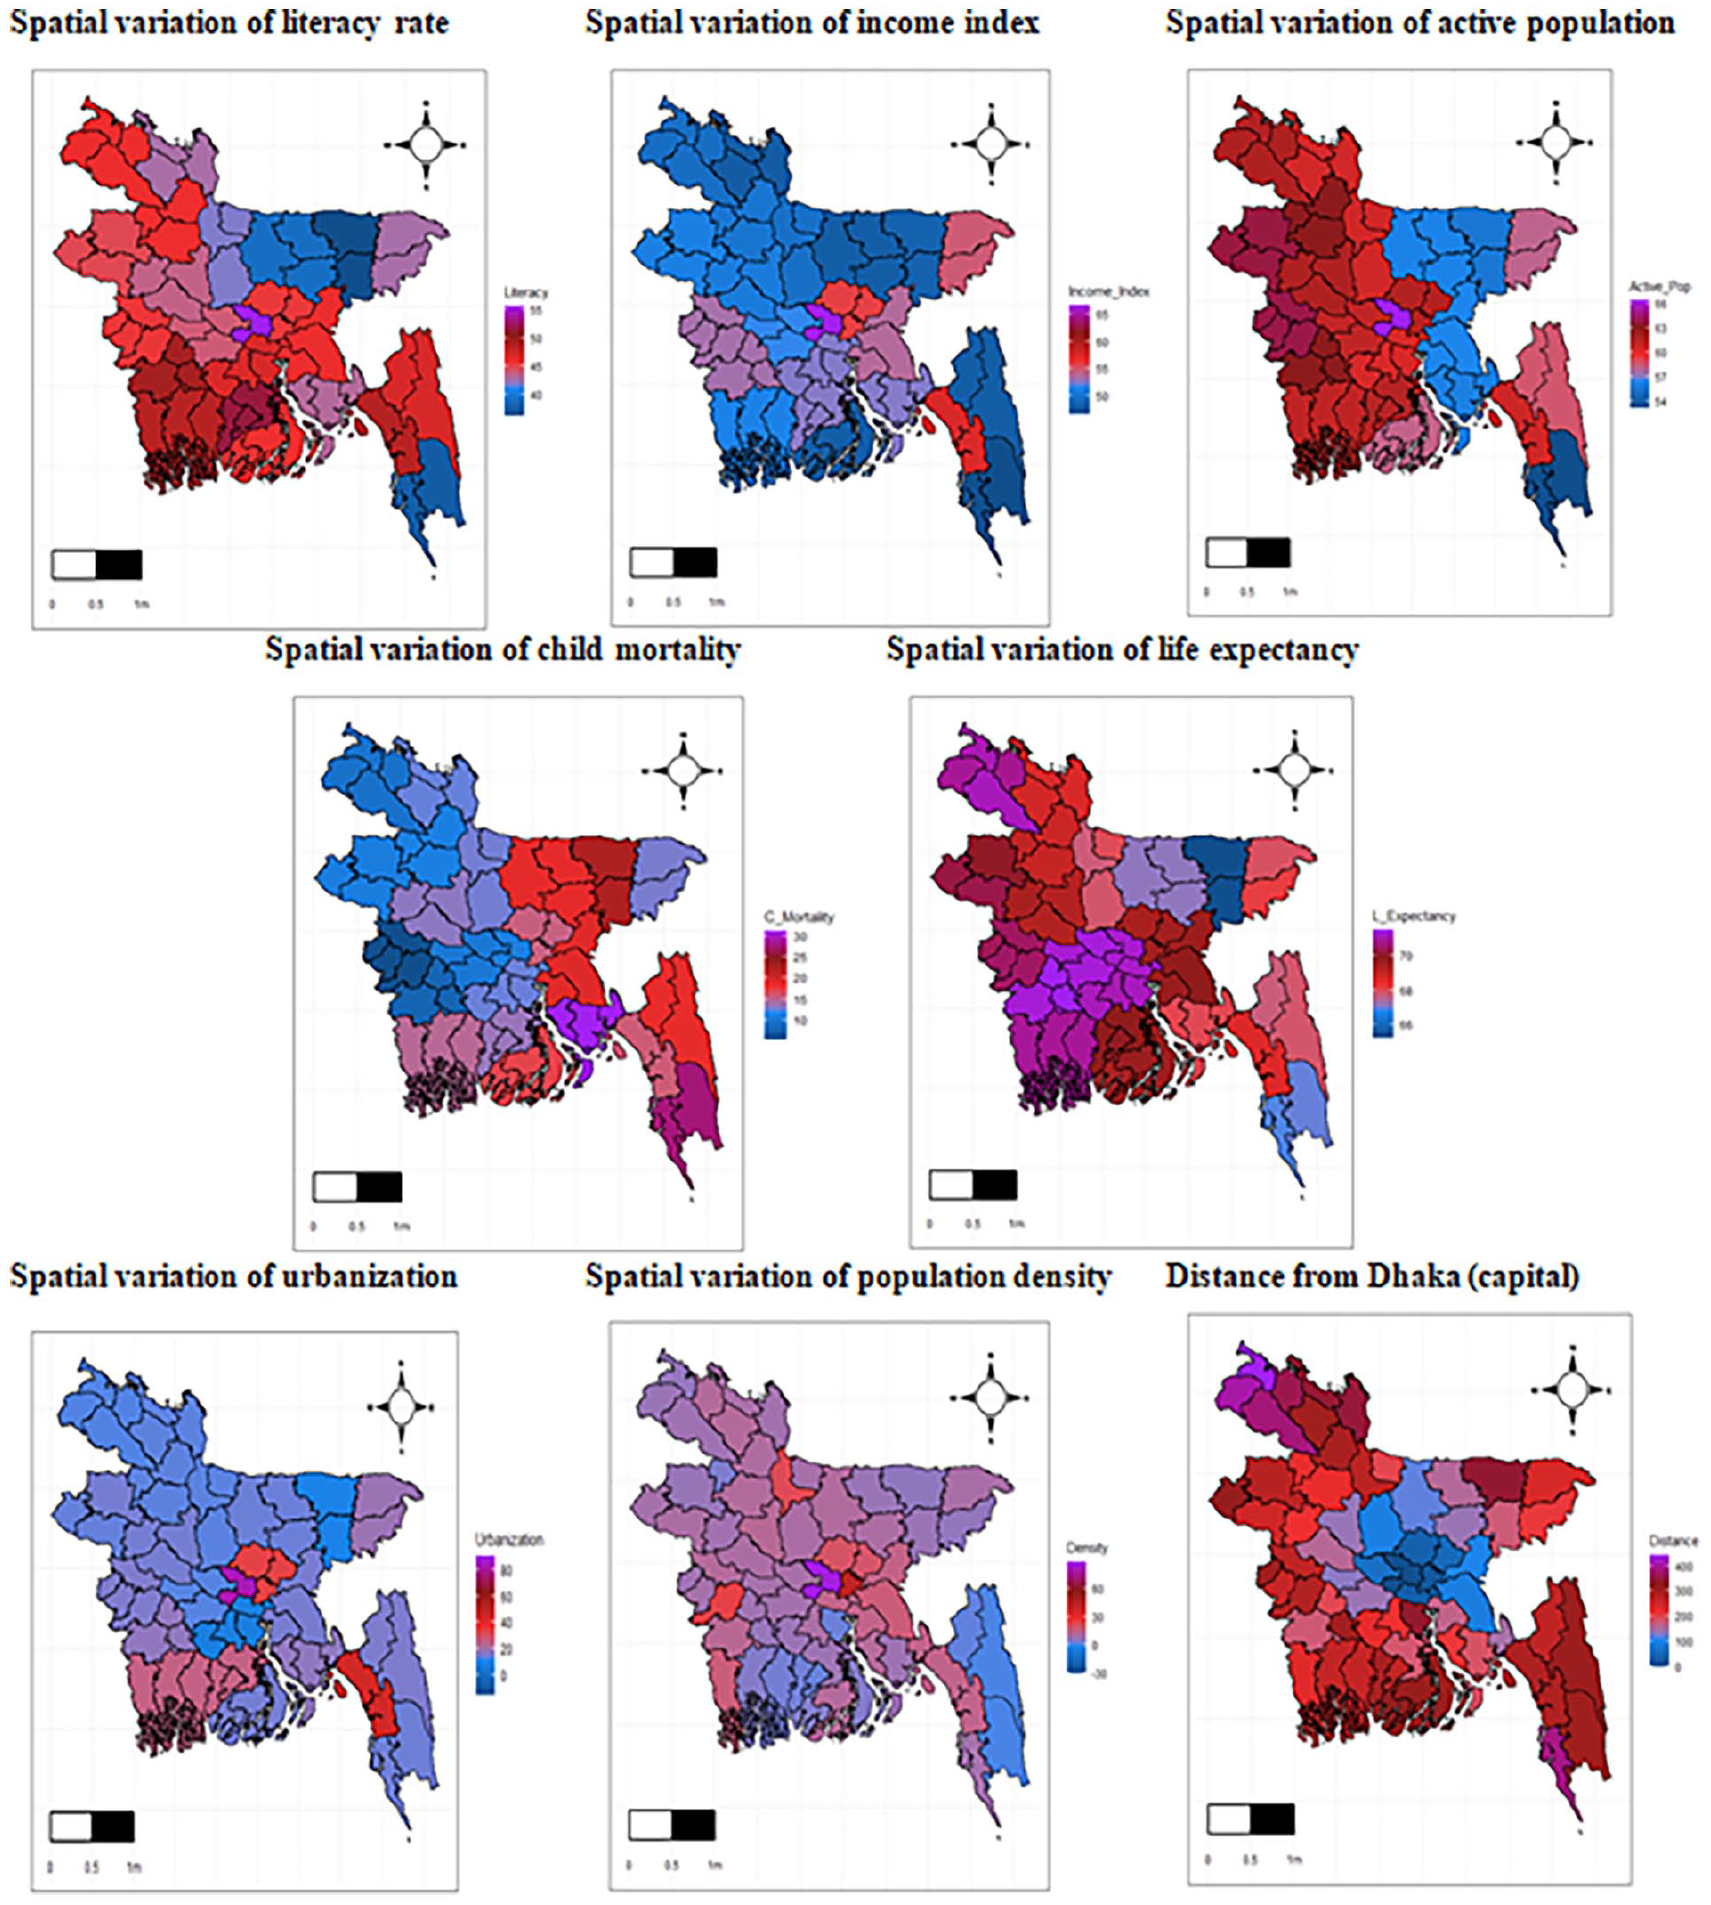
District-wise variation of significant covariates.
Living conditions vary widely, with substandard levels prevalent in many areas, while higher income indices are concentrated in Dhaka and the northwest. The literacy rate distribution mirrors these trends, with Dhaka and the eastern regions leading in terms of active population, while the western districts lag.
Child mortality, as depicted in Figure 3, has varied significantly over the past 21 years, with Chuadanga, Kushtia, and Jhenaidah reporting lower rates than Feni, Noakhali, and Lakshmipur, correlating negatively with health indices. Dhaka City and the southeast exhibit higher life expectancy, positively linked to health indices, whereas Sunamganj and Habiganj show lower life expectancy. Urbanization is concentrated in Dhaka, Chittagong, and select districts, emphasizing Bangladesh’s uneven development. Figure 3 visually portrays Dhaka as the most populous district, with the mountainous region having a lower population density. The northeastern districts remain distant from the capital, encapsulating Bangladesh’s geographical diversity.
Spatio-temporal modeling
Global Moran’s I and Geary’s C for spatial pattern analysis
To examine spatial patterns using autocorrelation with Global Moran’s I let set the hypothesis as,
The hypothesis mentioned above is considered while analyzing autocorrelation with Global Moran’s I. The statistics for the global Moran’s I and Geary’s C of the health index are shown in Table 1 below.
Moran’s I and Geary’s C statistics under randomization for health index.

A good spatial autocorrelation between regional domains was found using Moran I’s, which produced a score of 0.724. The obtained p-value of
Again, Figure 4(a)’s density plot of Monte Carlo permutation results illustrates the observed Moran’s I value at 0.724, indicating positive spatial autocorrelation. The Geary’s C statistic, computed at 0.542 (within [0,1)), further confirms positive autocorrelation between districts' health indices.
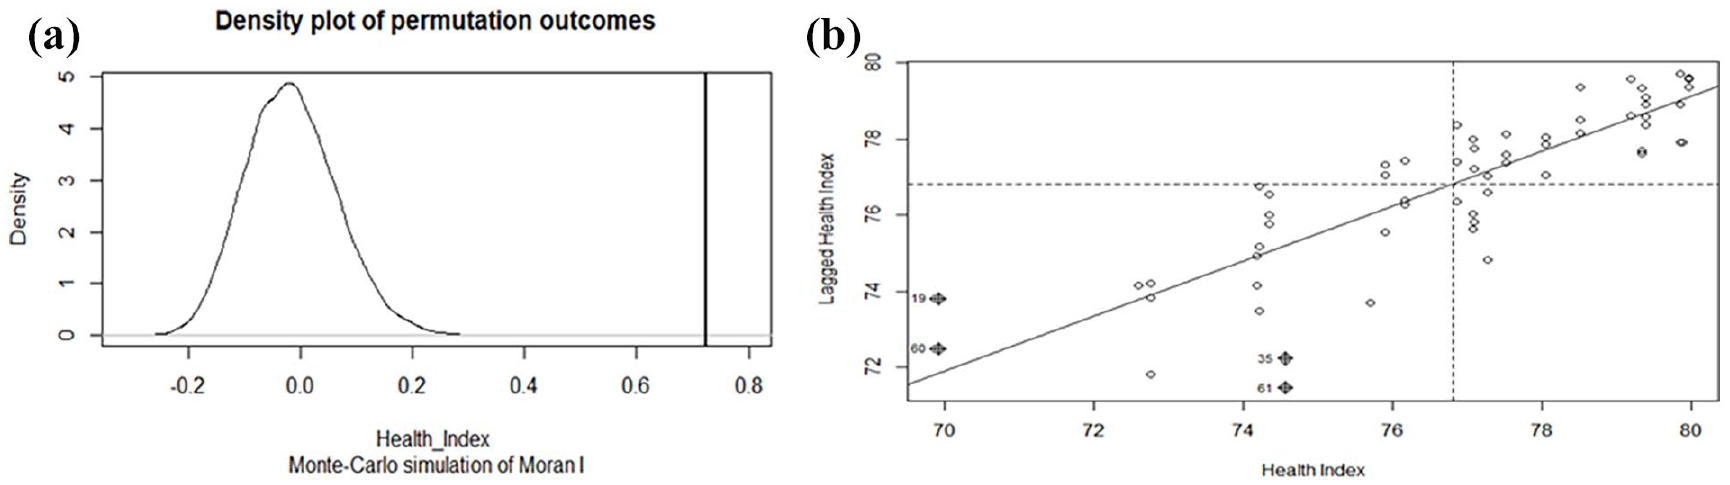
(a) Density plot of Global Moran’s I and (b) graphical representation of spatial – autocorrelation.
Both analyses unveil clusters in health indices. The “Moran scatter plot” (Figure 4(b)) reinforces spatial autocorrelation, depicting data points close to one another. The significantly positive Moran’s I suggest spatial clustering, prompting further exploration for potential hotspots. This insight guides subsequent model refinement in the MCMC setting.
Local Moran’s I
The spatial weights of items form the foundation for the Local Moran’s I statistic. Figure 5’s cluster map illustrates districts with notable geographic homogeneity, deemed significant at a 90% confidence level. This determination takes into consideration the effects of both spatial lag and the spatial weights assigned to adjacent districts. North-east and southeast regions of Bangladesh without Brahamanbaria, Comilla, and Chandpur districts have a high Low-Low health facilities cluster. Again, the south-west part of Bangladesh including four northeast districts Panchagarh, Thakurgoan, Dinajpur, and Nilphamari shows a dark red color, indicating that districts have a high health index with a high health index in neighborhood districts. At the same time, the brown color indicates that four districts are in the High-Low cluster and the dark blue color represents five districts are in the Low-Heigh cluster.
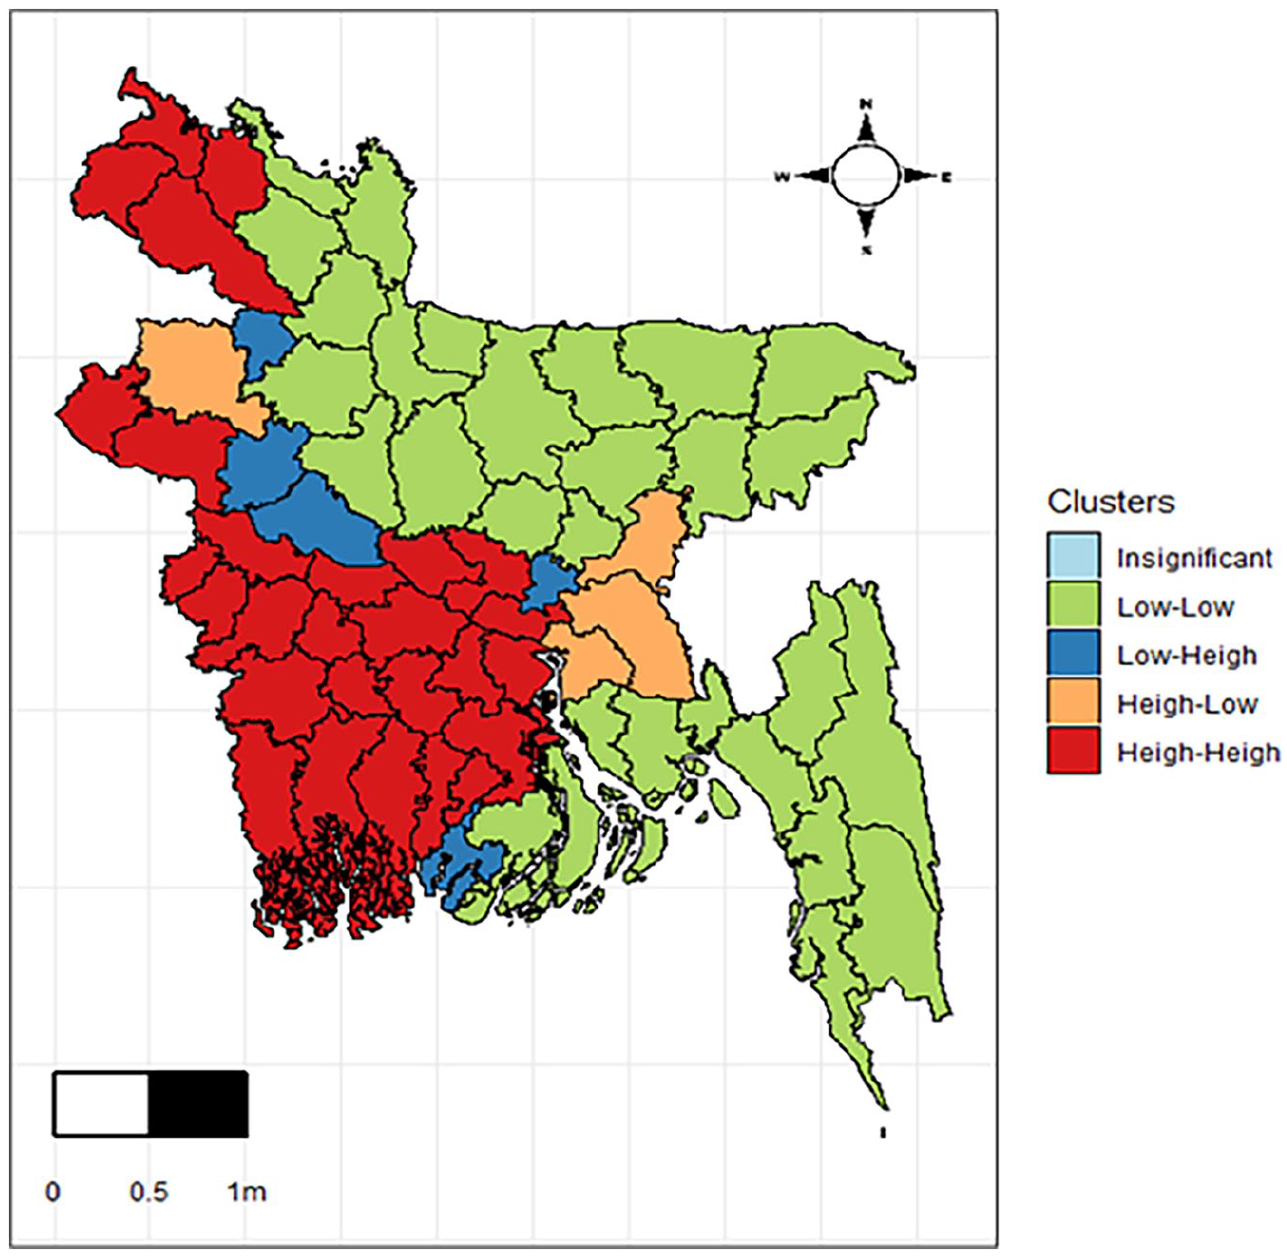
Spatial clustering (local Moran’s I) of health index.
Bayesian spatiotemporal modeling
Exploratory spatial data analysis (ESDA) faces challenges in capturing the temporal dynamics of geographical features, despite its ability to depict complex spatial patterns.
30
For a comprehensive understanding of both spatial and temporal effects, Bayesian spatio-temporal modeling proves effective. It is advisable to initiate modeling with an Independent Error Bayesian model before incorporating spatial and temporal dimensions. This step allows for a clear appreciation of the enhancements introduced when integrating spatial and temporal effects into the model. The linear predictor

Population density is in log scale and distance from Dhaka divided by 10 for modeling the health index. After 20,000 burn-in iterations, all the models were run for 120,000 iterations. To reduce autocorrelation in the MCMC setting, the data were kept following a thinning of 10 iterations. The estimated results from the fitted bmstdr model, encompassing confidence intervals, are presented in Table 2 for all five models.
Estimated parameters with their credible interval for all proposed models.

Table 2 incorporates various spatiotemporal indicators for the five described models. The findings consistently highlight the substantial influence of factors on the health index across all models. The parameter estimates in Table 2 show that the proportion of the active population, the life expectancy and the income are significant predictors while considering health development. Again, child mortality is not significant in the model, which is like pairwise correlation. In Independent Error Bayesian GLM, there is a high impact of life expectancy on health development, which can be seen from the above explanations. Autoregression variance
Selecting a well-fitted model is of utmost importance to accurately capture the data patterns. Table 3 and Figure 6 serve as representations of the model selection and validation criteria, facilitating the identification of the most suitable model to capture and express the underlying patterns within the data effectively.
Assessment criteria for the chosen models’ performance.

Values in bold indicate statistical significance at the 5% level.

Comparison plot for performance measures of the selected models.
Table 3 consolidates the performance measures of the chosen models, utilizing both model selection and validation criteria. Additionally, Figure 6 illustrates model comparison plots based on the MCMC sample, further aiding in the decision-making process to identify the most suitable model. Table 3 and Figure 6 provide insights into model performance and validation criteria, highlighting that the
Figure 7 represents the coverage percentage of MCMC estimation. To assess the best-fitted model, 10,000 samples from the MCMC are employed to compute residuals and their standard deviation for spatial model fitting. Figure 8 presents a residual plot for each district and a plot depicting the standard error of the residuals. The standard error plot indicates minimal variation in residual values. Notably, the plots in Figure 8 do not unveil any significant spatial patterns warranting further investigation. Instead, they depict spatially aggregated residuals and the standard deviation of residuals derived from the spatio-temporal AR(2) model.
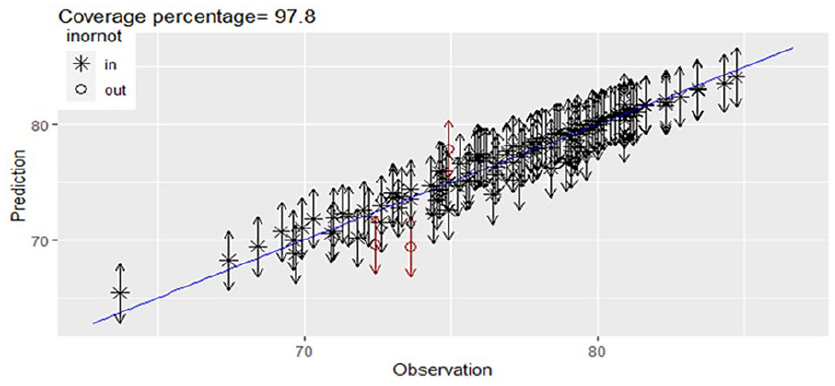
Coverage percentage using MCMC Bayesian estimation.

(a) Aggregated spatial residuals and (b) standard error of the residuals.
The temporally fitted plot spanning the entire 21-year period indicates a balanced distribution of fitted values. There is neither a significant overestimation nor underestimation, suggesting the AR (2) model’s accuracy within the spatial-temporal framework. The proximity of the lower and upper lines to the fitted values, as depicted in Figure 9, further reinforces the model’s reliability in capturing the temporal dynamics of the data.

Time-series representation of observed and fitted health index values along with 95% confidence intervals.
Discussion
This study investigates the spatiotemporal effects of various factors on the health index in Bangladesh. Regional disparities are a common phenomenon, seen in both developed and developing nations, with more pronounced variations in the latter, exemplified by Bangladesh. In our study,31,32 we employed spatial autocorrelation to find clusters and Bayesian spatial-temporal models to assess influential factors of health index in our country. The study aims to uncover spatial variations in health facilities at regional levels in the country. The results reveal that, at the district level in Bangladesh, the health index has shown growth over the years (2001–2021). However, notable inequities persist, indicating varying rates among districts. Consistent with findings in other studies6–8,33 income per capita demonstrates a positive impact on health. Higher income levels contribute to increased access to high-quality goods and services, improved housing, and enhanced medical care services, collectively influencing overall health status.7,34 Contrary to the conventional positive or negative associations found in many studies, our analysis reveals a positive correlation between income and the health index in our country, acknowledging regional disparities. Regarding spatio-temporal effects, the findings on education differ from those of previous studies. Typically, higher levels of education are associated with increased sensitivity and awareness about health, prompting individuals to take proactive measures to enhance both the quantity and quality of their health. 7 In our analysis, we observed no significant effect of education on the health index, accounting for both spatial and temporal variations. This finding contrasts with the expectations based on general trends, emphasizing the nuanced and context-specific nature of the relationship between education and health in our study. This may be due to multicollinearity among predictors such as income and life expectancy, which are often strongly correlated with education. In Bayesian models, multicollinearity can inflate posterior variances and obscure individual effects, even with weakly informative priors.35,36 While our model accounted for spatial and temporal dependencies, further sensitivity analysis, such as testing alternative prior settings or excluding correlated covariates, could help clarify the true role of education. A study conducted by Das indicated the potential to improve the health index in areas with low levels of education through systematic awareness-raising programs. The implementation of such programs could lead to increased service coverage in those regions. 37 However, it’s crucial to note that certain variables, such as urbanization, population density, and distance, exhibited insignificance in their impact on health development in Bangladesh. This outcome can be attributed to the economic landscape of Bangladesh, which is characteristic of a developing country. In particular, the uneven distribution of urbanization across different districts within Bangladesh likely contributed to the insignificance of the urbanization variable in the context of health development. It is noteworthy that, in some studies, the argument is made that individuals in urban areas possess greater access to medical care services and health information, thereby suggesting a positive impact of urbanization on the health index.10,38 In our study, we also found a positive impact of life expectancy and the proportion of the active population on the health index. Simultaneously, the observed decreasing trend in child mortality is indicative of a positive effect on the health index. Consistent with prior research, our study aligns with the recommendation to mitigate child mortality by ensuring the effective utilization of health services.39,40 Our study underscores regional disparities in health indicators, emphasizing the need for targeted community-level interventions aimed at poverty reduction, universal education, and addressing geographical disparities in healthcare access.32,40 Specifically, our findings suggest that efforts should be differentially focused on enhancing child health care utilization, enough health facilities, and improving socioeconomic status, especially in disadvantaged regions.
Policy implications, practical applications, and limitations
To enhance the applicability of our findings in real-world policymaking, especially in the context of Bangladesh, it is essential to translate statistical insights into concrete actions. To make these findings more actionable, practical interventions such as deploying community health clinics, community health workers, and telemedicine initiatives could be prioritized in low-performing districts like Kurigram, Bandarban, and Sunamganj, where access remains limited. 41 Insights from successful regional models, including Nepal’s Female Community Health Volunteers (FCHVs) and India’s Accredited Social Health Activists (ASHAs), show how community-based health outreach can improve maternal and child health.42,43 Such models can be adapted in Bangladesh through collaboration with organizations like BRAC or Gonoshasthaya Kendra. Better policy targeting can also be ensured by district-level health monitoring and resource allocation that is directed by the spatial clusters found in this study. This study offers a basis for well-informed, fair, and context-sensitive health policymaking in Bangladesh by coordinating evidence with workable strategy.13,44 Despite the strengths of this study, some limitations should be acknowledged. The reliance on secondary data over 21 years may involve inconsistencies in data collection methods, missing values, and potential measurement errors. Although imputation from neighboring districts was applied where necessary, these factors may still influence the robustness of the results.
Conclusion
The health index serves as a comprehensive measure of overall health, combining various indicators. This study investigates the spatiotemporal effects on the health index in 64 districts in Bangladesh, utilizing Bayesian spatial-temporal models. The AR (2) model emerges as the optimal choice, capturing spatial and temporal dynamics effectively. Again, the spatial pattern of the health index shows four clusters of the 64 districts, which shows how similar different districts are within the clusters. Findings indicate both spatial and temporal influences on the health index, highlighting significant impacts of life expectancy, income, proportion of active population, and child mortality on the health index. The findings of this study offer policymakers a concise overview of various districts in Bangladesh, encompassing crucial health indicators. This information empowers them to formulate essential policies and implement targeted development strategies based on a comprehensive understanding of the health landscape across different regions. The study underscores the need for targeted community-level programs, particularly in underprivileged districts, emphasizing a reevaluation of government strategies. Policymakers should prioritize initiatives based on research outcomes. To achieve universal health coverage and overcome barriers to healthcare access, the study recommends decentralizing healthcare services and initiating health promotion initiatives in regions with fewer facilities. The study provides a holistic understanding of regional development disparities, offering valuable insights for future research on health indices in Bangladesh.
Supplemental Material
sj-docx-1-phj-10.1177_22799036251351156 – Supplemental material for Exploring the spatial and temporal dynamics of the health index of Bangladesh using Bayesian framework
Supplemental material, sj-docx-1-phj-10.1177_22799036251351156 for Exploring the spatial and temporal dynamics of the health index of Bangladesh using Bayesian framework by Afroza Sultana, Akher Ali, Sifat Ar Salan and Mohammad Alamgir Kabir in Journal of Public Health Research
Footnotes
Acknowledgements
The authors are thankful to the academic editor, associate editor and three anonymous reviewers for their valuable comments and suggestions that helped to enhance the quality of the manuscript.
Abbreviations
Author Contributions
Afroza Sultana: Conceptualization, Data curation, Formal analysis, Methodology, Software, Visualization, Investigation, Writing – original draft. Md. Akher Ali: Data curation, Visualization, Writing original draft. Md. Sifat Ar Salan: Conceptualization, Formal analysis, Methodology, Software, Supervision, Investigation, Writing original draft, Validation, Writing, Reviewing and editing. Mohammad Alamgir Kabir: Conceptualization, Methodology, Supervision, Validation, Writing, Reviewing and editing. All authors approved the final version of the manuscript.
Funding
The author(s) received no financial support for the research, authorship, and/or publication of this article
Declaration of conflicting interests
The author(s) declared no potential conflicts of interest with respect to the research, authorship, and/or publication of this article
Code sharing statement
The R-code used in this study will be made available to the first author upon reasonable request
Supplemental material
Supplemental material for this article is available online.
References
Supplementary Material
Please find the following supplemental material available below.
For Open Access articles published under a Creative Commons License, all supplemental material carries the same license as the article it is associated with.
For non-Open Access articles published, all supplemental material carries a non-exclusive license, and permission requests for re-use of supplemental material or any part of supplemental material shall be sent directly to the copyright owner as specified in the copyright notice associated with the article.