
Abstract
The aim of this article is to understand consumer complaint satisfaction in the electronics industry. The focus has been placed on consumers of household electronic items who have complained to the company due to one of several reasons (e.g., technical glitch, malfunction, and defect). The various factors responsible for complaint satisfaction have been determined through literature reviews and primary surveys (questionnaires). The three kinds of justice dimensions of organizational behavior (Procedural, Interactional and Distributive) have been incorporated into the model to measure a company’s response to any complaint. The data of 595 consumers of Delhi-National Capital Region (NCR) (India) have been collected and analysed using smartPLS 2.0. software. The findings of the study reveal that the process of handling customer complaints affects customer satisfaction and retention rate. Customer who have good experiences during the complaint-handling process, exert positive word of mouth (WOM) and those who have bad experiences during the complaint-handling process exert negative WOM. To study the relationship between complaint satisfaction level, consumers repurchase intention and WOM intention a complaint satisfaction model has been constructed.
Keywords
Introduction
Electronic products have become a necessity due to the overloading of responsibilities and work. The lives of consumers have been simplified and sorted due to automated machines and a variety of household appliances. The manufacturer’s obligation does not end with the mere creation and delivery of the goods (Sharma & Patra, 2021). Consumer input or feedback also plays a vital role in the sustenance and growth of a company (Berry et al., 2014). Despite this, most businesses discourage negative feedback and ignore customer complaints. The absence of a proper complaint management system discourages consumers from directly complaining to the company, which results in indirect complaints to family and friends (Fook & Dastane, 2021). Companies should perceive this as an opportunity while formulating marketing strategies (Ali & Bhasin, 2019). Consumer complaints entail important information regarding pitfalls in products and services (Resnik & Harmon, 1983). Feedback received in the form of a complaint provides an opportunity to overcome the weakness of the firm’s product (Lal & Kashyap, 2018).
The judgment about any product cannot solely be dependent on the price of the product as the other factors also interplay their role (Kashyap et al., 2020). A company can prevent any negative judgment/perception about itself by providing a forum for consumers to vent their anger/dissatisfaction. Thus in the first stage, it becomes important to determine the rate of direct complaints which are made to the company by consumers (Fook & Dastane, 2021). Mere complaining does not assure that the issue will be resolved quickly as a consumer might have to go through many processes after complaining. As a result, it is vital to understand the prime factors that influence consumer satisfaction (post-complaint) and repurchase intention thereof (Sharma & Patra, 2021). Thus, this research would help in understanding/measuring customer retention when consumer complaints are resolved successfully.
Literature Review
Complaining is a social responsibility of any consumer so that companies can improve their products and services (Lau & Ng, 2001). Negative word of mouth (WOM) can be avoided through a better-perceived justice system (Blodgett et al., 1993). Consumers’ propensity to complain is determined by the product’s price and its importance (Lal & Kashyap, 2018).
Electronic items are usually complicated machines which consumers might find difficult to operate (Kim et al., 2007). Thus, sometimes the lack of knowledge leads to customer dissatisfaction. In order to maintain long-term relationships, it is better to provide knowledge to customers about product usage (Kashyap & Makhija, 2019). The customer satisfaction concept has been extended to a new concept known as customer complaint satisfaction. The response of the company to consumer complaints determines the complaint satisfaction rate and positive WOM intention.
In 1987, Greenberg gave three justice dimensions to study organizational behavior. The justice dimensions consist of procedural justice, distributive justice and interactional justice, which were supposed to measure organizational commitment of employees (Greenberg, 1987). These justice perceptions have been applied in the field of consumer behavior by a few researchers. The morale of an employee is drowned when he/she considers the acts of organization as unjust and unethical (Resnik & Harmon, 1983). Similarly, a loyal customer may feel drowned and bad when found to be cheated by the firm (Sharma & Patra, 2021). These dimensions are a mixture of rational, logical and emotional components that help in the overall assessment of the human mind. Complaint satisfaction may be attained by considering these perceptions as an opportunity rather than a weakness (Ali & Bhasin, 2019). The three justice dimensions are as follows:
Procedural Justice
Procedural justice is about the process through which an individual passes before any achievement is attained. In the case of consumer behavior this dimension is measured through three aspects, that is, “promptness,” “employee behavior,” and “compensation” (Estelami, 2000). On the basis of these three determinants, the consumer decides the level of procedural justice which ultimately influences the complaint satisfaction (Srivastava & Sharma, 2017). A complex procedure and delayed system of complaint handling will make consumers frustrated and angry. Thus the following hypothesis needs to be tested for better understanding:
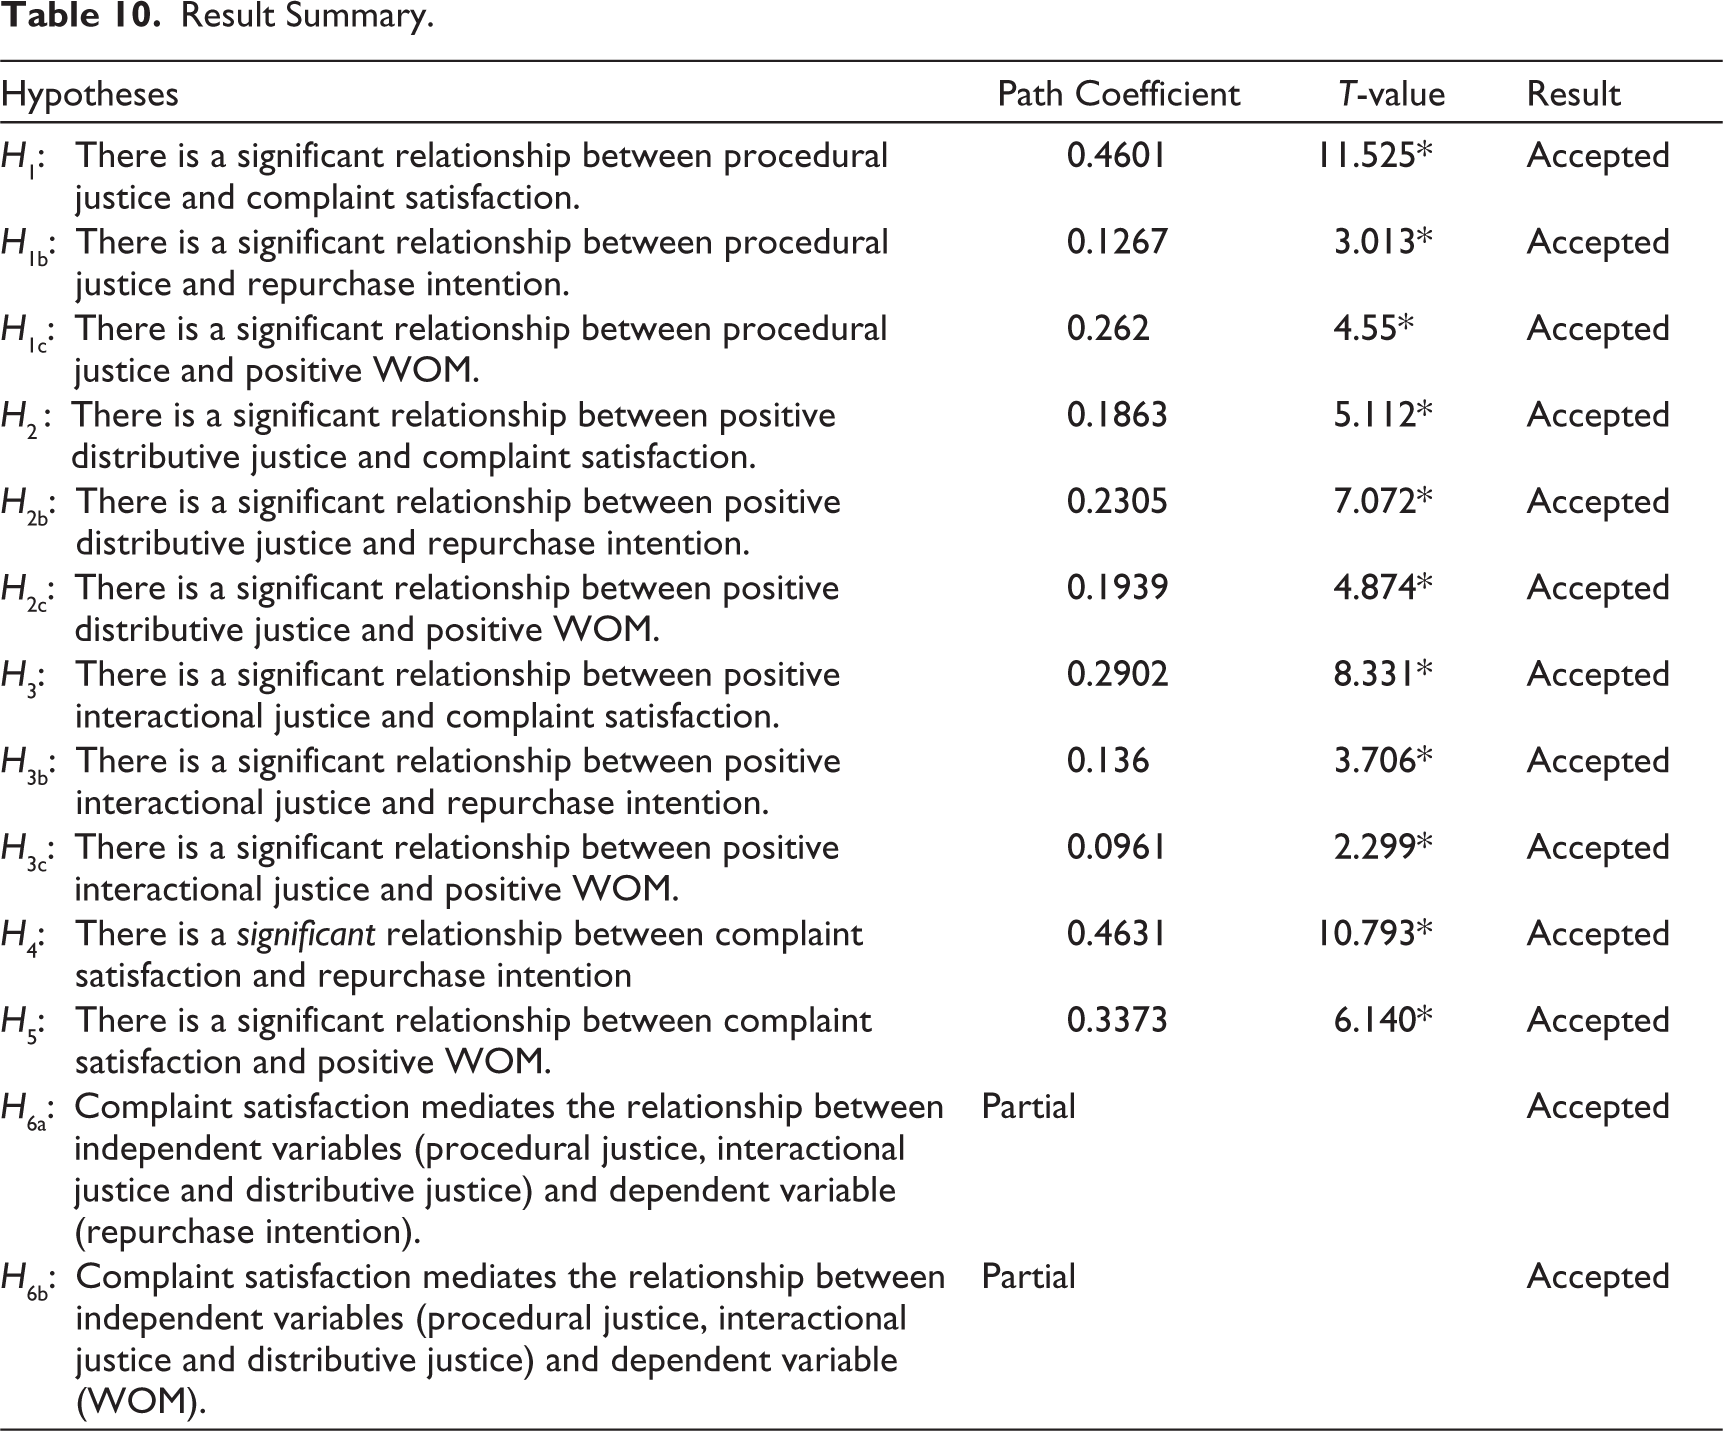
H1: There is a significant relationship between procedural justice and complaint satisfaction.
Distributive Justice
Messick and Cook (1983) define distributive justice as “Fairness of the tangible outcome of a decision”. Compensating all the consumers equally for different kinds of defects or problems will lead to a violation of the equity principle and will generate greater dissatisfaction among consumers. Therefore, compensation should be provided according to the product cost and damage borne by the consumer. Thus the following relationship shall also be studied:
H2: There is a significant relationship between Distributive justice and complaint satisfaction.
Interactional Justice
Bies & Shapiro (1987) defined Interactional justice as “Quality of the interpersonal treatment people experience during the resolution of conflict”. A consumer not only judges the compensation but also the way he/she is treated during a complaint process. The role of the complaint handler is focused in this dimension, that is, the complaint handler should be courteous, polite and communicative. Therefore the following relationship should be tested for understanding the importance of interactional justice:
H3: There is a significant relationship between Interactional justice and complaint satisfaction.
Consumer Retention
Morgan and Hunt (1994) defined consumer retention as a “Customer’s intention to repurchase a service from the service provider”. The customer retention rate can be detected through the frequency of purchase, repurchase intentional, and WOM (Lu et al., 2012; Mensah & Mensah, 2018). Through regular feedback and loyalty programs customers can be targeted so that attempts are made to retain them (Consumer Complaints Management Guide). A firm’s reputation is one of the factors that is responsible for behavioral intentions, that is, repurchase intention and WOM (Nikbin et al., 2011). Nikbin et al. (2011) tested the relationship between a firm’s reputation and a consumer’s intention to repurchase; and found a positive relationship between them. Thus the following hypothesis is considered appropriate for testing:
H4: There is a significant relationship between complaint satisfaction and Repurchase intention H5: There is a significant relationship between complaint satisfaction and positive WOM.
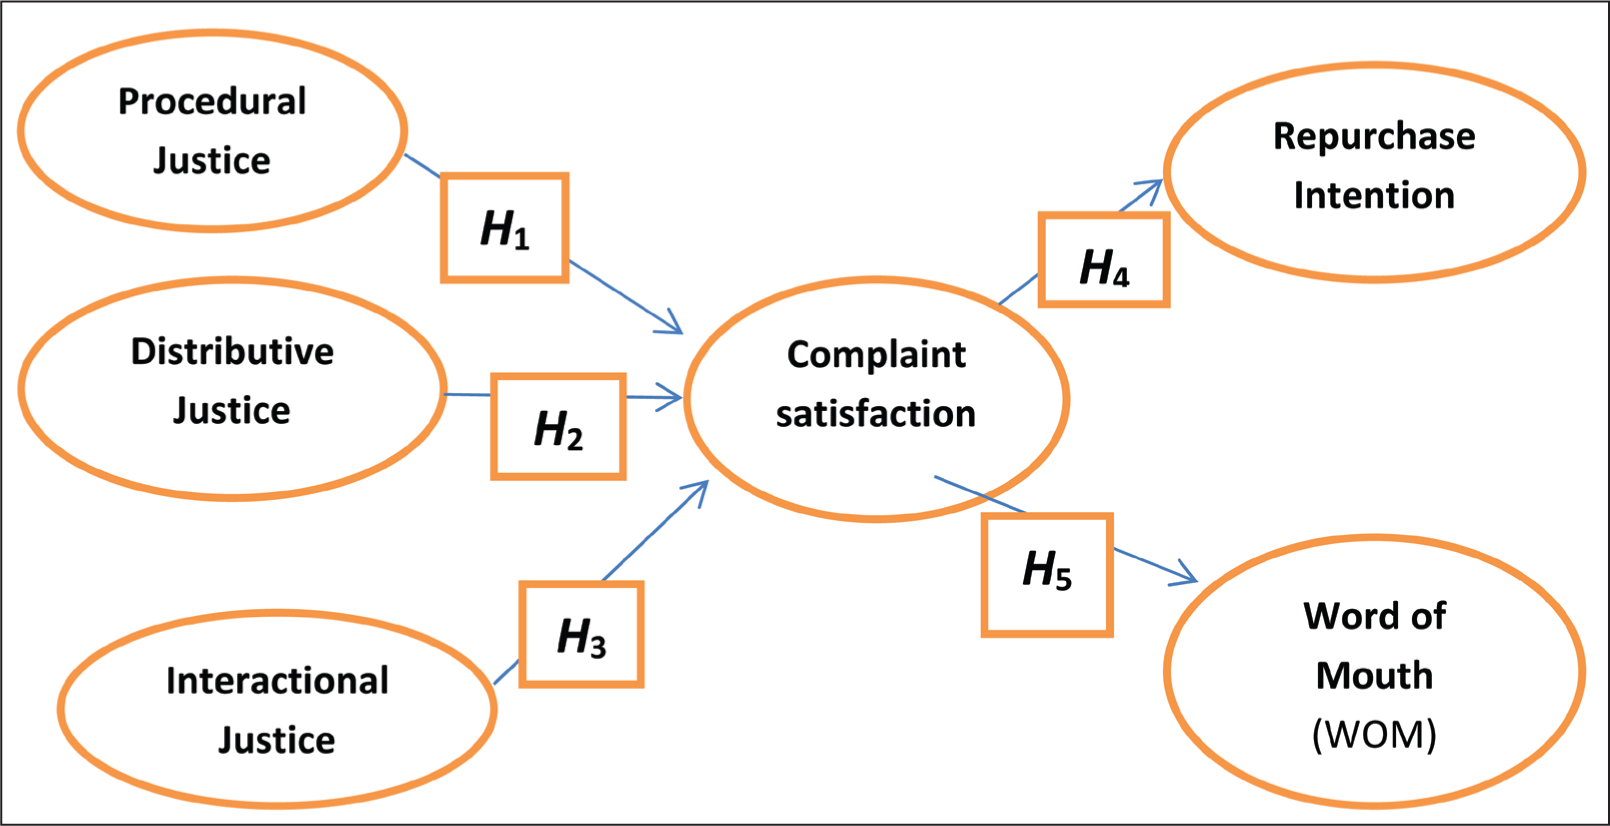
The summarized form of all the hypotheses is depicted in Figure 1, which is also a model for our research.
In Figure 1, the complaint satisfaction construct could be a mediator, that is, the presence or absence of the satisfaction construct would change the relationship between justice dimensions and customer retention. Therefore, the mediation effect should also be studied:
H6a: Complaint satisfaction mediates the relationship between independent variables (procedural justice, interactional justice, and distributive justice) and dependent variable (repurchase intention). H6b: Complaint satisfaction mediates the relationship between independent variables (procedural justice, interactional justice, and distributive justice) and dependent variable (WOM). H7: There is a significant difference in distributive justice, perceived justice, interactional justice, complaint satisfaction, repurchase intention and WOM across age categories of consumers. H8: There is a significant difference in distributive justice, perceived justice, interactional justice, complaint satisfaction, repurchase intention and WOM of male and female consumers. H9: There is a significant difference in distributive justice, perceived justice, interactional justice, complaint satisfaction, repurchase intention and WOM of consumers having different marital status. H10: There is a significant difference in distributive justice, perceived justice, interactional justice, complaint satisfaction, repurchase intention and WOM of consumers having different educational backgrounds. H11: There is a significant difference in distributive justice, perceived justice, interactional justice, complaint satisfaction, repurchase intention and WOM across different occupation categories of consumers. H12: There is a significant difference in distributive justice, perceived justice, interactional justice, complaint satisfaction, repurchase intention and WOM across different income levels of consumers.
Research Gap
There are many studies on complaint behavior but very few studies have been conducted on complaint management satisfaction. Moreover, there has been no study conducted in Delhi-NCR on the measurement of complaint satisfaction and customer retention thereof. The study will not only benefit marketers but will also help consumers to understand the importance of complaints. This would also benefit society, academicians, and the government at large.
Objectives
To study the relationship between consumer complaint satisfaction (CCS) and the company’s responses.
To analyze the relationship between CCS and repurchase intention.
To identify the relationship between CCS and WOM.
Research Methodology
The research framework (Figure 1) is meant to study the relationship between complaint satisfaction level and consumer repurchase intention. Moreover, the role of the perceived justice dimension in determining CCS has also been investigated.
Research Design
An exploratory and confirmatory approach has been applied.
Research Instrument
To accomplish the objectives, a survey approach using a questionnaire was adopted. For the development of a questionnaire, an item scale has been constructed for each of the constructs in the model.
Sample Size
595 responses were collected from the Delhi-NCR region of India.
Data Collection Source
The data was collected from primary and secondary sources. The secondary source includes books, magazines, newspaper, and journals and primary data was collected from 595 consumers. These consumers were those who had directly complained to the company.
Technique of Data Analysis
IBM statistical package for the social sciences (SPSS) software (statistical package for the social sciences) (IBM, 2011) and smartPLS 2.0 software have been employed for analyses of data.
Development of Scale Items
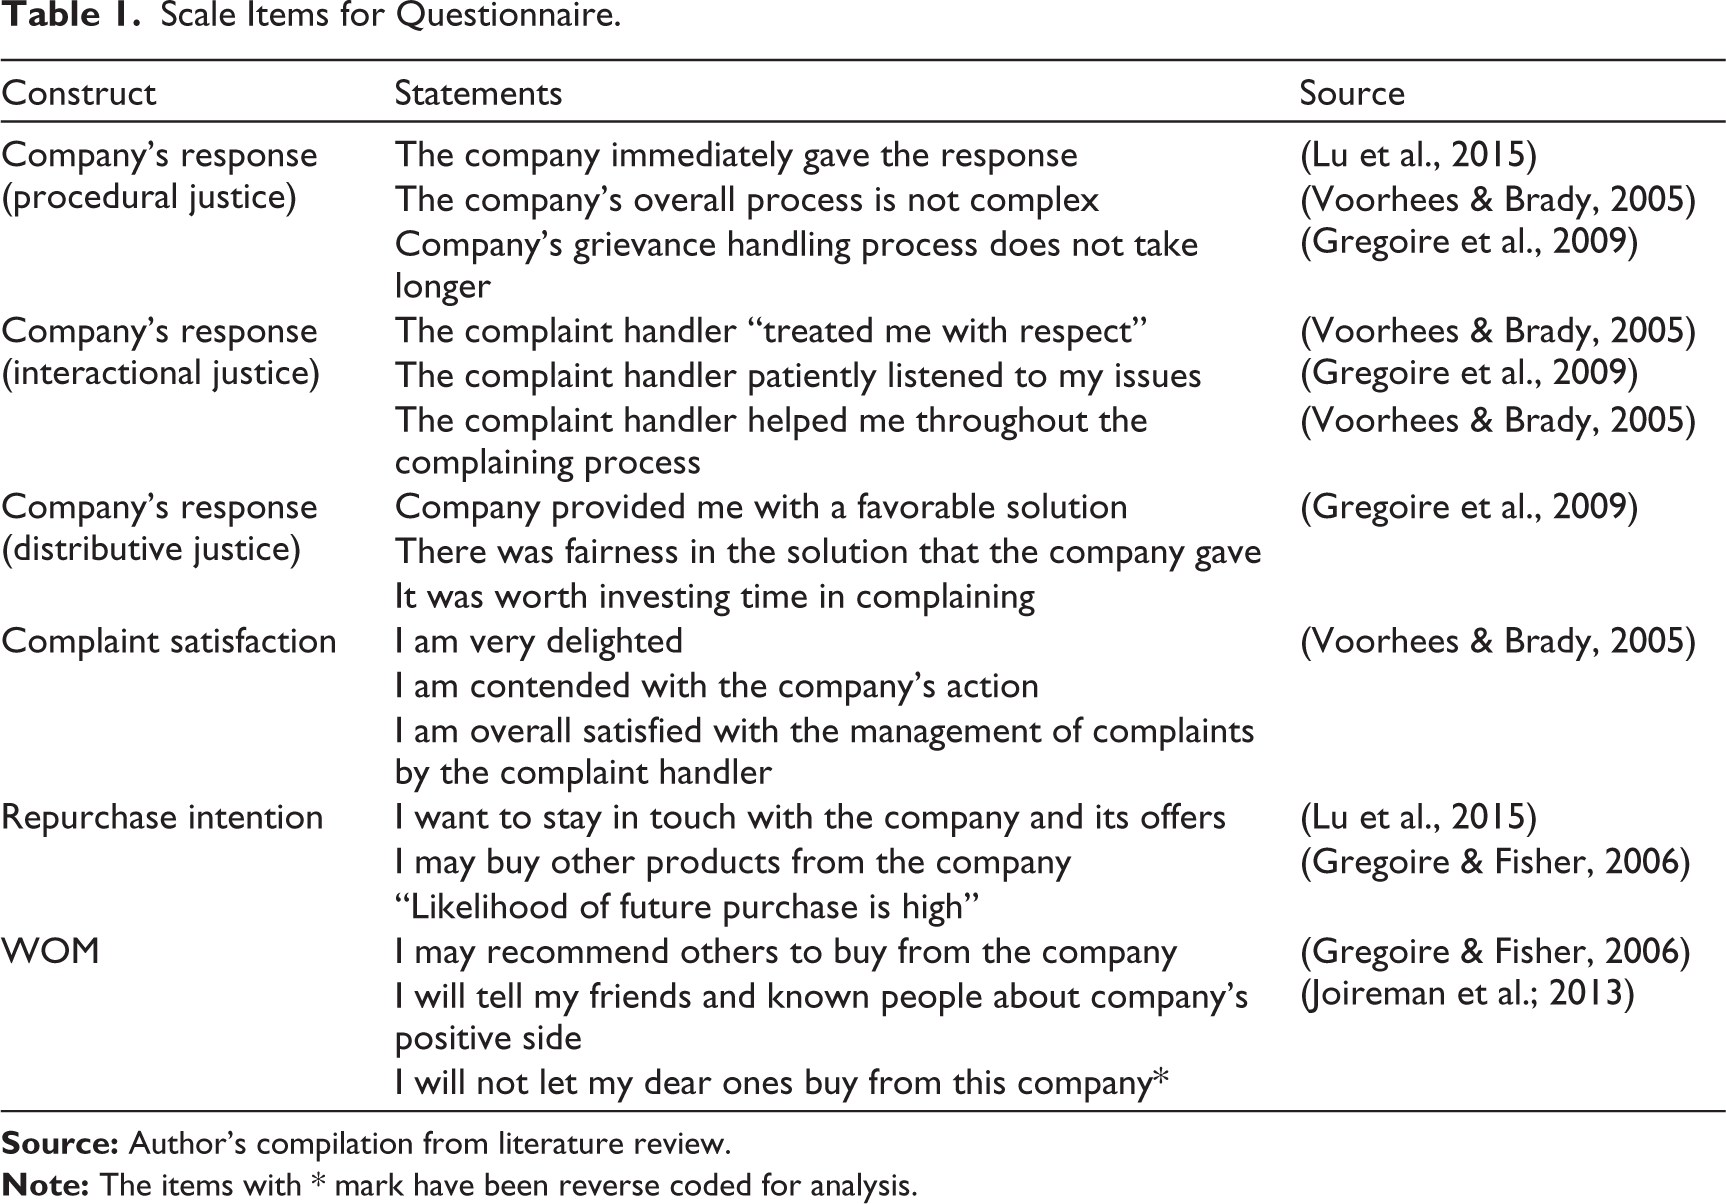
There are six constructs in the model, that is, procedural justice, interactional justice, distributive justice, complaint satisfaction, repurchase intention and WOM. The scale was developed using the following statements:
Table 1 shows the scale items adapted from various sources. Due to the difference in the perception of consumers and the company, it is neither feasible nor justified enough to consider information provided directly by the company. Thus, in the form of justice perception, the company’s response has been measured. The three dimensions are measured differently and not together, because a person may have positive procedural justice but a negative interactional justice, thus these three dimensions are measured separately as a separate construct.
Scale Items for Questionnaire.
Analysis and Findings
Demographics (Respondent’s Profile)
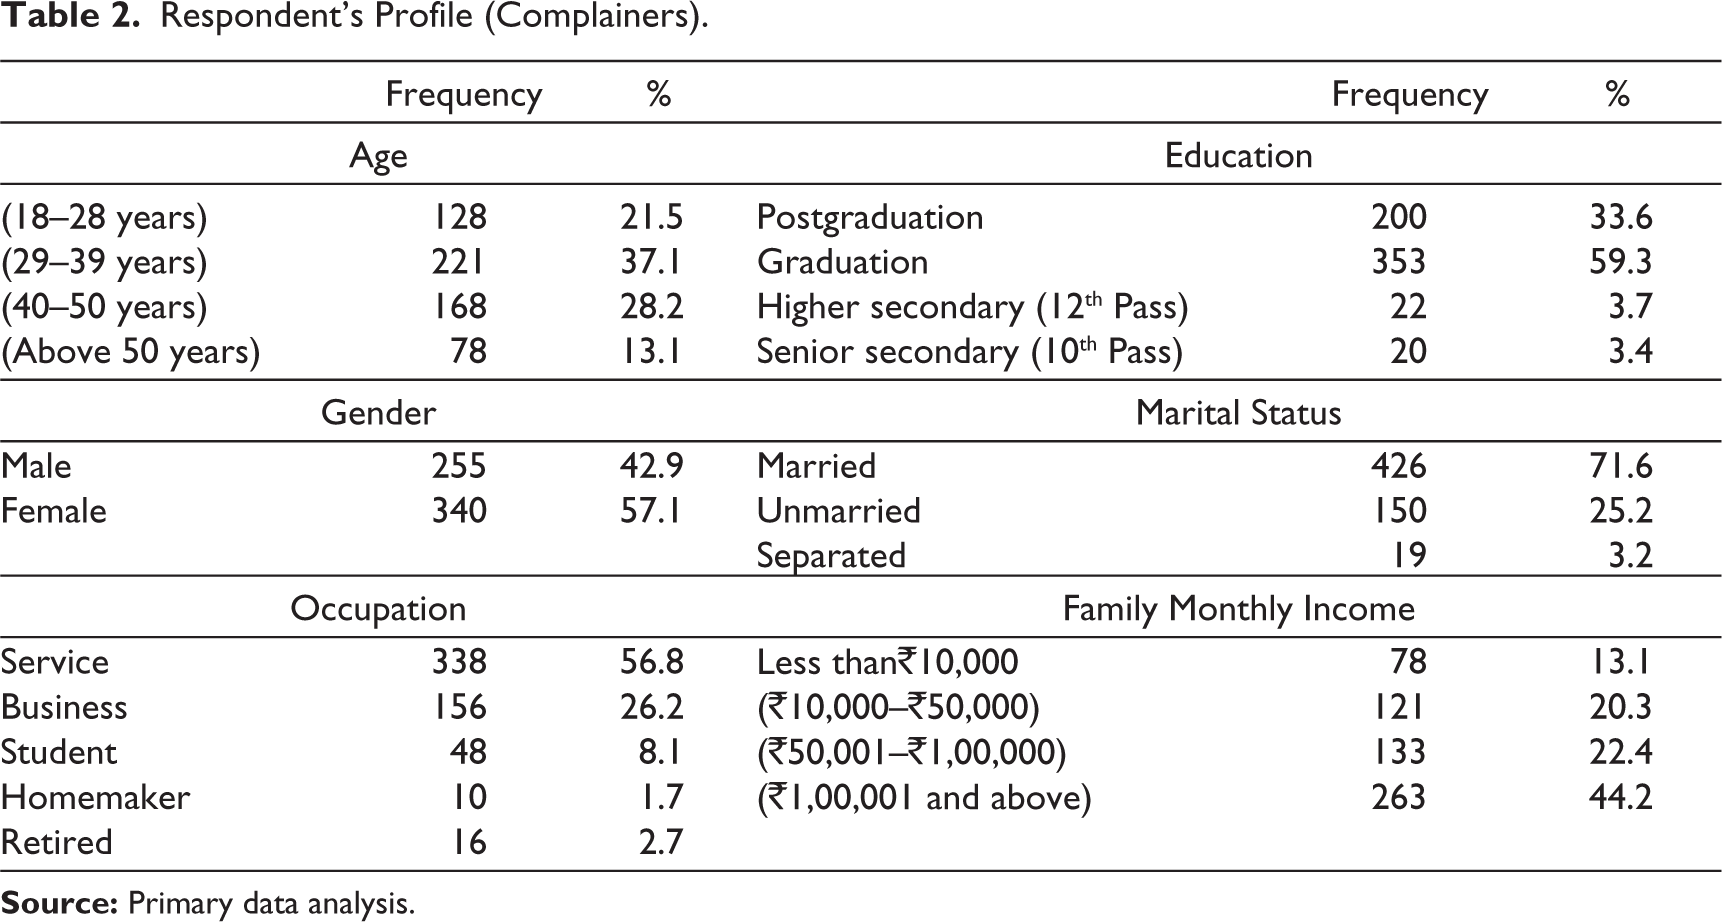
Table 2 describes the demographic characteristics of respondents (complainers). Approximately, 43% of respondents were male and 57% were female. The total number of respondents was 595 who faced problems and complained to the company for resolving issues.
Respondent’s Profile (Complainers).
Model Estimation
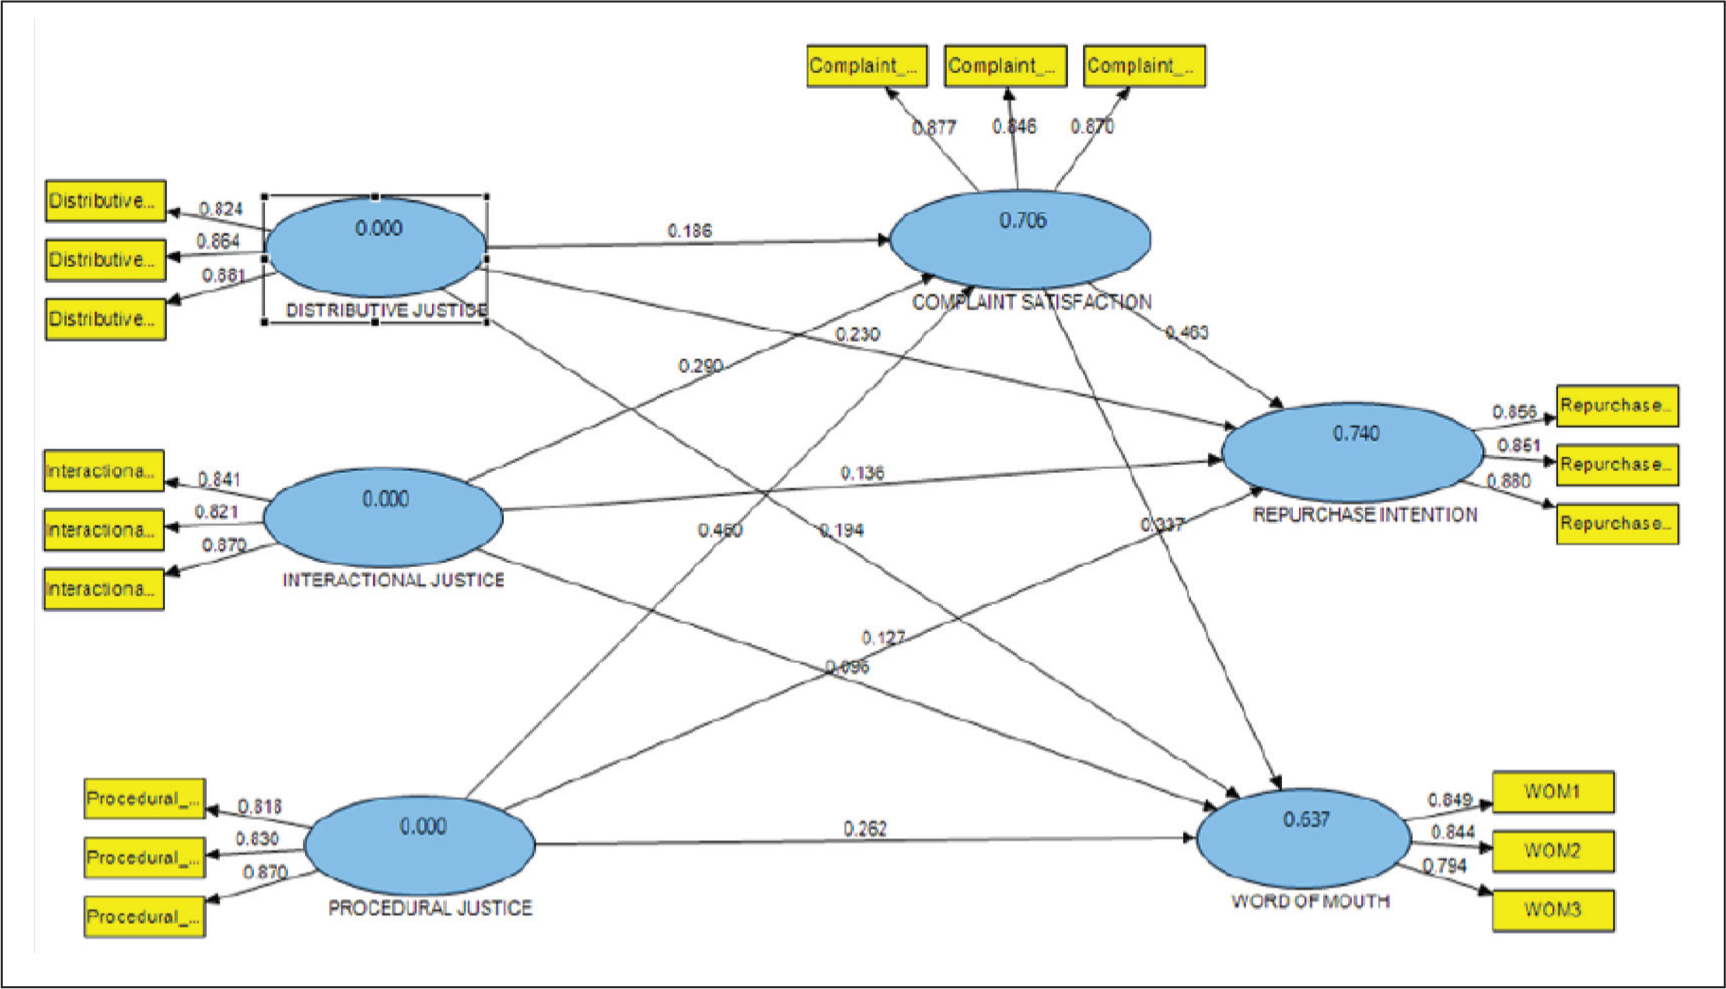
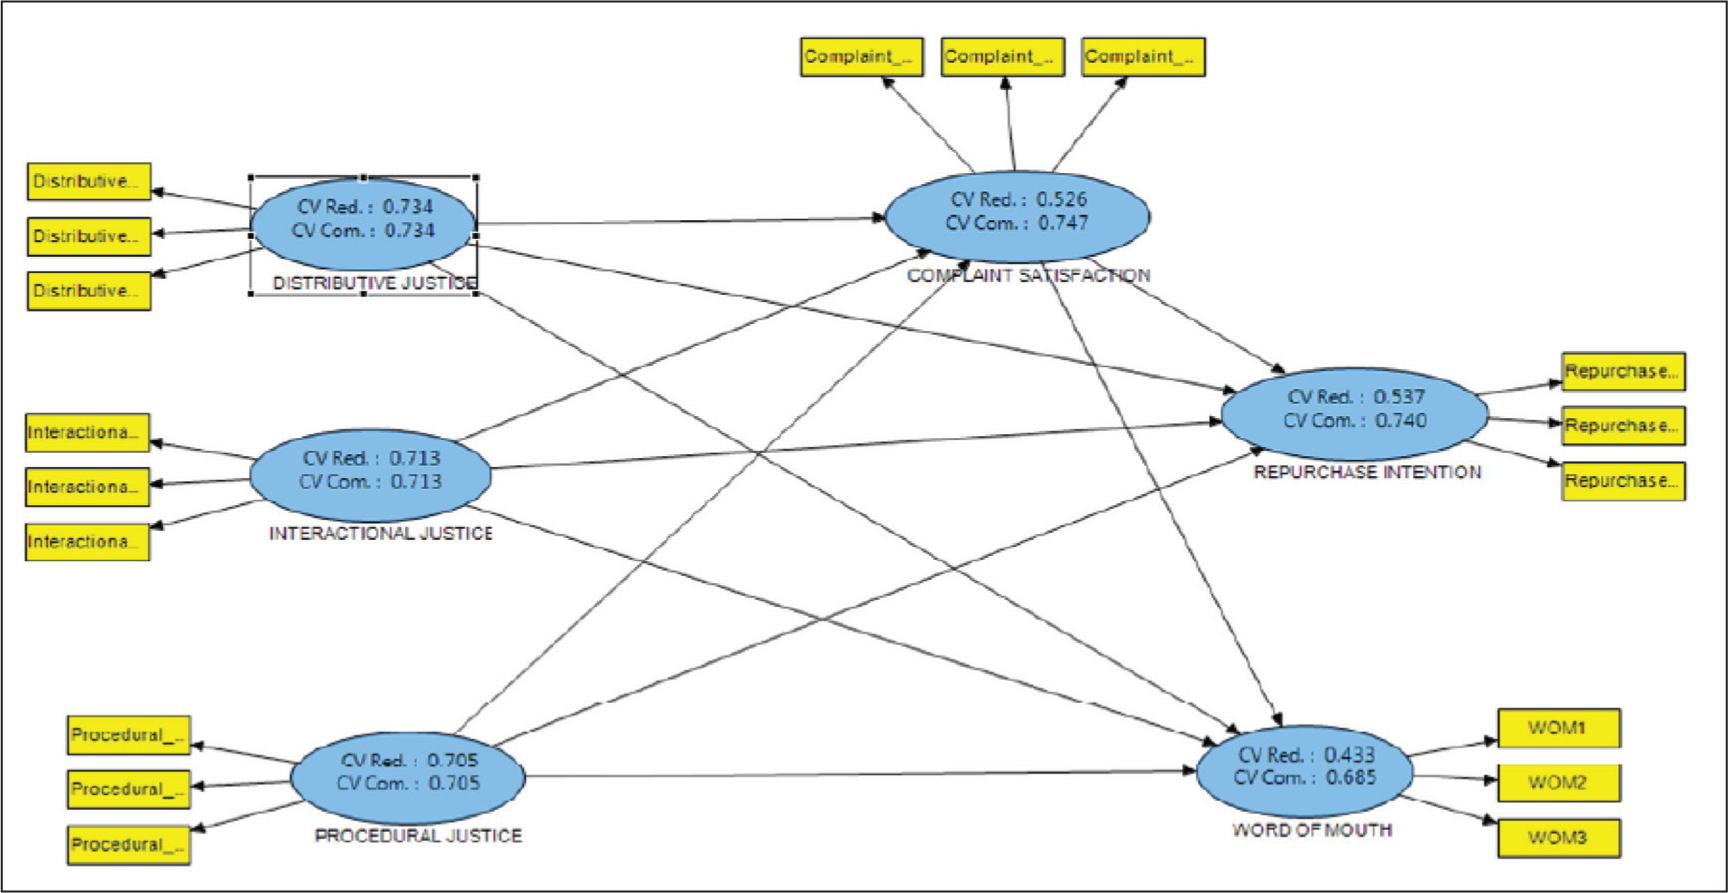
Using smartPLS-2 the data was analysed (Ringle et al., 2005). In Figure 2 distributive justice perception, interactional justice, and procedural justice are independent variables and repurchase intention, and WOM are dependent variables. Distributive justice perception was loaded on three statements, interactional justice was loaded on three statements, procedural justice was loaded on three statements, repurchase intention was loaded on three statements, WOM was loaded on three statements, and customer satisfaction was loaded on three statements.
Assessment of Reflective Measurement Model
Figure 2 shows the result of the partial least squares (PLS) algorithm, where 74% of the variance in repurchase intention is explained through customer complaint satisfaction, distributive justice perception, interactional justice and procedural justice. A value of R2 equal to 0.50 or above is considered good (Hair et al., 2016) and in this case, the R2 value is larger, that is, 0.74, therefore it can be inferred that R2 has high explanatory power. Around 63.70% of the variance in WOM is explained through customer satisfaction, distributive justice perception, interactional justice, and procedural justice. In this case, the value of R2 is 0.49 which is closer to 0.50 and thus may be inferred that R2 has high explanatory power.
The reflective measurement model was assessed and its four important tests were conducted namely Internal consistency, Reliability test, Convergent Validity and Discriminant validity (Hair et al., 2009; Petter et al., 2007). To attain composite reliability, the value for each construct should be above the threshold value, that is, 0.70. In Table 3 under the composite reliability column, all the values are above 0.70, thus composite reliability is also met. Convergent validity is assessed by comparing average variance explained (AVE) values with threshold values, that is 0.50. The AVE column shows that all the values are above 0.50, thus this criterion is also met. Cronbach alpha test is meant for checking internal consistency where values above 0.70 are recommended and this criterion is also fulfilled. Communality is the “variance explained in a measured variable by the construct” (Hair et al., 2009). Redundancy shows the “ability of endogenous factors to predict the variance in indicators of dependent factor” (Garson, 2016).
Convergent Validity and Composite Reliability.
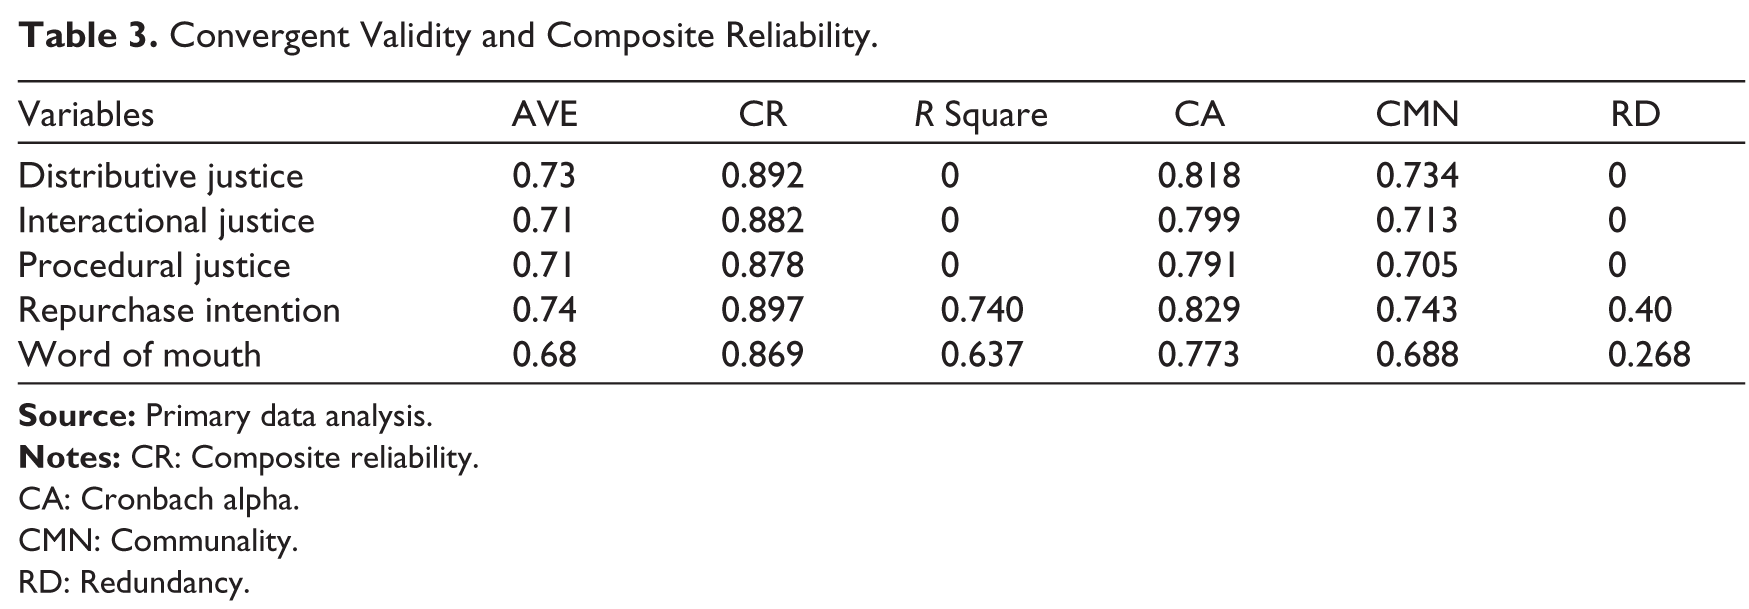
CA: Cronbach alpha.
CMN: Communality.
RD: Redundancy.
The criterion for checking individual indicator reliability is that all the values of outer loadings under reflective construct must be above 0.70. Table 4 shows that all values are above 0.70, thus Individual indicator reliability is also verified.
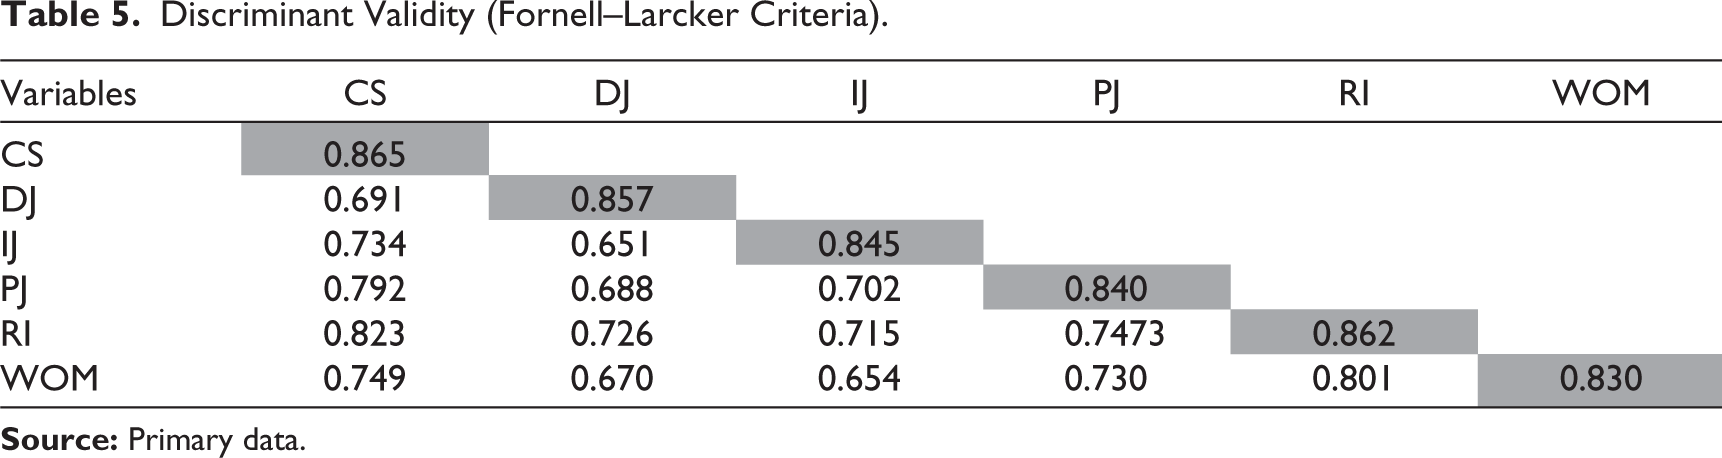
The discriminant validity was checked through the Fornell-Larcker criteria. According to the Fornell-Larcker criterion, all the diagonal values highlighted in Table 5 shall be greater than corresponding rows and column values (Fornell & Larcker, 1981). This criterion is also met as all the diagonal values are greater than corresponding rows and column values (Pearson correlations) and hence discriminant validity is also verified. The diagonal values in Table 5 are calculated as follows:
Discriminant validity = √AVE
Individual Indicator Reliability.
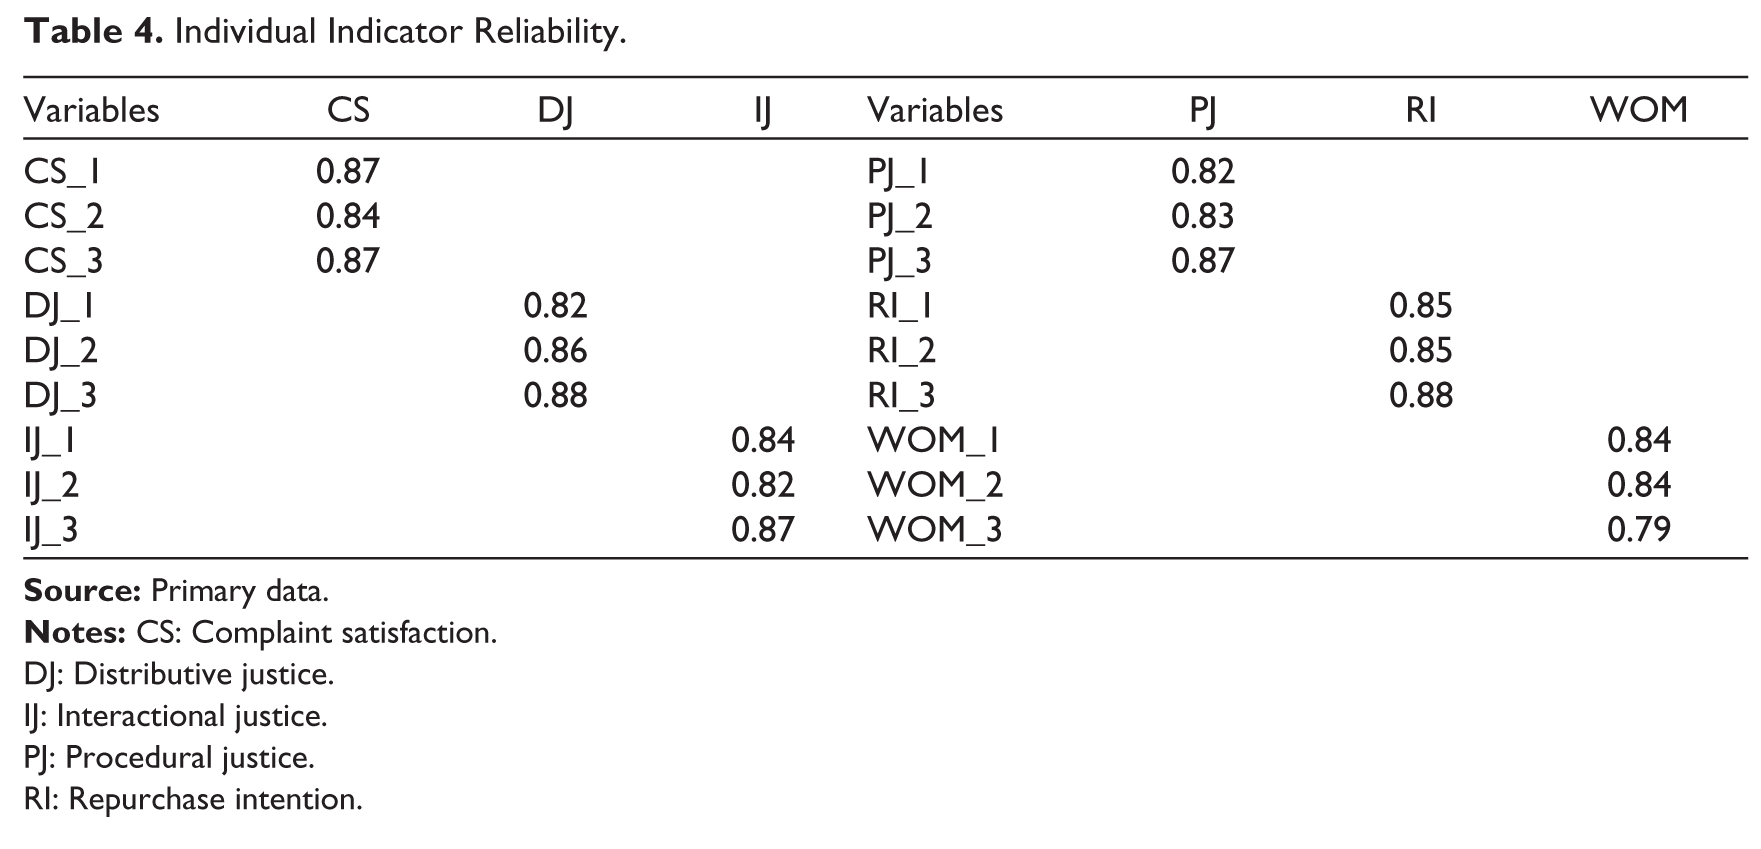
DJ: Distributive justice.
IJ: Interactional justice.
PJ: Procedural justice.
RI: Repurchase intention.
Discriminant Validity (Fornell–Larcker Criteria).
Structural Model Measurement Assessment
To assess the validity of the structural model various parameters were checked that is, collinearity, significance and relevance of structural model relationships, coefficient of determination (R2), effect size (F2), and predictive relevance (Q2).
Multicollinearity
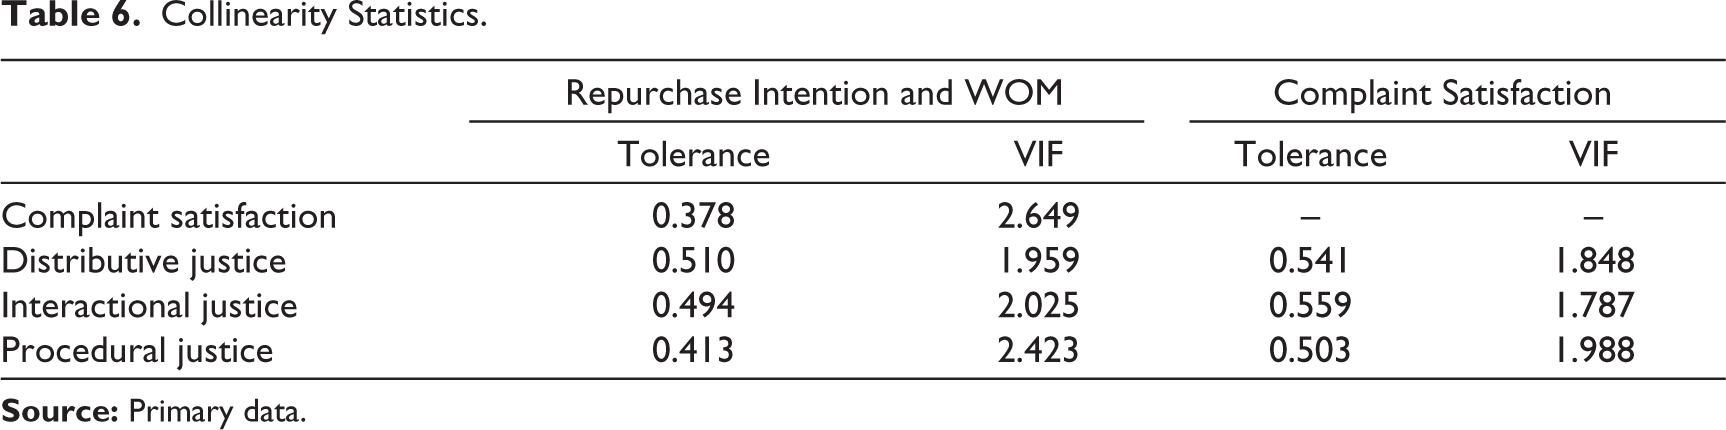
Multicollinearity is an issue where two or more constructs have collinearity and thus results may not be correct. For such issues, the variance inflation factor (VIF) value is checked and the VIF value for each construct should be less than 5 (Hair, et al., 2019; Wong, 2013). The collinearity is checked in two sets that is, in the first set repurchase intention and WOM is the dependent variable and in the second set complaint satisfaction is the dependent variable. The result shows that all values are below “5” and hence there are no collinearity issues (Table 6).
Collinearity Statistics.
Significance and Relevance of Structural Model Relationships
The PLS algorithm alone does not display the complete information that is required for data analysis. Thus, for significance or t-statistics calculation, the bootstrapping option is run for understanding the relationship between the constructs of the structural model. The critical t values at significance levels 1%, 5%, and 10% are 2.57, 1.96, and 1.65 respectively (two-tailed test). Table 7 shows that every relationship is significant at 5% significance level.
Bootstrapping and Path Analysis.
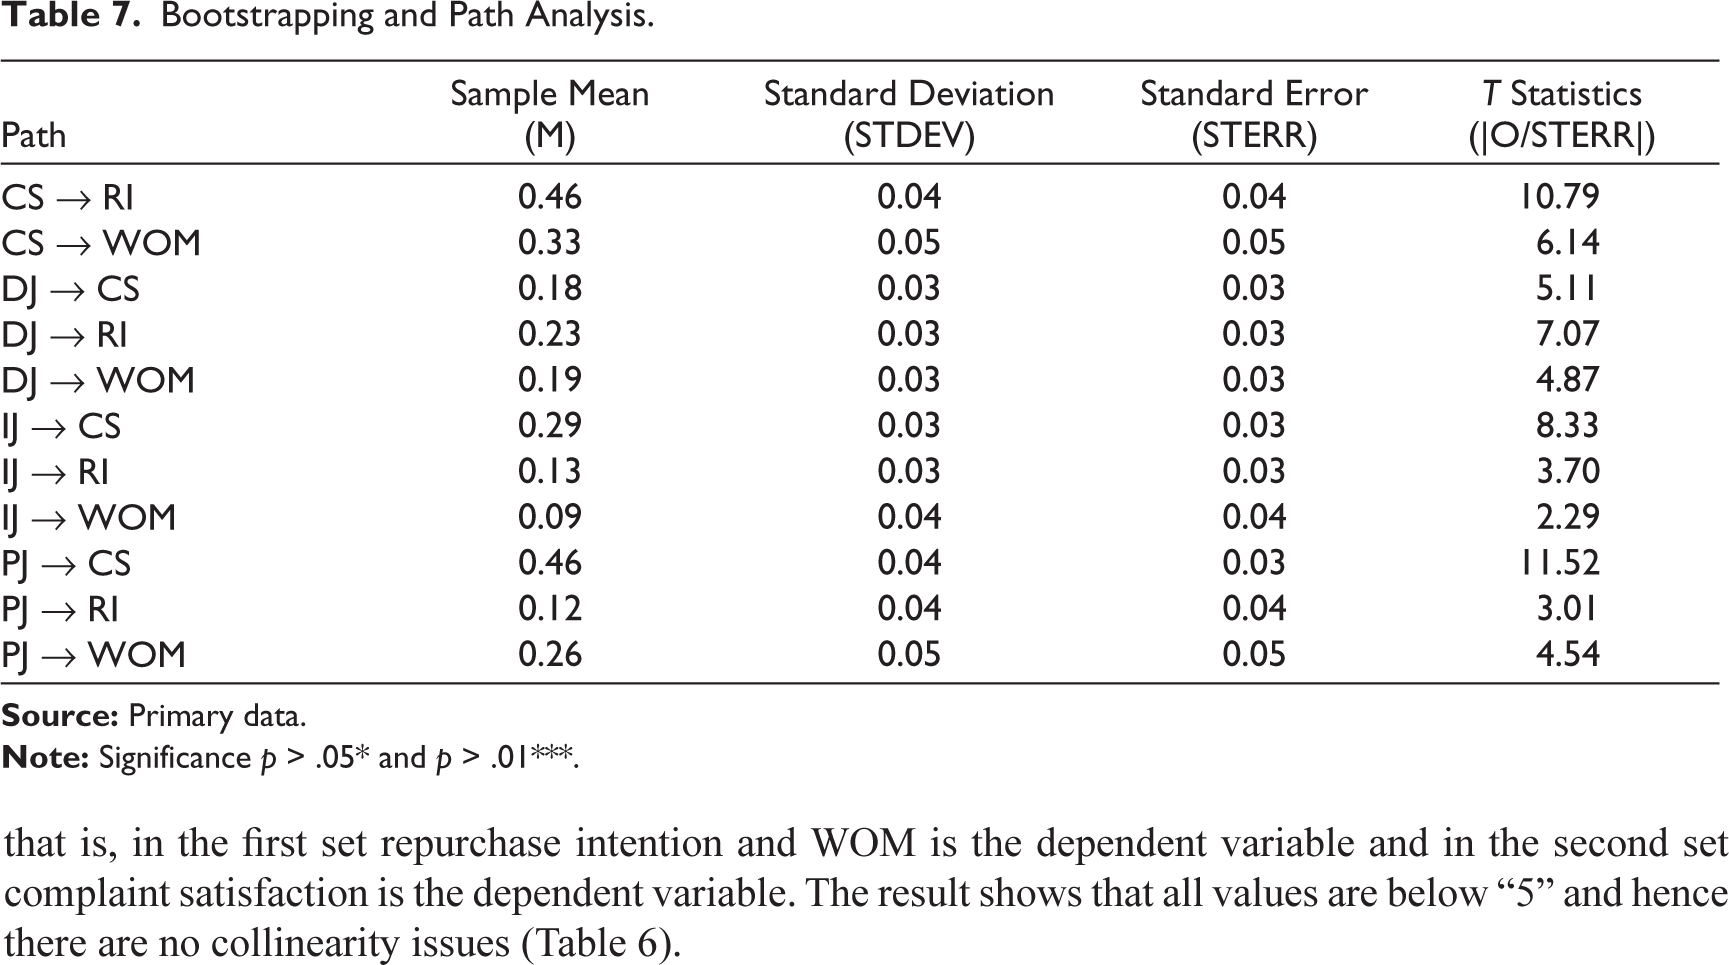
Path coefficient values show which factor has greater influence over the dependent variable. Table 7 shows that customer satisfaction has a greater impact on repurchase intention. Also, procedural justice has a greater influence on the complaint satisfaction level of consumers.
Coefficient of Determination (R2)
It shows the predictive accuracy of the structural model (Hair et al., 2009) and it is a squared correlation between actual and predicted values. R2 values range between 0 and 1 and values closer to one depict higher predictive accuracy (Hair et al., 2016). The results show moderate predictive accuracy as the R2 value is between 0.75 and 0.50.
Effect Size (F2)
It shows the change in R2 when any exogenous construct (independent variable) is removed from the model so as to see whether the removed construct has any substantive impact over endogenous constructs. F2 may have the following values that is, 0.02 (small effect size), 0.15 (medium), and 0.35 (large) (Cohen, 1988).
As per Cohen’s (1988) effect size criteria, complaint satisfaction plays a greater role in influencing repurchase intentions and positive WOM (although small effect size as per Cohen’s criteria can be seen in Table 8, that is, 0.25 and .09, respectively). Also, procedural justice influences complaint satisfaction more as compared to interactional and distributive justice (although small effect size as per Cohen’s criteria can be seen in Table 8). But in the case of direct effect over repurchase intentions and positive WOM, distributive justice (among all three dimensions) has a greater impact.
Effect Size (f 2) and Predictive Relevance (Q2).
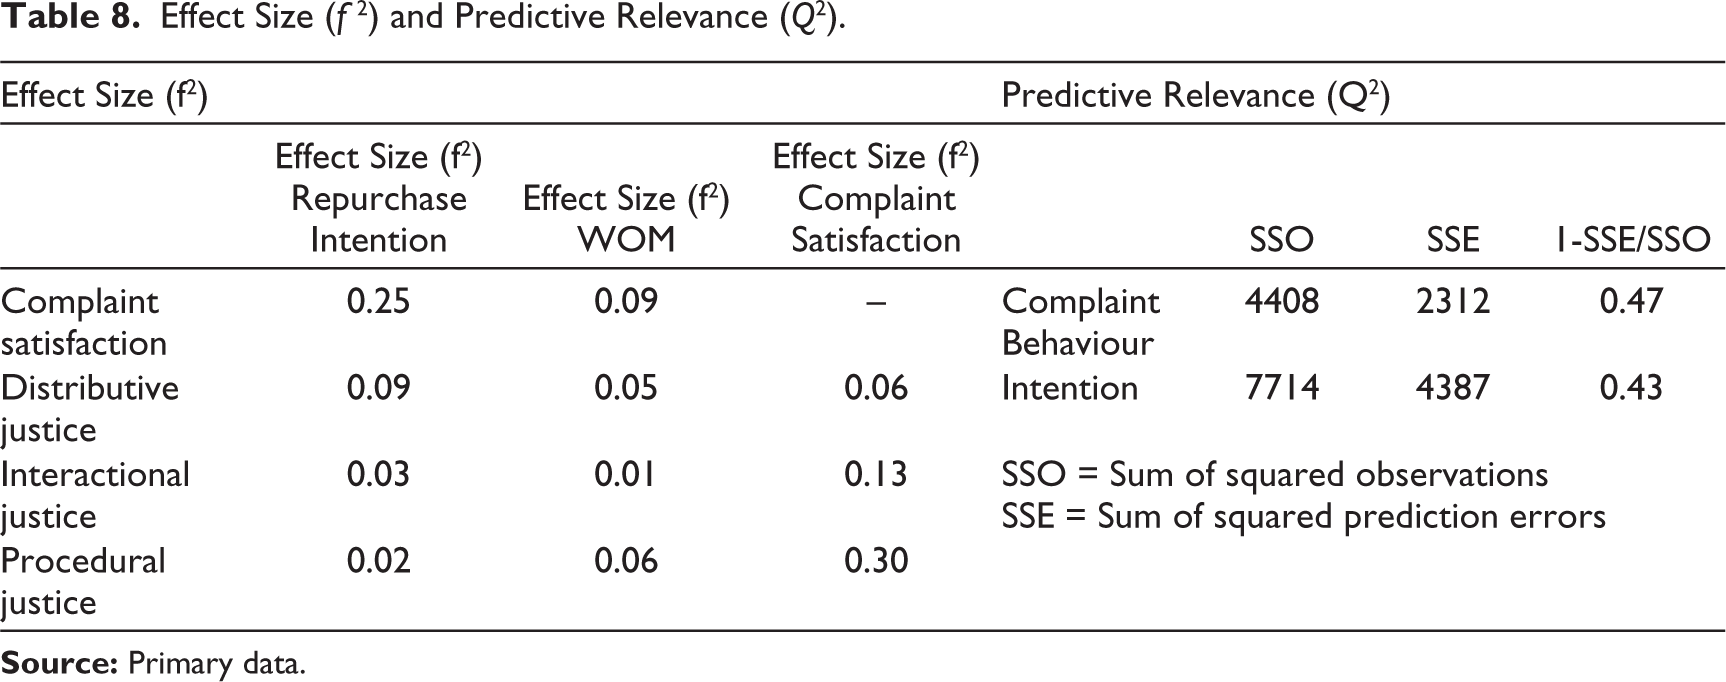
Predictive Relevance (Q2)/Construct Cross-validated Redundancy
Q2 explains the predictive relevance whereas R2 explains predictive accuracy. The value of Q2 should be greater than “0” (Chin, 1998). Figure 3 and Table 8 shows that the Q2 value is greater than “0” for dependent variables repurchase intention and WOM. Therefore, the proposed model has predictive relevance.
Mediation Analysis
There are two methods for studying the mediation effect. The first is to check whether the bootstrapping results (i.e., the significance level of relationships) remain the same or not with and without the mediator. If the relationship still exists then there is partial mediation and if the relationship becomes insignificant after removing the mediator then there is a full mediation effect. The results showed that there is a partial mediation effect of “complaint satisfaction.”
The second method (Table 9) for checking mediation effects is the variance accounted for (VAF) value method. VAF value is calculated by dividing the indirect effect coefficient by the total effect coefficient. If the VAF value ranges between 0.20 and 0.80 then there is partial mediation (Hair et al., 2009) and if above 0.80 then full mediation, if below 0.20 then no mediation effect (Wong, 2016). In Table 9, VAF value is between 0.20 and 0.80, therefore there is a partial mediation effect of “complaint satisfaction”. The Table 10 shows the summary of result derived from statistical analysis, where all the hypotheses are accepted.
Mediation Effect Summary.
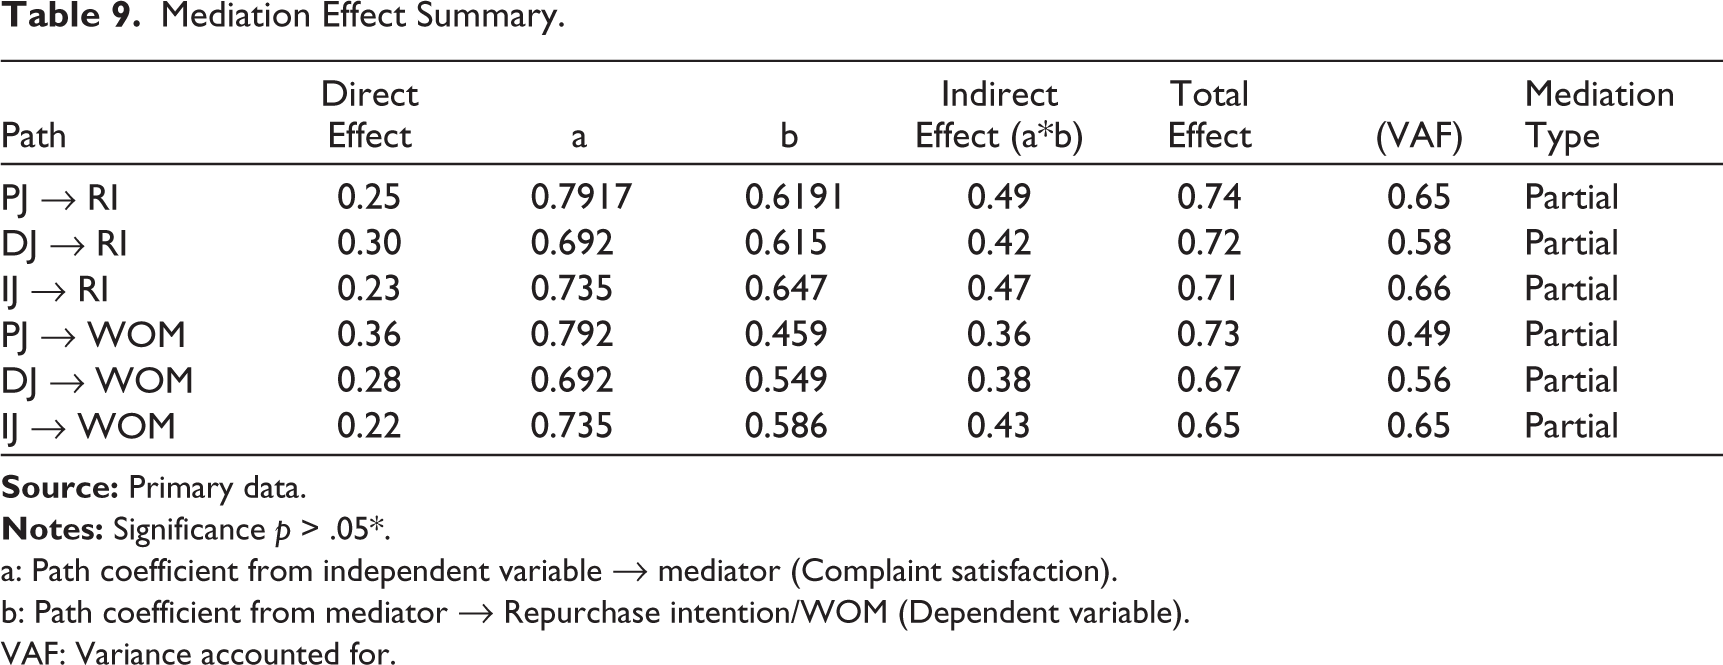
a: Path coefficient from independent variable → mediator (Complaint satisfaction).
b: Path coefficient from mediator → Repurchase intention/WOM (Dependent variable).
VAF: Variance accounted for.
Result Summary.
Multi Group Analysis
SmartPLS 2.0. (Ringle et al., 2005) the software does not provide a mechanism for testing significant differences among various group categories. Thus, IBM SPSS software (IBM, 2011) was employed to understand the differences among various categorical variables.
Age
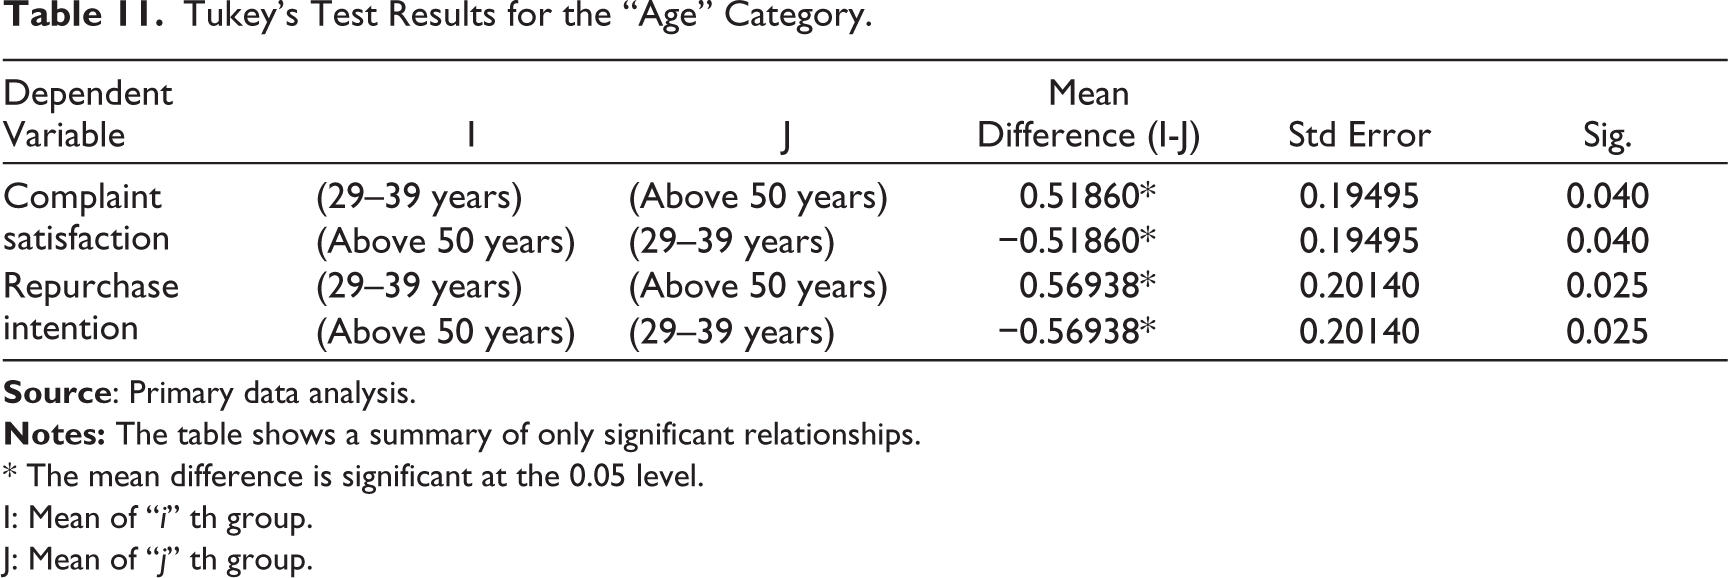
Table 11 below displays the results of only those group categories which are significantly different. The first group is the Age category and it was tested whether there is a significant difference in complaint satisfaction, repurchase intention and WOM among the four age categories or not. In addition to this, it was also tested whether there is a difference in perceived justice dimensions across various age categories or not.
Tukey’s Test Results for the “Age” Category.
* The mean difference is significant at the 0.05 level.
I: Mean of “i” th group.
J: Mean of “j” th group.
The results of the Tukey honestly significant difference test showed that there is a significant difference in complaint satisfaction and repurchase intentions between early adulthood consumers (29–39 years) and old-aged consumers (above 50 years). The mean difference signifies that old-aged consumers (above 50 years) were highly satisfied with complaint management and had high intention to repurchase from the same company. Whereas, early adulthood consumers (29–39 years) were less satisfied with complaint management and had lower intention to repurchase from the same company. However, there was no significant difference in their perceived justice dimension which means that both groups perceive the company’s response in a similar manner but were different in satisfaction and repurchase intention. Also, there was no significant difference in perceived justice, complaint satisfaction, repurchase intention and positive WOM intention among young consumers (18–28 years) and late adulthood consumers (40–50 years).
Gender
Levene’s test for equality of variances (homogeneity test) provides the significance value for interpretation. Table 12 shows that there is a significant difference in perceived justice perception, interactional justice perception, complaint satisfaction, repurchase intention and WOM across categories of Gender. It can be inferred that females are more satisfied with complaint resolution such that they have higher repurchase intention and would spread positive WOM. This also means that it is easy to convert the dissatisfaction of females into satisfaction through effective complaint management.
Independent Samples Test for Gender.
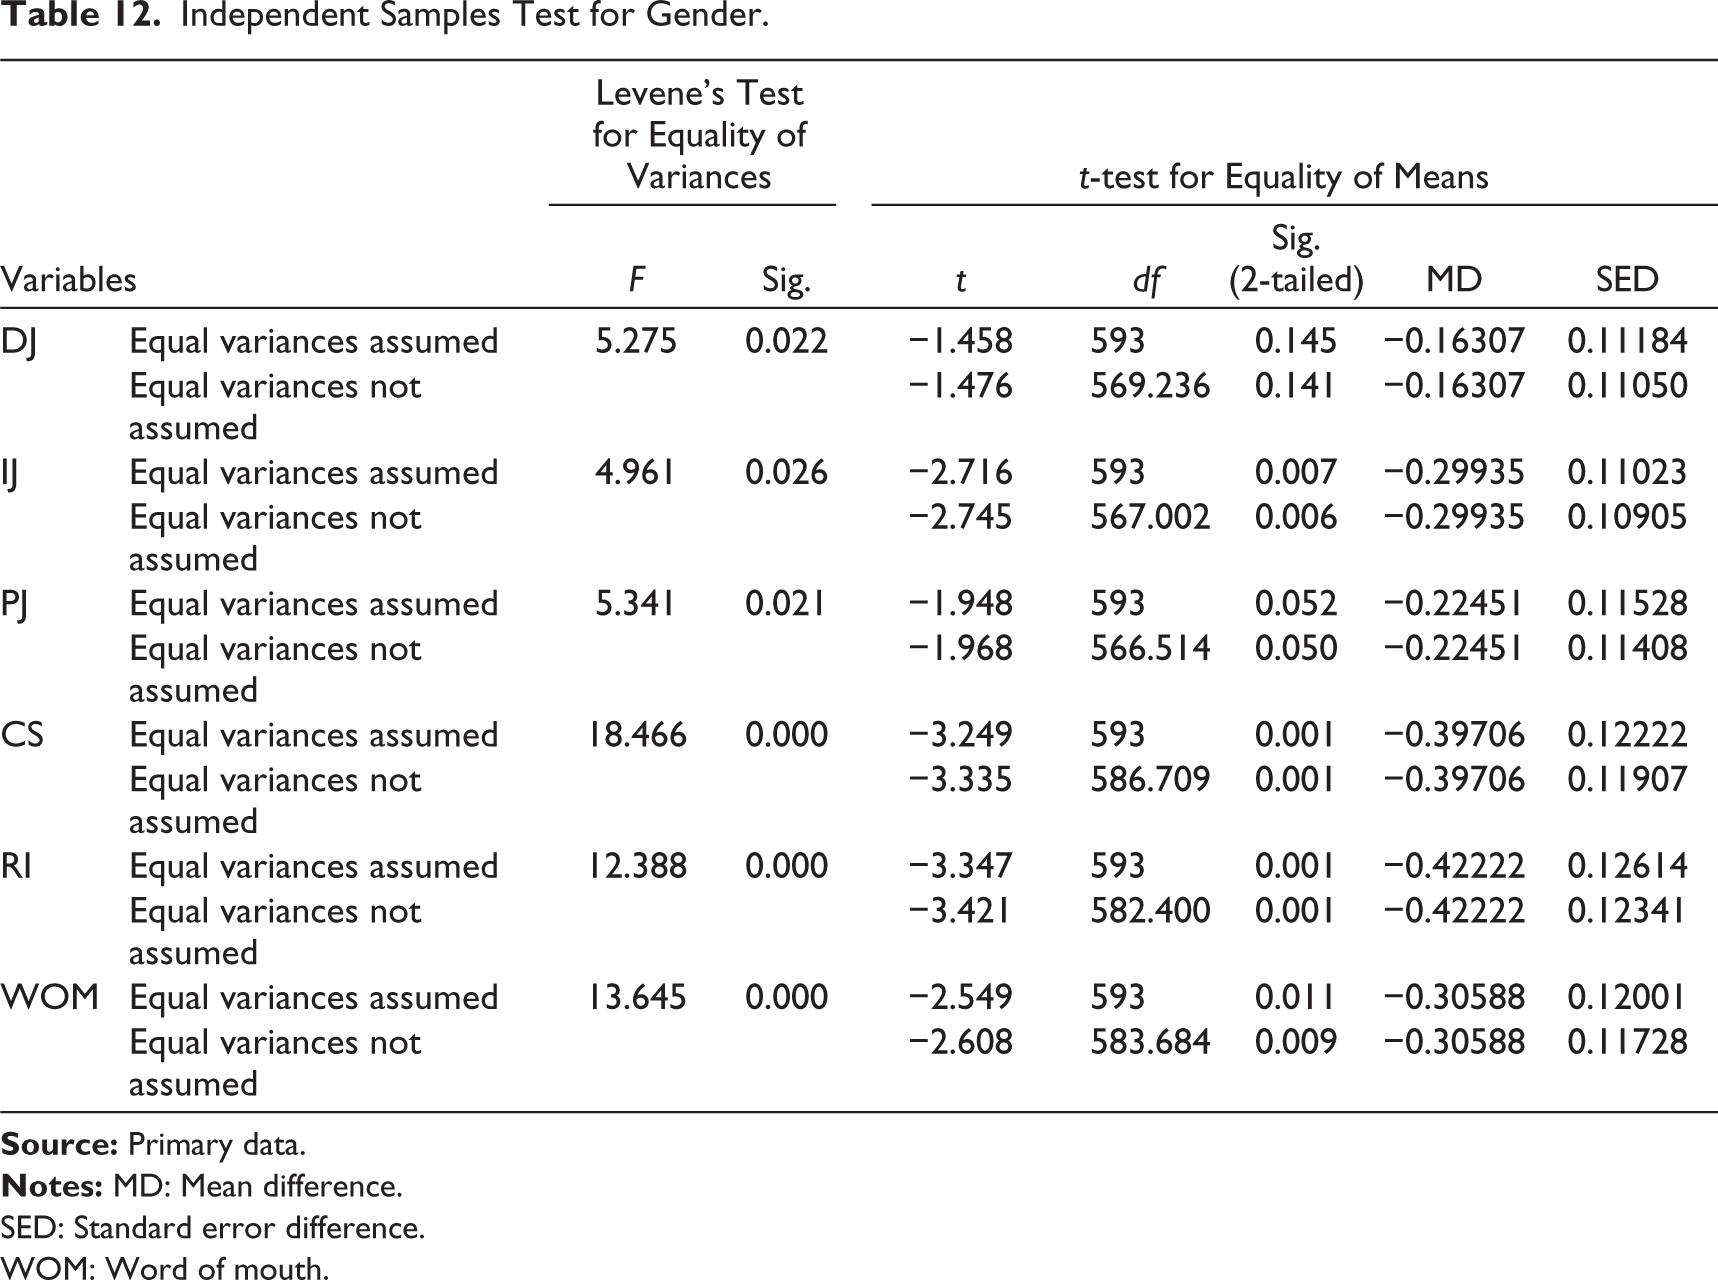
SED: Standard error difference.
WOM: Word of mouth.
The results show that there is no significant difference in distributive justice, perceived justice, interactional justice, complaint satisfaction, repurchase intention and WOM across categories of marital status, education, occupation and monthly family income (Table 13).
Multi Group Analysis Summary.
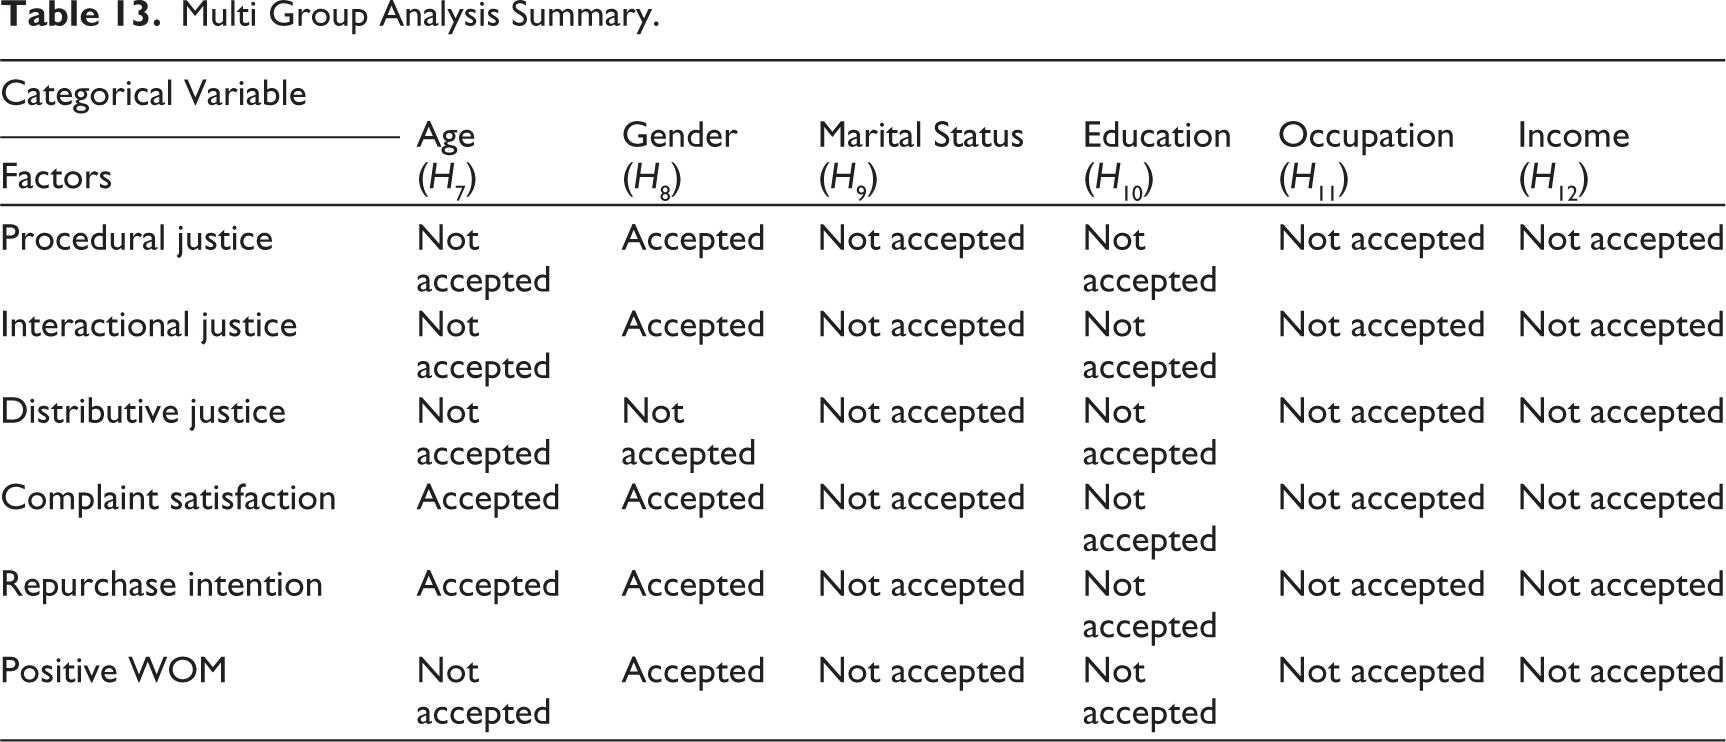
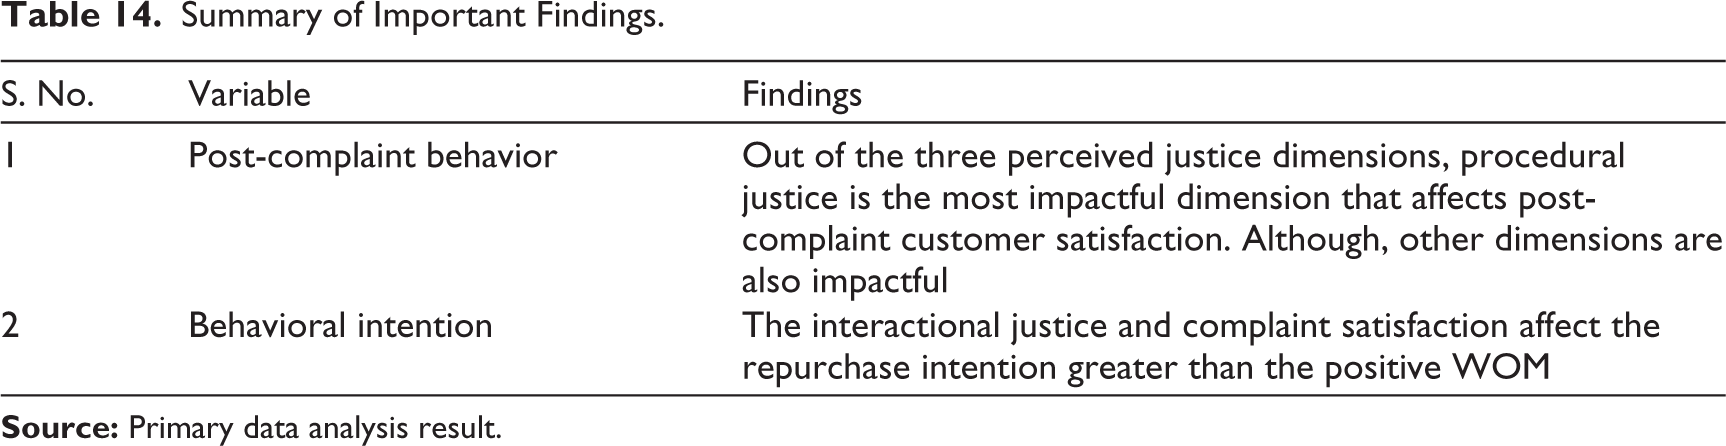
Table 13 shows that only fewer relationships are significant in the proposed model framework. The level of complaint satisfaction and repurchase intentions of early adulthood consumers (29–39 years) and old-aged consumers (above 50 years) are different. The analysis disclosed that old-aged consumers (above 50 years) are highly satisfied with complaint management and have high intention to repurchase from the same company. Whereas, early adulthood consumers (29–39 years) seem to be less satisfied with complaint management and possess lower intention to repurchase from the same company. Thus the post complaint satisfaction differs only across age and gender categories. The Table 14 shows the summary of findings of the study which states that procedural and interactional justice are most important dimensions.
Summary of Important Findings.
Conclusion
The CCS model was successfully tested on consumers of electronic items and it was found that procedural justice has a major impact on complaint satisfaction as compared to other justice dimensions. A reason could be the suffering and pain that a consumer has to go through while complaining because it leaves an impact on their mental peace. This also means that whether the company gives adequate compensation or not, the process should be simple and fair for all consumers. The key conclusion is that the customer’s desire to share positive WOM increases when the customer is satisfied with the complaint resolution. However, complaint satisfaction has a greater impact on repurchase intention as compared to WOM (Garg et al., 2013). This also clarifies that if a customer wishes to repurchase from the same brand, he or she may be involved in persuading others to do the same. Another factor might be the diminution of cognitive dissonance or the reinforcement of one’s beliefs. Another finding is that complaint satisfaction is a partial mediator between the company’s response and repurchase intention; the company’s response and WOM. This means that the three justice perceptions, that is procedural, distributive and interactional have both direct and indirect influence on repurchase intention and WOM. The study has linked organizational behavior to consumer behavior concepts as both are based on psychology.
Limitations
There is much more to learn about the numerous parameters that might impact CCS. The information might be acquired from companies that have an excellent complaint management system. This approach has only been applied in the electronic sector, but it may be applicable to other industries as well. The outcomes may vary.
Footnotes
Declaration of Conflicting Interests
The authors declared no potential conflicts of interest with respect to the research, authorship, and/or publication of this article.
Funding
The authors received no financial support for the research, authorship, and/or publication of this article.