
Abstract
Studying sentiment is crucial for investors and portfolio managers to determine whether sentiment can be used as information to make profits. This study examines the relationship between irrational sentiment among investors and excess returns in the Indian stock market using monthly data from July 2001 to December 2019. The study constructs a composite sentiment index that includes condensed information from 10 variables. The empirical analysis reveals that the influence of irrational sentiment among investors on excess returns in the stock market is not uniform across quantiles. Specifically, our results indicate that the irrational sentiment index has information regarding contemporaneous (future) variation in excess returns in upper (all) quantiles. Results also suggest that the predictive ability of irrational sentiment is enhanced when market conditions are right. We also decompose the sentiment into positive and negative irrational sentiment and find an asymmetrical impact in upper quantiles but lost at lower quantiles.
Introduction
Date back to the early 1960s, classical finance theories, such as the efficient market hypothesis, believed that all traders are rational. These rational traders in the market respond quickly to any fresh information available to push prices close to fundamentals (Fama, 1965). However, literature on behavioral finance argues that investors may sometimes behave irrationally. Irrational investors trade on sentiment and create an opportunity for excess profit through mispricing securities. Rational investors or arbitrageurs will quickly grab these opportunities and correct this mispricing of securities. Despite the recognition of irrational traders, classical finance theories feel safe ignoring them in discussing asset price formation.
However, various market anomalies, like the October 1987 crash, the dot-com bubble of the 1990s, and a high degree of volatility experienced in markets in 2008, have cast doubts on investors’ rational behavior. Classical finance theories have a hard time explaining these anomalies, prolonged mispricing, and unexploited arbitrage opportunities.
Behavioral finance, on the other hand, challenges the notion of rationality. Behavioral finance postulates that investors may sometimes be irrational and prone to the sentiment of investors (Barberis et al., 1998; Brown & Cliff, 2005; De Long et al., 1990; Kumari & Mahakud, 2015; Naik & Padhi, 2016). Therefore, behavioral finance theory considers psychological biases and irrational behavior/sentiment of traders. These irrational behavior of investors are subject to noise trading (Black, 1986). Noise traders are not entirely rational, and they trade without the support of available information about the market fundamentals. Noise trading is unpredictable, which creates risks for arbitrageurs who bet against irrational traders. Due to this risk factor, there are limits to arbitrage from rational traders, and noise traders have significant potential to push prices away from fundamentals (Barberis & Thaler, 2003; Barberis et al., 1998; De Long et al., 1990; Kumar & Lee, 2006; Verma & Verma, 2007). Thus, investor sentiments and market excess return arguably influence one another. This argument has led to the empirical question. However, most empirical studies discuss investor sentiment in developed economies, whereas empirical studies on emerging economies are in the preliminary stage. Differences of opinion exist across researchers in the field of finance. Moreover, only a handful of studies examined the effect on market excess returns due to sentiment prevailing in the stock market at different quantiles of market excess returns. The present study, therefore, extends the literature by investigating this complex relationship at different quantiles.
The research article progresses as follows. The next section outlines theoretical underpinning with the review of related empirical literature, and accordingly, the testable hypotheses are developed. Then, the data and variables in this research are discussed, followed by the section that discusses the methodology adopted to analyze the data. The subsequent section of this research reports and discusses the empirical findings. The final section concludes this study.
Review of Related Literature
Theoretical Underpinning
The relationship between investor sentiments and stock market return can be understood from the noise traders theory and the behavioral finance theory highlighted in the previous section.
These theories also help us to understand the decomposition of investor sentiment into positive and negative sentiments. The noise traders theory also explains that positive and negative sentiments can directly impact excess returns through the price-pressure effect and the hold-more effect. Whether sentiments affect excess returns positively or negatively will depend upon which of the effects dominate. These two explanations can be briefly understood as follows.
Hold-more effect: When the sentiment of noise traders is bullish, they increase the holdings of risky assets. It leads to an increase in market risk and thereby increases excess returns. On the other hand, when the sentiment of noise traders becomes bearish, they decrease their holdings of risky assets. It leads to a decrease in market risk and thereby reduces excess returns. Bullish sentiment will lead to higher excess returns, and bearish sentiment will lead to lower excess returns (Lee et al., 2002; Thaler, 1993). Price-pressure effect: When noise traders are more bullish, their trade creates price pressure, which leads to a higher purchase price as compared to fundamental values and thereby lowers excess returns. When noise traders are more bearish, their trade creates price pressure, which leads to a lower sale price as compared to fundamental values and thereby lowers excess. According to the price-pressure effect, bullish and bearish sentiment will lead to lower excess returns (Lee et al., 2002; Thaler, 1993).
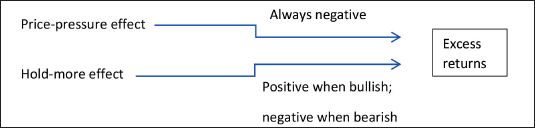
In the case when sentiment becomes bullish, the price-pressure effect negatively relates to excess returns, whereas hold more effect positively relates to excess returns. If the price-pressure effect dominates the hold-more effect then, bullish sentiment will lead to lower excess returns. If the hold-more effect dominates the price-pressure effect, then bullish sentiment will lead to higher excess returns. In case when sentiment becomes bearish, both the price-pressure effect and hold-more effect reinforce each other and impact expected returns negatively. That is, when sentiment becomes more bearish, it will lead to lower expected returns.
Review of Empirical Literature
Based on the framework provided by De Long et al. (1990), several researchers empirically examine the relationship between sentiment among investors and the stock market. Several studies find that investors’ sentiment has information regarding contemporaneous returns (Rupande et al., 2019). Recent studies discover a positive impact of investors’ sentiment on contemporaneous market returns (Aboura, 2016; Chuang et al., 2010; Naik & Padhi, 2016; Perez-Liston et al., 2016; Smales, 2017). This section reviews some of the empirical studies.
As discussed, the classical finance theory believes that investors are rational. In contrast, the noise trader’s theory and the behavioral finance literature explain that investors, sometimes ruled by emotions and noise, behave irrationally in stock trading. Thus, investors’ sentiment is decomposed into rational and irrational sentiment components. Verma and Verma (2007) focus on both components of investors’ sentiment. Their findings show that, compared to irrational sentiments, rational counterpart has a more significant and positive impact on stock returns. They further analyze this relationship between investors’ sentiment and market returns in different states of the economy, that is, expansionary and contractionary. Their analysis shows that sentiment affects market returns more in a growth period than recession. On the other hand, Smales (2017) documents that sentiments on stock returns are more extensive during the recession.
Qiang and Shu-e (2009) examine whether sentiments affect market returns in Shenzhen and Shanghai stock markets. They find no contemporaneous influence of investors’ sentiment on the Shanghai stock market returns, but it exists in the Shenzhen stock market. The relationship between investors’ sentiment and market returns is also consistent in time. For example, Dash and Maitra (2018) use the wavelet approach to find that sentiment strongly affects stock returns in the short run as well as the long run.
Anusakumar et al. (2017) study the bearing of market-specific sentiment on returns in emerging Asian markets. Market-specific sentiment has a positive influence on India, Taiwan, and South Korea stock markets, whereas a negative impact on China, Indonesia, Malaysia, and Philippines stock returns. Market-wide sentiment has shown no significant impact on Thailand’s stock market returns.
Findings from the existing studies are not uniform and differ substantially. Evidence on market efficiency in terms of investor sentiment is ambiguous. The present study thus reexamines it in the context of the Indian stock market. Accordingly, the null hypothesis has been developed as follows.
Ho1: The irrational sentiment does not affect the stock market return. Ha1: The irrational sentiment significantly affects the stock market return.
Second, investors may have pessimistic or optimistic about the market. One can wonder whether optimism and pessimism have distinct effects on excess returns. The literature often claims that positive sentiments and negative sentiments have an asymmetric influence on excess returns. Haritha and Rishad (2020) and Naik and Padhi (2016) document that positive sentiment indices affect excess returns positively, and negative sentiments affect them negatively. Naik and Padhi (2016) find that negative sentiment index has a more significant impact on returns as compared to positive index. However, Haritha and Rishad (2020) find that negative sentiment index has a lesser influence on excess returns compared with positive sentiments.
This study, therefore, aims to see how positive and negative sentiments have an influence on excess returns at different quantiles of excess returns. This leads to our second hypothesis:
Ho2: There is no significant different impact of positive and negative irrational sentiments on excess returns. Ha2: There is a significant asymmetric impact of positive and negative sentiments on excess returns.
One can further question how these sentiments emerge among investors. It is reasonable to believe that returns prevailing in the stock market can cause sentiments. Studies such as Brown and Cliff (2005), Solt and Statman (1988), and Wang et al. (2006) explored that sentiments are triggered by returns in the stock markets. Dash and Maitra (2018); Lux (2011); Naik and Padhi (2016); and Schmeling (2009) record a feedback association between sentiment and market returns. This motivates us to test the following hypothesis:
Ho3: Market excess returns do not have a significant impact on bringing the irrational sentiment in the market. Ha3: Market excess returns significantly impact on bringing the irrational sentiment in the market.
As investor sentiment impacts excess returns, investor sentiment could be used as a forecaster of excess returns. Wang et al. (2006) observe little support that sentiment forecasts return. Besides, a strand of literature finds no support for the hypothesis that sentiment predicts excess returns (Bekiros et al., 2016; Brown & Cliff, 2004; Chuang et al., 2010; Dash & Maitra, 2018; Huang et al., 2015).
Some studies show a negative bearing of investors’ sentiment on future excess returns. Future returns are lower after periods of high sentiments as markets revert to fundamental values (Brown & Cliff, 2005; Qiang & Shu-e, 2009; Sadaqat & Butt, 2016; Schmeling, 2009; Smales, 2017). Fisher and Statman (2000) document that the level of sentiments of wall street strategists and individual investors is a trustworthy contrary indicator of future S&P 500 returns. Chung et al. (2012) find that investors’ sentiments have significant power to predict stock returns only in the economy’s expansionary regime and that investors’ sentiments have insignificant power to predict excess market returns. Hengelbrock et al. (2013) find sentiment among investors is a contrarian indicator of the future returns of the U.S. stock market, whereas German sentiment and future returns of the German stock market are positively associated. There are different opinions on whether stock prices positively predict excess returns or negatively predict excess returns. This leads to our next hypothesis.
Ho4: Irrational sentiment does not predict future excess returns in the Indian stock market. Ha4: Irrational sentiment can predict future excess returns in the Indian stock market.
The debate on how sentiment affects returns and vice versa focuses mostly on the conditional mean of returns. Only a handful of studies use quantile regression to see the influence on the entire distribution of returns. Further, minimal studies are conducted in the Indian context (see, e.g., Chakraborty & Subramaniam, 2020; Dash & Mahakud, 2012; Dash & Maitra, 2018; Kumari & Mahakud, 2015; Naik & Padhi, 2016). Having a quantile regression study, the present study will broaden the evolving literature focusing on emerging market economies.
The use of a quantile approach to see the relation between excess returns in the stock market and investor sentiment is steadily rising. For example, Ma et al. (2018) capture investor sentiments’ capacity to forecast or predict stock returns. They report that investor sentiment has a predicting power at lower quantiles. However, they also document that the predicting power disappears at upper quantiles. Jawadi et al. (2020) also confirm the nonlinear relationship between investor attention and returns. Aboura (2016) shows that sentiment has no predictive power at the mean but has significant predictive power at upper quantiles.
These above-mentioned studies, among others, motivate us to reexamine the relationship between irrational sentiment and excess returns at different quantiles in the context of the Indian stock market.
We believe that our analysis can extend the existing literature in ensuing ways. The empirical evidence on the impact of sentiment on the stock market in emerging economies using quantile analysis approach, particularly India, is limited. Our study analyzes the complex and nonuniform relationship between investors’ irrational sentiments and market excess returns by employing the quantile regression method. The quantile regression technique allows us to see how the market reacts to investor sentiment in good times and bad times.
Defining Investor Sentiment
Investor sentiment = rational component of sentiment + irrational component of sentiment.
Investor sentiment is the combination of future periods’ expectations based on market fundamentals (rational component) and irrational enthusiasm based on noise signals (irrational component). The rational (irrational) component of investor sentiment represents expectations about asset return and investment risks warranted (not warranted) by economic fundamentals.
Rational traders trade in stock markets on rational sentiments, that is, their trade decisions are backed by available information on macroeconomic fundamentals of the market. On the other hand, noise traders trade on rational sentiments (backed by macroeconomic fundamentals) and irrational sentiments (based on noise signals).
Measuring Investor Sentiment
The major challenge for testing the importance of investor sentiment is that it cannot be directly observed. Thus, quantification is difficult. Baker and Wurgler (2007), and Brown and Cliff (2005) suggest two approaches to quantify investors’ sentiment, namely bottom-up approach and top-down approach. Various studies use the bottom-up approach where sentiment is measured directly through the survey of investors (see Aboura, 2016; Fisher & Statman, 2000; Kumar & Lee, 2006; Lee et al., 2002; Perez-Liston et al., 2016; Sadaqat & Butt, 2016; Verma & Verma, 2007). This approach uses biases in individual investors’ psychology to measure the market-wide sentiment index (Baker & Wurgler, 2007; Kumari & Mahakud, 2015).
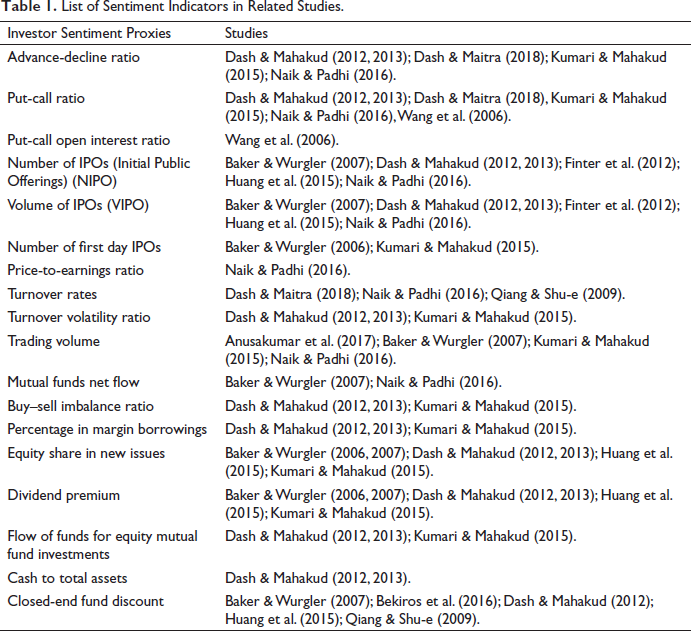
The top-down approach, on the other hand, takes the market-related sentiment proxies. Different studies considered several such proxies to measure the investor’s sentiment (see Table 1). These proxy variables are believed to reflect market sentiment and are directly determined by market behavior (Dash & Maitra, 2018). Baker and Wurgler (2007) contend that the top-down approach potentially encompasses regular patterns in stock prices, crashes, bubbles, and in an easy, intuitive, and inclusive way. Still, no consensus is seen about how many of these sentiment proxies should be used to create the sentiment index. Some studies combine both explicit and implicit sentiment proxies and this method is referred to as the mixed-method approach (Dash & Mahakud, 2013). Studies that used mixed methods are Brown and Cliff (2005), Finter et al. (2012), and Wang et al. (2006), among others.
List of Sentiment Indicators in Related Studies.
Data and Variables
Variables
Proxy variables for investor sentiment index: Since investors’ sentiment cannot be noticed directly, measuring it remains difficult. In the present study, the top-down approach is adopted to measure investors’ sentiment using market-related variables. As mentioned above, there is no strong consensus on the theory of the exact number of proxies for the construction of investors’ sentiment index. Based on data availability and also following the previous studies, we choose the ensuing proxies to form a composite sentiment index. This study considers the following 10 variables: ADR (advance-decline ratio), TV (trading volume), NIPO (Number of Initial Public Offerings), VIPO (volume of IPOs), TVR (trading volatility ratio), TURN (turnover rates), PER (price-to-earnings ratio), CTA (cash to total assets), FF (fund flow of equity mutual fund), PCR (put-call ratio).
Advance-decline ratio (ADR)
Put-call ratio (PCR) =
Trading Volume (TV), Turnover Rates (TURN), and Turnover Volatility Ratio (TVR)
All three variables are referred to as proxies for market liquidity. Investors buy stocks if they expect the performance of the company is well. They tend to overvalue the firm by extrapolating the news. Their irrational behavior, therefore, increases the trading volume. Investors are reluctant to purchase securities with bad news, as they tend to undervalue these firms. Thus, their irrational belief decreases trading behavior. Higher trading volumes imply bullish sentiment in the market, and lower trading volumes indicate bearish sentiment (Naik & Padhi, 2016). Thus trading volume can reflect investors’ expectations (Chuang et al., 2010).
Initial Public Offerings (IPOs)
The demand for IPOs can help us understand the stock market’s health and the economy. The number of IPOs drops during the recession situation, leading to a further decline in the share price. However, as the economy recovers, the number of IPOs increases. Baker and Wurgler (2007) contend that the number of IPOs is susceptible to investor sentiment. Thus, a higher number of IPOs implies a bullish sentiment, and a lower number of IPOs indicates a bearish sentiment (Kumari & Mahakud, 2015; Naik & Padhi, 2016). VIPO represents the volume of IPOs. A higher value of VIPO indicates bullish sentiment, while a lower value of VIPO implies bearish sentiment.
Price-to-earnings Ratio (PER)
Most of the time, the PER and the stock market index go hand in hand. Thus, a high value of PER indicates bullish sentiment (Naik & Padhi, 2016).
Fund Flow of Equity Mutual Fund Investments (FF)
It is argued in the literature that the flow of mutual fund investment is positively associated with the market sentiment (Brown & Cliff, 2004; Kumari & Mahakud, 2015). A high value of FF depicts optimism and confidence among investors (Kumari & Mahakud, 2015). We take into account the net amount of all money market mutual fund inflows and outflows from closed-ended funds.
Cash-to-total assets (CTA):
Construction of investor sentiment index: Investor sentiment is a function of all sentiment proxies.

where X1, X2, X3, …, Xl are sentiment proxies.
The above variables represent investor sentiment, and these proxies may comprise both rational and irrational components of investors’ sentiment. The former considers macroeconomic fundamentals. The latter considers some noise factors. Because we believe that while rational investors formulate their decision based on macroeconomic fundamentals, irrational investors formulate choices considering both macroeconomic fundamentals and noise.
We aim to inspect the influence of investors’ irrational sentiment on excess returns. In the present study, we use the methodology mentioned in Naik and Padhi (2016) to extract irrational components from each sentiment proxy. Accordingly, each sentiment proxy is regressed on ensuing chief macroeconomic fundamentals, such as IIP (growth of industrial production index), TS (term spread), EXR (exchange rate), short-term interest rate (INT), and INFI (net investment of foreign institutional investors), INF (inflation rate).

where Xt denotes sentiment proxies.
Before regressing, we perform the ADF test for stationarity to verify if all time-series variables are stationary. We find PER, TV, CTA, IIP, EXR, and INT non-stationary. They are stationary at their first difference. In Equation (2), the residuals of each regression are retrieved and these orthogonalized sentiment proxies are used in index construction.
Table 2 represents the correlation among these orthogonalized sentiment proxies. The correlation table suggests that these indicators share some common components. We combine various orthogonalized sentiment proxies by using principal component analysis (PCA) to exploit as much information as possible. Some proxies are said to require more time to disclose investors’ sentiment than others (Baker & Wurgler, 2006; Pandey & Sehgal, 2019).
Correlation Matrix of Orthogonalized Sentiment Proxies.
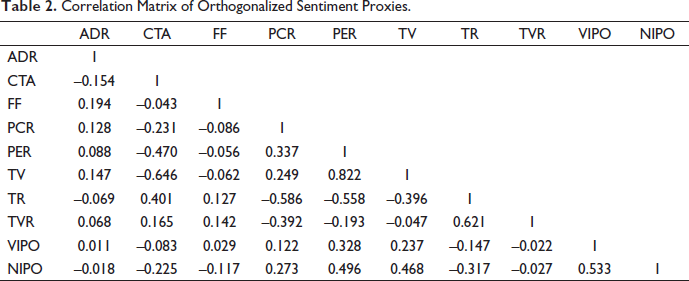
Therefore, the present study takes orthogonalized sentiment proxies at levels and at lags to construct raw sentiment index. Initially, PCA is performed to construct raw sentiment index with 10 orthogonal investors’ sentiment proxies at levels and their respective lags. This provides us with 20-factor loadings. Then, the correlation of raw sentiment index with orthogonalized sentiment proxies at level and lag are calculated. Orthogonal proxies at level or lag are chosen depending on whether these proxies at level or lag have a greater correlation with the raw investors’ sentiment index. Finally, PCA again is performed on these selected orthogonal proxies to create the final sentiment index. We find that 24.819% of the sample variation is described by the first principal component. Our investor’s irrational sentiment index looks as follows:

Calculation of excess returns: The market return is derived with the monthly closing price of S&P CNX Nifty using the formula rt = ln
Table 3 narrates the descriptive statistics of variables of interest. The mean value of raw irrational sentiment (denoted by raw senti) and final irrational sentiment (denoted by senti) is negative, depicting average bearish sentiment prevails in the market in the period considered. The correlation between raw senti and senti is high. It implies that not much information is lost by using the raw irrational sentiment index. ADF test is to check the stationarity property of the series. All series are found stationary at a 5% level of significance.
Descriptive Statistics of Variables.
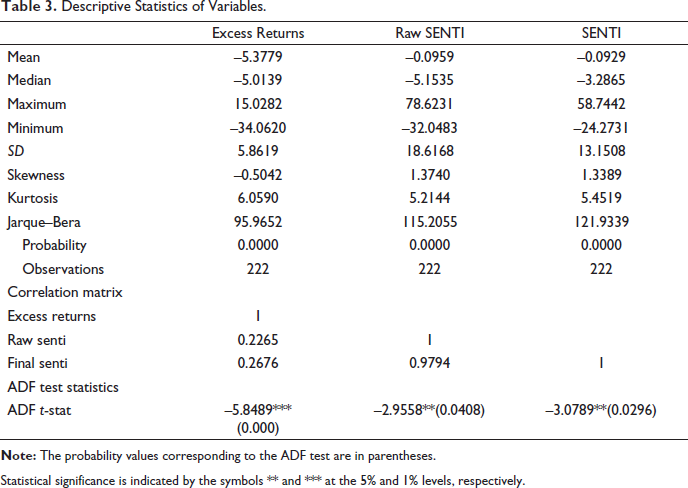
Statistical significance is indicated by the symbols ** and *** at the 5% and 1% levels, respectively.
Data
Our sample consists of monthly data spanning from July 2001 to December 2019, giving 222 observations. The selection of the sample period is delimited by the data availability of variables used. Data on advance-decline ratios (ADR), number of IPOs (NIPO), put-call ratios (PCR), IPO volume (VIPO), price-to-earnings ratio (PER), trading volume (TV), turnover rate (TR), and turnover volatility ratio (TVR) are mined from Handbook of Statistics on Indian Security Markets 2005, 2011, 2019 provided by SEBI (Securities Exchange Board of India) yearbooks. Data on cash to total assets (CTA) and the fund flow of equity mutual fund investments (FF) are extracted from AMFI (Association of Mutual Funds in India). Data on fundamental macroeconomic variables are extracted from the Handbook of Statistics on Indian Economy provided by RBI (Reserve Bank of India).
Methodology
The influence of irrational investors’ sentiment on excess returns is modeled using the OLS and quantile regression techniques. Before applying these techniques, time series of sentiment index, and excess returns have been confirmed stationary.
Contemporaneous Relation
The following models analyze the contemporaneous relationship between excess returns and investors’ irrational sentiment.
Model 1: To see the influence of investors’ irrational sentiment index on contemporaneous excess returns prevailing in the Indian stock market, the following model has been estimated.


where
Model 2: According to the literature, excess returns are affected differently by positive and negative sentiments. To capture this, following equation is estimated:


where
Model 3: One might wonder how these sentiments are generated in the market. So, it makes sense to anticipate a feedback mechanism that market behavior (excess returns) will create a bearish or bullish trend which eventually affects the sentiment of investors. To probe the impact of excess returns on the irrational sentiment index, we employ the following equation:


where
Predictive Model
Model 4: The following predictive model is taken into consideration as we attempt to determine how sentiments may affect future excess returns of the Indian stock market:


where
Most of the prior studies use the OLS method to look at the relationship between investors’ irrational sentiment and excess returns. However, OLS may not give an accurate description and complete picture of the relationship, as it only focuses on the conditional mean relationship. The relationship may be heterogeneous between independent variables and dependent variables across different quantiles of the dependent variable (Koenker & Bassett, 1978). As a result, a determinant that the OLS approach identified as being significant for the dependent variable may or may not be crucial at extremely low or high quantiles. Therefore, we adopt QR for empirical analysis and see if the traditional regression approach (OLS) fails to address the tail region of dependent variable distribution behaviors. Both OLS and quantile regression techniques are used. OLS estimates focus on the conditional mean value of the dependent variable only. The Newey-West estimators are used to overcome the problem of autocorrelation and heteroscedasticity in error terms of OLS equations of models.
Quantile regression is developed by Koenker and Bassett (1978). This approach is frequently employed in the world of finance. Quantile regression is an appropriate methodology to evaluate the complicated relationship between investor sentiment and stock returns. By taking into account different quantiles of the dependent variable, it concentrates on how independent variables affect the dependent variable’s overall distribution.
Quantile regression is preferred over OLS due to various reasons. First, by taking into account the whole distribution of the dependent variable, quantile regression offers a more comprehensive view. Therefore, OLS estimates are less efficient than quantile regression estimates, as quantile regression takes into account the information present in the tail of the distribution. Second, OLS suffers from an outlier problem, as an outlier has a greater impact on the mean of the distribution. The presence of outliers can distort OLS estimated results. Quantile regression, however, is robust to outliers. Third, quantile regression captures the non-linear relationship without needing a specific model structure. Fourth, financial data are always not normally distributed. It is of course feasible to use an estimating approach like quantile regression that does not presuppose the normalcy of error terms. Fifth, quantile regression approach overcomes statistical problems such as omitted variable bias, outlier problems, and non-normal error distribution. We choose five quantile levels from 0.05 to 0.95 (0.05, 0.25, 0.50, 0.75, 0.95) quantiles to empirically analyze the heterogeneous relationship between market excess returns and irrational investors’ sentiment index across various quantiles.
Empirical Analysis
Contemporaneous Relationship of Investor Sentiment and Excess Returns
First, the Augmented Dickey–Fuller test is done for unit root and found that both series (i.e., excess returns and irrational sentiment index) are stationary. We use quantile regression and OLS technique to test the influence of investors’ irrational sentiment index on excess returns (Model 1).
Table 4 reports the OLS and QR results of Model 1.
OLS Regression (Robust) and Quantile Regression Results of Model 1.
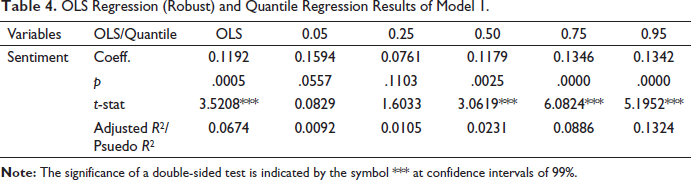
Figure 1 depicts the quantile coefficients of Model 1 and the corresponding 95% confidence interval.
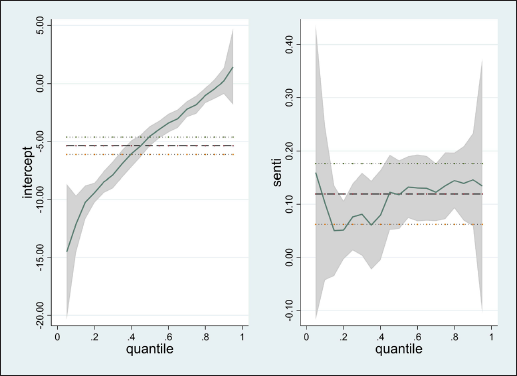
Irrational investor sentiment positively influences excess returns. This finding indicates that when irrational sentiment increases, that is, when noise traders have optimistic beliefs about the market, they gain excess returns. Findings are consistent with studies by Verma and Verma (2007); Chaung et al. (2010); Perez-Liston et al. (2014); Naik and Padhi (2016); Aboura (2016).
Quantile regression is used to obtain a detailed representation of how the irrational sentiment index affects excess returns. Lower (upper) quantiles depict bad (good) market conditions. The estimated coefficients are positive and increase from lower quantiles to upper quantiles. This finding depicts that irrational sentiment positively influences market excess returns and impacts excess returns in good market conditions than in bad market conditions. These results are consistent with Jawadi et al. (2020). The value of pseudo R2 rises as we go from lower quantiles to upper quantiles. The value of psuedo R2 in upper quantiles (0.75 and 0.95) is higher than the adjusted R2 of OLS analysis. At lower quantiles, the coefficient of irrational sentiment is not significant, that is, in bad market conditions, investors’ irrational sentiment does not impact excess returns. Indian stock market is driven by fundamentals for lower quantiles of excess returns, but high excess returns drive a wave of irrational sentiment among investors, which further boosts the level of excess returns in the Indian stock market. An increase in irrational sentiment when traders are earning excess returns encourages them to hold risky assets even more. This drive the asset prices even further away from fundamentals and traders become successful in stimulating the level of excess returns in the Indian stock market. The relationship between irrational sentiment and excess returns exhibits non-linearity, as the value of the coefficient of irrational investor sentiment changes per quantile.
Table 5 reports the OLS and QR results of Model 2.
OLS Regression (Robust) and Quantile Regression Results of Model 2.
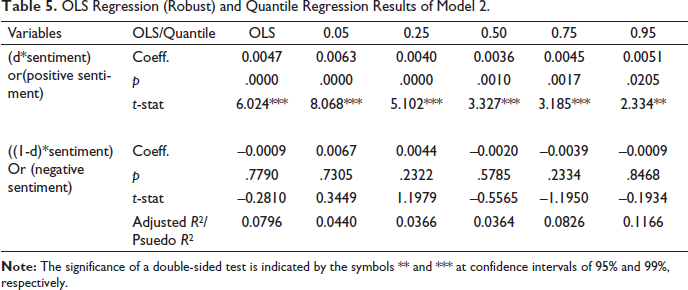
Figure 2 illustrates the coefficient of quantile regression of Model 2 and the corresponding 95% confidence interval.
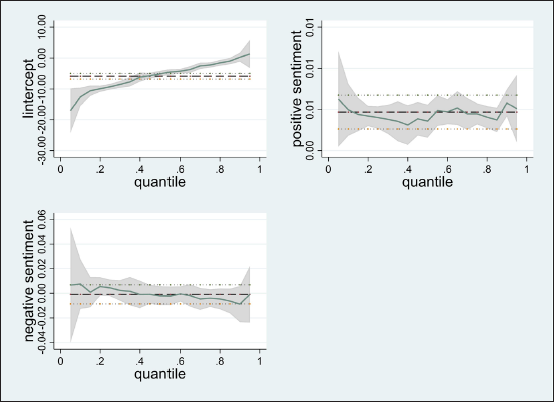
The adjusted R2 has increased in OLS analysis of Model 2 as compared to that of Model 1. The model’s explanatory power enhances when we decompose the sentiment index into negative and positive sentiment indexes. The coefficient of positive sentiment in OLS regression is positive, whereas the negative sentiment index’s coefficient is negative. These results are consistent with those of Haritha and Rishad (2020) and Naik and Padhi (2016). This shows an asymmetric relationship. Results further show that the positive sentiment impacts excess returns significantly, while the coefficient of negative sentiment is found insignificant.
Quantile regression is used to see how the decomposed positive sentiment and negative sentiment impact the entire distribution of excess returns. Similar results were found in quantile regression analysis. Positive sentiment impacts excess returns positively and significantly, whereas the coefficient of negative sentiment is found insignificant. These findings are in contrast with He et al. (2020), where the influence of optimism is found insignificant across quantiles at lower quantiles. In our results, the asymmetric relationship was found in upper quantiles and is lost in lower quantiles. At upper quantiles, positive sentiment has a stronger impact on excess returns than negative sentiment. Results at upper quantiles are consistent with the theory of hold-more effects. The positive sentiment means noise traders have bullish expectations. According to the Hold-more effect, noisy traders make more profit by earning excess returns when they are upbeat about the market. They are tempted to hold more risky assets due to their overconfidence. It leads to an increase in market risk and thereby increases excess returns.
Conversely, if noise traders’ opinion is bearish (depicted by negative sentiment), they decrease risky assets. It leads to a decrease in market risk and thereby reduces excess returns. When sentiment turns negative, noise traders frequently lose. Bullish sentiment will lead to higher excess returns, and bearish sentiment will lead to lower excess returns.
One might be curious about how these sentiments are generated in the market. It is then plausible to anticipate a feedback mechanism that the market behavior (excess returns) shall result in a bearish or bullish trend, that is, excess returns ultimately influence investor sentiment.
Table 6 reports the OLS and QR results of Model 3.
OLS Regression (Robust) and Quantile Regression Results of Model 3.
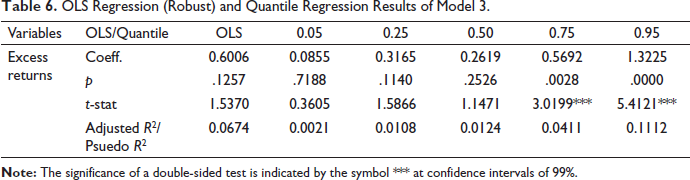
Figure 3 depicts the quantile coefficients of Model 3 and the corresponding 95% confidence interval.
OLS analysis shows that excess returns do not impact sentiment. These findings are in contrast with Lux (2011), Naik and Padhi (2016), and Solt and Statman (1998). However, when we analyzed the impact of excess returns on sentiment using the quantile regression technique, the coefficient of excess returns is discovered as positive and highly significant in upper quantiles. However, results at lower quantiles suggest excess returns are not significantly impacting the sentiment. Lower quantiles depict the bearish sentiment prevailing in the market. When sentiment is bearish, excess returns do not impact sentiment in the market.
At upper quantiles (i.e., when sentiments are bullish), excess returns impact sentiment positively. These results imply that when investors are bullish, a further increase in excess return will further intensify the optimistic behavior among irrational traders. Optimism among noise traders tempts them to enter the market and invest more in risky assets. Noise traders trade on noise signals or irrational component of sentiment, which is not based on macroeconomic fundamentals. As more noise traders enter the market, they increase the irrational sentiment in the market. Excess returns impact irrational sentiment at upper quantiles, and irrational sentiments impact excess returns at upper quantiles as well. Therefore, a feedback mechanism is observed between investors’ irrational sentiment and excess returns at upper quantiles.
Forecasting the Market
We exploit OLS and quantile regression to see whether the stock market’s excess returns can be predicted by investor sentiment. There is a debate about when the sentiment has the predicting ability of excess returns. Both excess returns and investor sentiment are stationary.
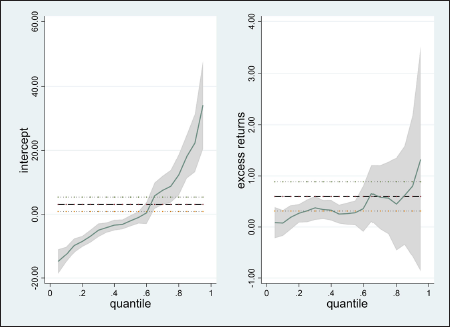
Table 7 reports the OLS and QR results of Model 4.
OLS Regression (Robust) and Quantile Regression Results of Model 4.
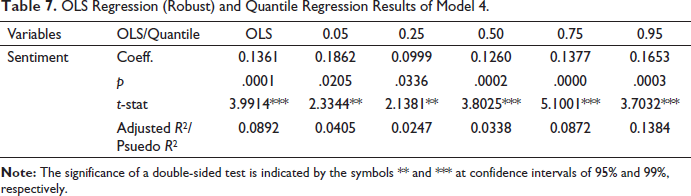
Figure 4 depicts the quantile coefficients of Model 4 with the corresponding 95% confidence interval.
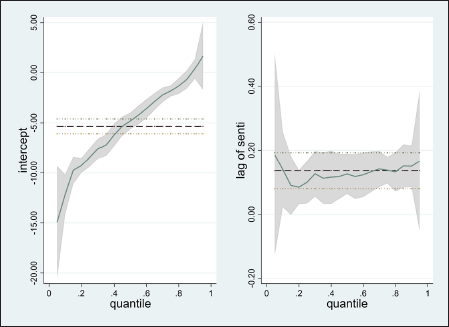
OLS results show that irrational investor sentiment contains the power to predict stock market’s excess returns, as the coefficient of sentiment is highly significant. Results are in contrast with Qiang and shu-e (2009), and Sadaqat and Butt (2016). These studies find that mispricing corrects itself in the next period, whereas our results suggest that mispricing persists. The coefficients of the irrational sentiment index vary across quantiles. Lower quantiles depict bad market conditions, while upper quantiles depict good market conditions. Investor sentiment index has forecasting ability throughout all quantiles, but the coefficients of sentiment index are more significant in upper quantiles than in lower quantiles. The possible reason for the more significant predicting ability of investor sentiment index in upper quantiles (in good market conditions) is that irrational investors have a huge inclination to walk in the market in good times as compared to bad times. These results are in line with Aboura (2016) but are in contrast with results by Ma et al. (2018), that is, predictive power of sentiment index is enhanced during bearish markets and vanishes during the bullish market. Our results suggest that the forecasting ability of investor irrational sentiment increases progressively from lower to upper quantiles depicted via rising pseudo R2 and increasing coefficient values. Interestingly, the coefficients are positive, which depicts that mispricing of assets persists in the Indian stock market. The Indian stock market is found informationally inefficient.
Conclusion
This research article studies the fascinating relation between excess returns and investors’ irrational sentiment using the Indian stock market’s monthly data. Developing a comprehensive irrational sentiment index that uses the market-related implicit sentiment proxies; the article employs both OLS and quantile regression techniques to see the relationship between the irrational sentiment index and market excess returns. The findings may be summarized as follows.
The irrational sentiment index is informative regarding contemporaneous stock market excess returns in upper quantiles only, and information is lost at lower quantiles. Results support the idea that investors have high rational beliefs during bad market conditions and investors indulge in irrational sentiment-induced trading during good market conditions. Irrational sentiment impacts excess returns positively and significantly at upper quantiles, that is, when market conditions are good. It is also found that excess returns impact irrational sentiment index positively and significantly at upper quantiles. A feedback mechanism between market excess returns and investors’ irrational sentiment index has been found at upper quantiles. Good market conditions tempt irrational investors to invest in more risky assets and thereby increase excess returns. An increase in excess returns makes irrational investors more optimistic about investing further and tempts more irrational investors to enter the market, thereby increasing irrational sentiment in the market.
The irrational sentiment is bifurcated into negative and positive irrational sentiment. Positive sentiment positively and significantly impacts excess returns on all quantiles, but the information that positive sentiment carries about excess returns enhances at upper quantiles. Negative irrational sentiment does not significantly impact excess returns in all quantiles. Sentiment has information regarding future excess returns in all quantiles, but it is higher in upper quantiles. Results indicate the existence of predictive ability of irrational sentiment is enhanced when market conditions are good. Irrational sentiment bears a significantly positive influence on the current and future excess returns. This implies that the mispricing of assets during that period and next period is caused by irrational sentiment. Mispricing persists in the stock market.