
Abstract
The study explores the determinants of indirect tax mobilization across various groups of Indian states based on their major, minor categories and more and less industrialized attributes. It observes a strongly positive but differential impact of per capita RGSDP on own tax revenue efforts of various state groups. Information and Communication Technology use is only helping major less and minor more producer states in augmenting their tax revenues, whereas it results in decreased revenues for major more and minor less producing state groups including all the states in a group. This implies use of Information and Communication Technology has been less effective for most Indian states in augmenting their tax revenues. The governance quality results in loss of tax revenues in major and minor less producer states, while it has no effect on major more producer including all minor and all states together. This implies a weak role of governance in taxation. We observe differential impact of tax regimes for different state panels, which has significant policy relevance.
Keywords
Introduction
Taxation is one of the significant fiscal resource mobilization tools for governments around the world in ensuring efficient allocation and redistribution of resources. Among several important goals of taxation, namely efficiency (growth) and equity, environmental quality, good public health, adequate generation of revenue is a most vital goal of governments to meet their expenditure requirements to ensure maximum social welfare of all citizens and meet the growth targets and thereby achieve several desired economic and social goals. In India, the states, on an average mobilise more than 87%–91% of their own tax revenues (OTR) through indirect taxes on goods and services during 2000–2001 till 2020–2021, while the rest forming a minor fraction is collected as direct taxes such as taxes on income and expenditures and taxes on property and capital income (RBI, 2022). 1
In line with centre’s ambition of laying a stronger foundation for cooperative fiscal federalism, Indian states along with the centre recently implemented new indirect tax reform measures envisaged by the centre. The states have gradually shifted from a sales taxation regime to Value Added Tax (VAT) at different time points during 2005–2008 and then uniformly shifted to the implementation of Goods and Services Tax (GST) regime since July 1, 2017 along with the Centre and UTs. Although VAT and GST firmly stand on destination-based principle of indirect taxation but GST is thought to be considered as a more transparent and refined destination-based single tax system on the supply of both goods and services from manufacturer to the consumer, avoiding the cascading effect of taxation which had existed in all the previous tax regimes. The intended idea was to bring all the goods and services under the GST net and thereby have a uniform tax rate for all the goods and services across the states and allow unrestricted flow of transactions of goods and services from manufacturers to the final stage of consumption, therefore, leading to a unified/single national market in India. However, this is levied on consumption of goods and services excluding certain products such as liquor, petroleum and electricity consumption, which are yet to be brought under the ambit of GST. The share of revenue subsumed under GST constitutes around 51% for the states and 37% for the Centre. Different states have differing revenue mobilization capacity mainly depending on their major production (export) and consumption (import) activities. It is often thought that the GST being a destination-based regime would yield greater revenue buoyancy for consumerist states comparing manufacturing intensive states. But this presumption need not hold good in view of the fact that high-producer states are also high importers of different goods and services.
In this context, with the implementation of recent indirect tax reform, we aim to examine the determinants of indirect tax revenue of states as to see how the indirect tax revenue mobilization of states has been affected differently for various state groups based on their some homogenous characteristics. This would help us evaluate the states which have gained tax revenues as compared to other states in India, as a result of adoption of the recent changes in tax policies. In particular, the study would be able to examine whether the implementation of GST in 2017 has proven to yield greater revenue productivity for the less-producing states comparing more producer-oriented states vis-a-vis the previous regime of VAT. Or, is there any decline in own tax revenue buoyancy across all the state groups irrespective of their socio-political and economic characteristics? Since it is argued that a consumerist state like Kerala is expected to witness a revenue jump but in reality, it is seen to have suffered revenue losses during the initial implementation phases of GST barring the more recent years, where it has experienced the revival in revenue mobilization in the more recent period along with other states. Therefore, the study tries to investigate whether the present tax regime has resulted in significant departures in revenue realization in various groups of states comparing the previous tax regimes of VAT and sales tax regime.
Thus, the objective of the study is to assess the states indirect tax revenue productivity along their broad based economic characteristics such as high producer versus less producer-oriented states in the context of recent indirect tax reforms. This would help us to observe the state groups which have experienced a dip in their own revenue realization and which have experienced an increase in revenues on account of the recent tax reforms. This is because when tax reform is carried out in a country, it inherits the structural changes in combination with tax policy design and tax administration, comprising the most crucial components of tax reforms. Thus, the study categorises the states into four groups based on whether they belong to major or minor states and by main economic activities, whether more or less producer-oriented states based on their relative industrial output contributions to total output. The study assumes importance in light of subsumption of tax sources under GST which were previously used to mobilise a significant share of their OTR. Thus, it is tempting to examine, whether the recent implementation of indirect tax reform has affected their tax-raising potential. Further, this evaluation is quite critical, more especially when there is a revenue importance of GST in states’ finances as the states have limited power in raising adequate amounts of revenues on their own from various avenues to make up any revenue losses if they suffer from GST collections (Mukherjee, 2020). The study on indirect taxes would assess among other things the role of two regimes on the contribution to their OTR in various state groups.
The present GST regime in India is as an indirect method of tax collection concurrently levied by the centre and state/UT governments on the same base in equal rates without the cascading effect. This has replaced many other indirect taxes such as excise duty, VAT and services tax. It covers indirect taxes ranging all the commodities and services except few selected products like liquor and electricity which are kept outside the purview of GST but used to be covered under VAT and sales taxation. The services which previously remained outside the purview of states’ VAT on their supplies (but centre use to impose taxes) are subject to GST based on the place of supply where it is finally being consumed. In case of goods and services involving intra-state sales, both the Central GST and State GST levies are applicable by centre and states. However, all the inter-state sales are chargeable to the Integrated GST (IGST) where centre collects the revenue and settles the revenue with the destination state. Before GST implementation, India had several erstwhile indirect taxes such as service tax, VAT and Central Excise, which used to be levied at multiple supply chain stages. Some taxes were governed by states and some were by the Centre. There was no unified and centralized tax on both goods and services. All the major indirect taxes, as much as 11 types of taxes collected by both centre and states in different stages of production and sales (Central Excise Duty, Duties of Excise, Additional Duties of Excise, Additional Duties of Customs, Special Additional Duty of Customs, Cess, State VAT, Central Sales Tax, Purchase Tax, Luxury Tax, Entertainment Tax, Entry Tax, Taxes on advertisements, Taxes on lotteries, betting and gambling etc.) are subsumed under present GST regime. This has greatly reduced the compliance burden on taxpayers and eased tax administration. Previously, due to different indirect tax laws, taxpayers could not realise tax credits set offs of one tax against the other. For example, excise duties paid during manufacture could not be set off against VAT payable during the sale. This largely contributed to cascading effect of taxes. Under GST, taxpayers claim input tax credits upon invoices uploaded by their respective suppliers. The tax levy under GST is only on the net value added at each stage of supply chain. This to a full extent eliminates the cascading effect of taxes and contributes to the seamless flow of input tax credits across transaction of commodities and services. The CGST plus SGST on intra-state sales has replaced the VAT and central excise and service taxes under the present GST regime, where both the governments (centre and states) proportionately share the tax revenue accruals. The IGST levied by centre has replaced the Central Sales Tax and Excise/Service Taxes. Thus, there exists only one tax on inter-state sales as levied by centre. The Centre collects and shares the IGST revenue based on the state of destination of consumption. Thus, CGST, SGST, and IGST jointly constituting the GST regime have replaced all the above taxes.
Since states in the initial stages of its implementation were fearing for the loss of revenue, centre had agreed to provide GST compensation to states as a form of grant to them in lieu of any loss of tax revenue arising in new tax regime initially for a period of five years from the date the state brings its State GST Act into force. The GST compensation received from centre by the states during this initial implementation of five years for the purpose of meeting the revenue shortfall in the Indian states in the new tax regime against the projected growth of indirect tax revenue during the period accrued as part of non-tax revenue receipt of states or grants to states from centre. The compensation amount is based on revenue projections of states assuming it to grow at a constant rate of 14% since the base year 2015–2016 excluding taxes on petroleum sales and alcohol for human consumption in the revenue base. This grant is unlike the devolution received by the states. 2 Since the grant amount is determined based on this revenue gap criteria, the projected revenue takes a fixed path against the realised amount. The difference constitutes the GST compensation amount which is accrued to the individual states depending on their revenue gap in indirect taxes. This compensation constitutes basically an assurance or encouragement to the states to step into the new indirect tax regime. We do not relate the compensation as an indicator of the extent of revenue displacement effect of new tax regime when centre did not provide timely compensation to states against their wishes. Rather, our goal is to evaluate the actual revenue productivity during VAT visa-vis GST regime, that is, whether GST implementation has actually benefitted the states in terms of enhanced indirect tax revenue realization or not. This study provides an overall assessment on tax productivity performance of GST and VAT regimes from a comparative perspective.
Literature Survey
A great deal of literature on India and international context have evaluated and analysed the productivity of VAT and examined the tax buoyancy in light of various tax reforms and changing macro and fiscal circumstances. Keen and Lockwood (2010) considering 143 countries for a period of 25 years, clearly observed a revenue gain effect of VAT for advanced and more opened economies. Houssa and Megersa (2017) found almost similar results for VAT-adopted countries, while Alavuotunki et al. (2019) provided contrary evidence. Studies have also observed long-run tax buoyancy is greater for developing countries than the developed ones (Paolo & Jalles, 2017).
In the Indian context, Das-Gupta (2012) had analysed the revenue effect of VAT over sales tax regime for 29 states during 1993–1994 to 2008–2009 along with assessing the administrative efficiency and evasion proneness. He observed a positive impact of VAT dummy variable implying a higher secular revenue productivity of VAT compared to sales tax regime. Analysing the same issue for the individual states, he observed that VAT revenue performance was positive in 15 out of 23 jurisdictions which includes 6 of 10 major states (excluding AP). The revenue gains were smaller for Karnataka, Kerala and UP. In overall, even if VAT performance was positive in 2/3rd of the states, after VAT introduction the improvement in own revenue performance occurred only by <40% including only two major states. Using a VAT dummy and finding it consistently insignificant for individual states, he concluded that VAT did not lead to base expansion. Analysing the assessment report of Comptroller and Auditor General (2010), he attributed the loss of revenues of states to large tax evasion by dealers on account of ineffective procedures of verifying ITC claims and detection of fake ITC claims, incomplete automation, limited electronic return filing and lack of cross verification of information in VAT returns across dealers within and across the states. Mallick (2021) empirically examined the role of ICT (information and communication technology) infrastructure and governance quality in realization of both the direct and indirect tax revenues mobilizations by the combined governments of Centre, States and Union Territories of India during the post-liberalization period of 1990–1991 to 2017–2018. The findings surprisingly reveal that ICT infrastructures and governance quality have no significant positive effects on overall tax revenue collections. This contrary outcome could be possible when there is greater scope for taxpayers to easily escape out of the tax net by carrying out transactions outside the purview of ICT system or without relying on the use of ICT infrastructure and leaving no trace behind. Karnik and Raju (2015) observed the sectoral share of manufacturing in GSDP and annual per capita consumption expenditure are the major determinants of sales tax (as percentage of GSDP) capacity for 17 major Indian states during 2000–2001 to 2010–2011. Both these variables had positive and significant associations with state’s sales tax collection. However, the study estimated a time-invariant SFA model without incorporating efficiency-enhancing factors into the model, which was a significant drawback.
There are no recent studies evaluating the factors influencing tax productivity for the Indian states especially in the context of adoption of new indirect tax reforms such as GST comparing its previous VAT regime to provide a comparative perspective about the performance of two indirect tax reform regimes on mobilization of state revenues. The study intends to estimate the productivity (buoyancy) of indirect tax revenues for various groups of states based on certain broad homogeneous characteristics from a comparative ground to assess which kind of state groups have achieved greater overall indirect tax buoyancies comparing other state groups. This study contributes to the literature as no study examines the tax productivity of states by grouping the states or constructing a panel of states based on certain homogenous characteristics such as major and minor and high producer (producer intensive states) versus low producer states (less producer intensive states) based on industrial output shares considering both the tax regimes. This analysis is very crucial for policy as to examine how own indirect tax revenues of states respond to two different indirect tax regimes along with other key factors. Most importantly, none of the studies have considered the quality of governance, and role of ICT (information and communication technology) along with cost of collection as factors of tax mobilization which the study tries to incorporate.
Framework of Analysis
The study examines the indirect tax productivity by controlling a wide set of factors like GSDP and role of ICT and governance along with indirect tax regimes. This would also reveal how indirect tax revenues respond to the change in GSDP of states. A tax buoyancy value of one would indicate a 1% increase in GSDP would on an average increase the tax revenue by 1%, thus leaving tax-to-GDP ratio unchanged. A tax buoyancy or productivity exceeding one, however, would indicate a more than proportionate increases in tax revenue in response to one percentage increase in GSDP and this would potentially contribute to the reduction of fiscal deficit to GSDP ratio of states or would provide more fiscal leverage or fiscal space to states in meeting more social sector and welfare spending and enabling them to incur more capital infrastructure projects for greater economic development. Otherwise, the states would not be in a position to finance their social sector spending for welfare and infrastructure spending for higher growth objectives.
The study focuses on analysing the long-run determinants of tax productivity. This is because the short-run tax buoyancy would enable to assess the stabilization function of fiscal policy on account of the business cycle fluctuation (whether it serves as an automatic stabiliser), whereas long term tax buoyancy would assess the long term sustainability of fiscal policy and hence its impact on GSDP growth and vice-versa. The long-run tax buoyancy exceeding one would ceteris paribus imply that higher growth would improve the fiscal balance through the revenue side of the budget. 3 The tax productivity/buoyancy illustrates the role that revenue policy would play in ensuring fiscal sustainability over the long run, and in stabilizing the economy over the business cycle in the short run. Revenues which move in tandem with output in long run supports the sustainability of fiscal policy; revenues that are very responsive to changes in output in short run ensure functioning of tax system as a good output stabilizer.
This analysis would allow the state fiscal authorities (a) to ascertain whether greater effort is required to mobilize desired amount of revenues, and (b) to better direct their efforts at increasing the share of taxes from sources which are likely to respond better to the sustained increase in incomes. Further, knowing which structural factors likely to affect tax productivity would help anticipate how all the considerations would change as the economy develops. A buoyancy greater than unity over the long-run is a desirable feature of a taxation system, when there is an increasing demand for public services and pursue relative financial stability. When tax buoyancy is low, discretionary changes are required to make up the tax short fall, which would accrue afterwards and requires to be disproportionally high (Blanchard et al., 2010).
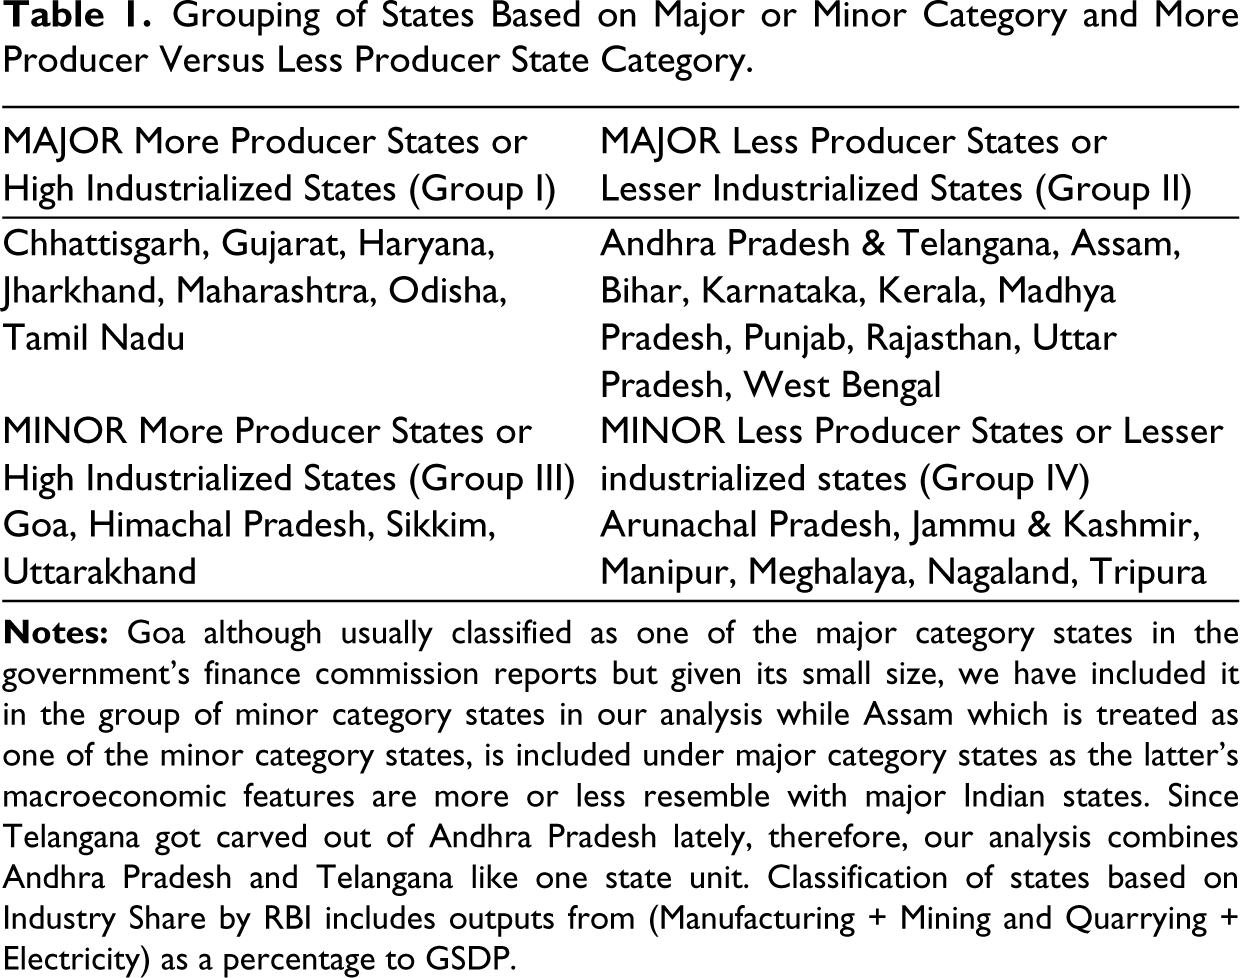
Based on the same economic characteristic such as real industrial output shares of major and minor states, the study effectively classifies all the 28 states into four homogenous categories, for which we have also estimated which tax regime is effective in mobilising greater revenues for which group of states by controlling most of the key determinants of indirect tax revenues. For investigating which tax regime is quite effective across four homogenous groups (see Table 1), we have estimated the following tax revenue determinant model. The model can be specified as follows:
Grouping of States Based on Major or Minor Category and More Producer Versus Less Producer State Category.
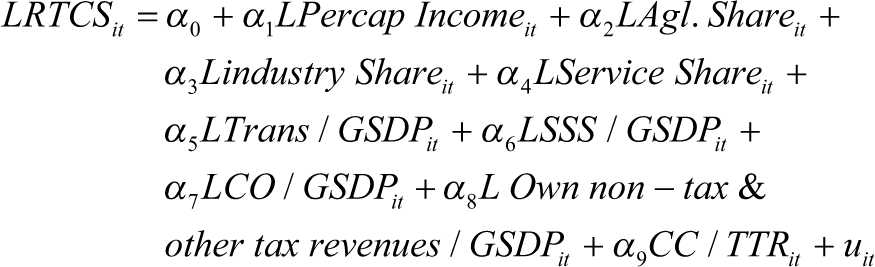
Whereas, in the above Equation 1, prefix L refers to logarithmic transformation of a variable. RTCS refers to the real tax revenues on commodities and services of states which hinges on tax efforts including capacity of a state to collect the tax revenues. Precap Income which denotes per capita income is measured from real GSDP (RGSDP) as a ratio to total population of a state reflecting the capacity of states to raise revenues. Agl. Share refers to the real agricultural output as a percentage to real GSDP, Service share indicates the real service output as a percentage to real GSDP, Trans/GSDP refers real total transfers received by states from centre (devolutions and grants excluding loans extended by centre) as a percentage to real GSDP, SSS/GSDP denotes real social sector spending as a percentage to real GSDP, CO/GSDP denotes real capital outlay as a percentage to real GSDP, real own non-tax revenues and other tax revenues (other than commodities and services like direct taxes) are taken as a percentage of real GSDP, CC/TTR denotes real cost of collecting tax revenues to real total tax revenues.
Econometric Applications for Panel of States
Before we test for the panel cointegration on our tax revenue model, we have employed cross-sectional augmented I’m Pesaran-Shin (CIPS) unit root test introduced by Pesaran (2007) which captures the cross-sectional dependency and provide more consistent results than the first generation unit root test. CIPS unit root test statistic is obtained from Cross-sectional Augmented Dickey-Fuller (CADF) test statistic. The CADF test statistic can be expressed as:
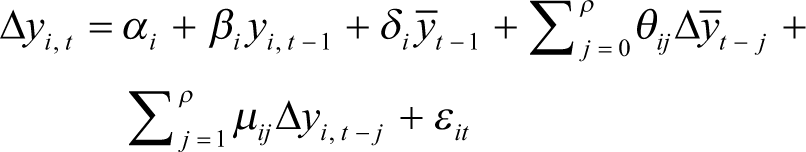
where yt is the cross-section averages of a variable used in the model. Now CIPS statistic can be presented as:

Panel Cointegration Tests
The study period spans from 2001 to 2021; the number of time observations (20) exceeds the number of states forming each group implying (T>N). Therefore, given the macro panel nature of our data, we have derived long-run tax buoyancy coefficients either by using Pooled Mean Group estimates (panel ARDL approach to cointegration) or FMOLS estimation.
The study applies various panel cointegration tests such as Kao and Engle’s residual-based co-integration and rank-based cointegration procedure. After confirming there exists cointegration, the study provides long-run parameter estimates using FMOLS estimation on its own indirect tax productivity model of states for four groups. The FMOLS estimates are reported as it provides better estimates comparing the estimates derived from fixed effect versus random effect model. The study has also tried to estimate through GMM and ARDL panel models. The results are seen to be more or less in line with the FMOLS results reported barring few deviations in parameter signs and significances. Although we do not much emphasis on short-run estimates underlying the ECM model (as our focus of emphasis is not on tax buoyancy over short-run) but lagged ECM term is estimated to re-confirm cointegration test results based on the cointegration test results.
As a basic necessity for establishing the long-run relationship among variables, the study uses the cointegration tests of Kao’s Engel Granger-based tests and Fisher’s Johansen-based Panel cointegration tests. Kao (1999) recalibrated the Engle-Granger (1987) test for cointegration to compute the test statistics for confirming presence of cointegration in a panel framework. The Kao test specifies the cross-section-specific intercepts and homogeneous coefficients. After confirming cointegration in various state panels, the determinants of indirect tax revenues are estimated with FMOLS estimation procedure as FMOLS can be estimated for the models where variables are of mixed order of integration.
We estimate the tax productivity determinant model through Kao’s Engel Granger residual-based cointegration test and provide the corresponding long-run estimates using the FMOLS estimation or Pooled mean group estimation procedure, where real total tax revenues on goods and services and per capita RGSDP are non-stationary in our tax productivity model. When all the variables incorporated in a model follow a non-stationarity process, Granger and Newbold also suggest for cointegration test to derive reliable estimates and thereby avoid spurious estimation of parameters (Engle & Granger, 1987).
Data Sources and Variable Dimension
The grouping of states is based on some homogeneous characteristics of size (major or minor status—based on geography, area and population) and economic characteristics—if the individual state’s industrial output share is above the national average or below the national average (of all the states in India). The study for a comparative analysis forms the state panels as more and less producing within major category and similarly same criteria are also followed for the minor category. For classifying them into more industrial and less industrial groups, we have used their average industrial share in total output over last five-year’ period (if their last five years’ average is greater or lesser than the national [all states’] last five-years’ average) as presented in the Appendix Table 1. Incorporating both the dimensions of industrial share and their size (geographical and population), Table 1 below indicates the emerging state groupings adopted in the study. Thus, we group the states into four categories—such as High industry from major and minor category states and low industry from major and minor state categories. Following such classification, Karnataka is classified under low producer (industrial) states’ grouping, while Odisha, Chhattisgarh and Jharkhand are classified as high producer (industrial) states’ grouping among major category states.
Own indirect tax revenues of states on commodities and services, other taxes (land and property taxes) and non-tax revenues, transfers received from centre, per capita GSDP, output shares of three broad sectors representing structural features of state economies, cost of tax collection, capital expenditure and social sector expenditures are collected from State Finances: A Study of Budgets of RBI (Reserve Bank of India). The VAT and GST year dummies are introduced as per the years of adoption by state governments and the information is obtained from the RBI reports. ICT is defined as information and communication technology which is proxied by number of internet users per million population as the information on other statistics such as number of mobile users, computers/laptops users and broadband services users per million are not available from the relevant source (India stat.com where from internet use data is drawn) to form an integrated measure of ICT. The tax administration/governance of states is proxied with number of cases charge sheeted per million population in each state in the context of unavailability of information on number of tax frauds and offences committed across states. This proxy information to measure quality of tax administration was collected from the National Crime Records Bureau (
Determinants of Own Indirect Tax Revenues of States: An Analysis of State Group Tax Mobilization Response
Before we examine the tax revenue realization response of states across various state groups using macro panel data over a longer period, the study investigates the time series property of panel nature of all the variables used in the model for each state group. The stationarity and non-stationarity properties of variables are investigated for each panel by applying four different panel unit root tests. The unit root test results produced in Appendix Table 2 suggest that although variables used in their own indirect tax revenue model for almost all four groups (more producing, less producing within major and minor category states) including two combined groups (all major and all minor) are non- stationary in levels, but those are found to become stationary in their first differences. After being ensured of the order of integration of all the variables, this calls for the use of an appropriate panel time series estimation method to estimate the determinants of indirect tax revenue mobilization across state groups. We have carried out cointegration testing procedures to verify whether there exists a long-run relationship across four groups of state panels including their combined groups.
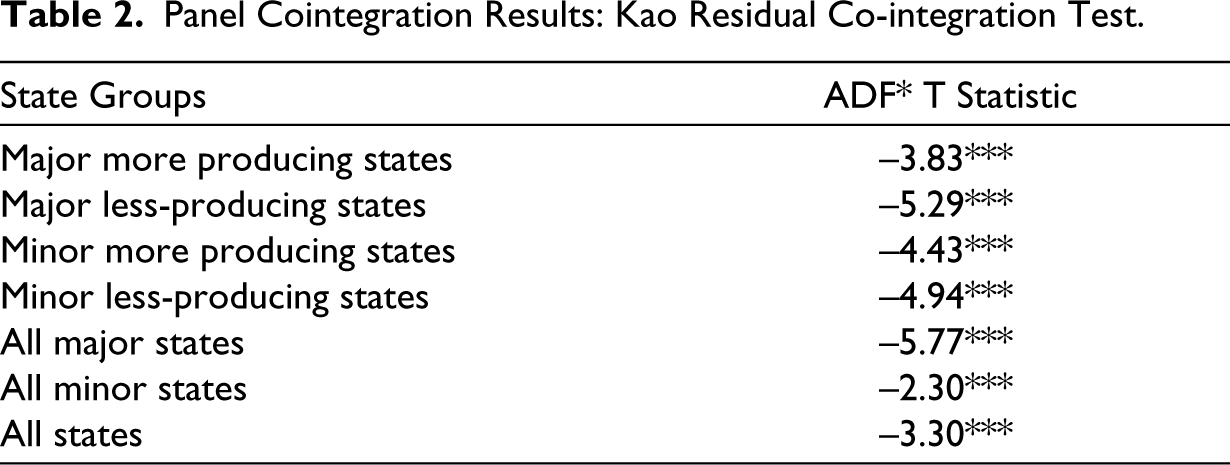
Table 2 produces the panel cointegration test results based on Kao’s residual cointegration test procedure. These test results produced for 6 alternative state groupings are derived based on our specified indirect tax revenue model represented in Equation 1. The results suggest that there exists cointegration and it is confirmed for all the six alternative groupings including all the states taken together to form another group. Although only Kao’s Engle-Granger residual-based cointegration test results are reported in Table 2, but the existence of cointegration is also verified with alternative tests including Fisher’s cointegration test, which are not produced here for the sake of brevity. After being ensured of existence of cointegration in our revenue model for all the panel groups, we have derived their corresponding long-run estimates by applying FMOLS estimation procedure on our tax revenue mobilization determinant model specified in Equation 1. Estimation of it reveals some interesting insights on the determinants of indirect revenue mobilization of homogenous groups of states and their other alternative groupings.
Panel Cointegration Results: Kao Residual Co-integration Test.
The FMOLS estimates for all the state groupings including the group combinations are reported in Table 4. For state group 1 (major producer states), the results (shown in column 2 of Table 3) suggest that per capita RGSDP is a significant factor in favourably inducing state’s potential tax revenue mobilization. One percent increase in per capita GSDP on an average results in 1.34% increase in own indirect tax revenues. Agricultural share is having an adverse influence, while service share positively affects tax revenue mobilization of states. An increased industrial output share does not have a strong relationship with own indirect tax revenue of states. It is surprising to observe that capital outlay-to-GSDP and collection cost-to-total tax revenues do not significantly impact states’ own indirect tax revenue realization along with the quality of governance measured in terms of number of corruption cases charge-sheeted per million population.
Fully Modified Ordinary Least Squares (FMOLS) Estimates on TCS to GSDP% (2001–2021 Panel).
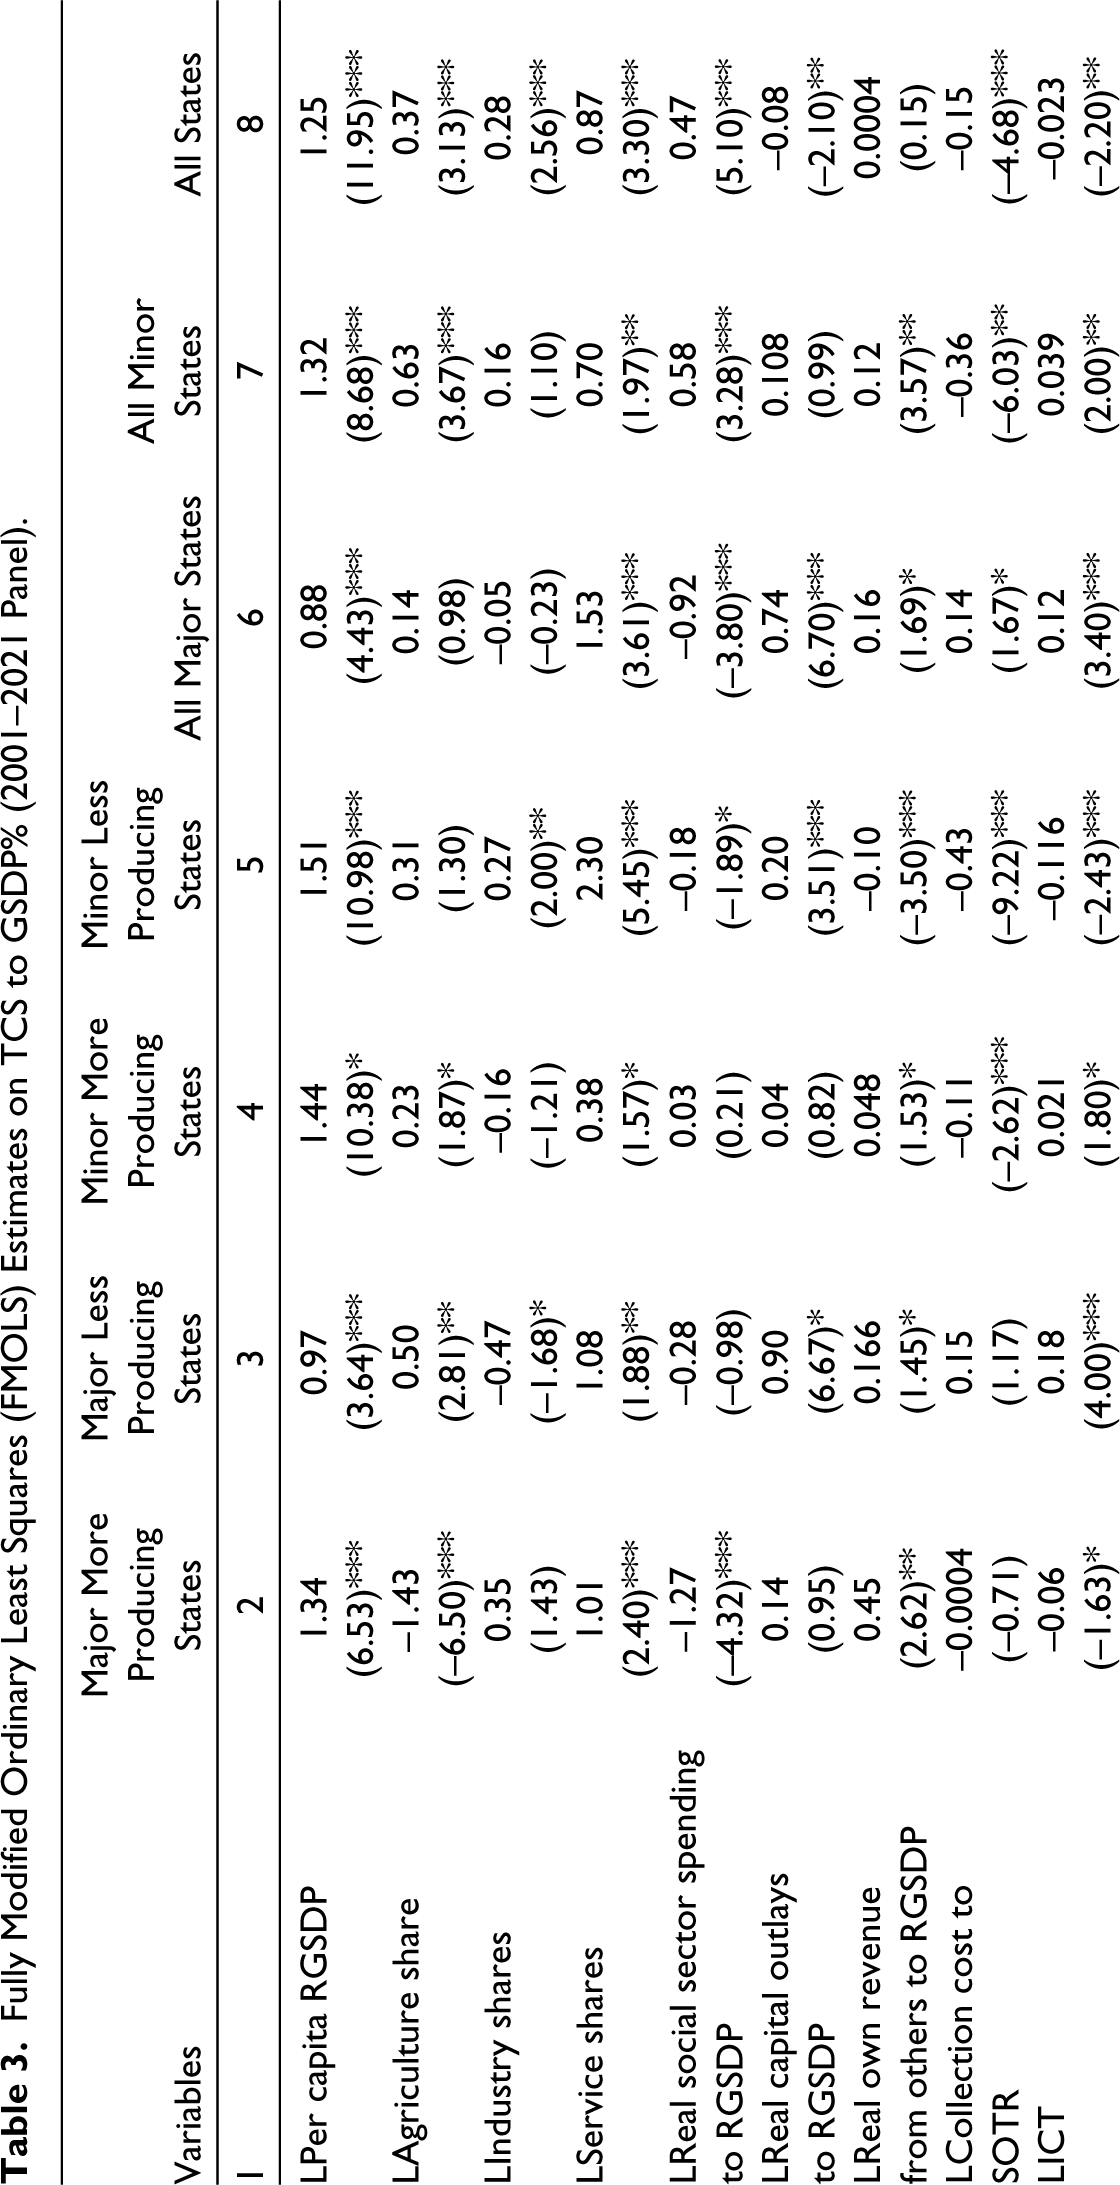
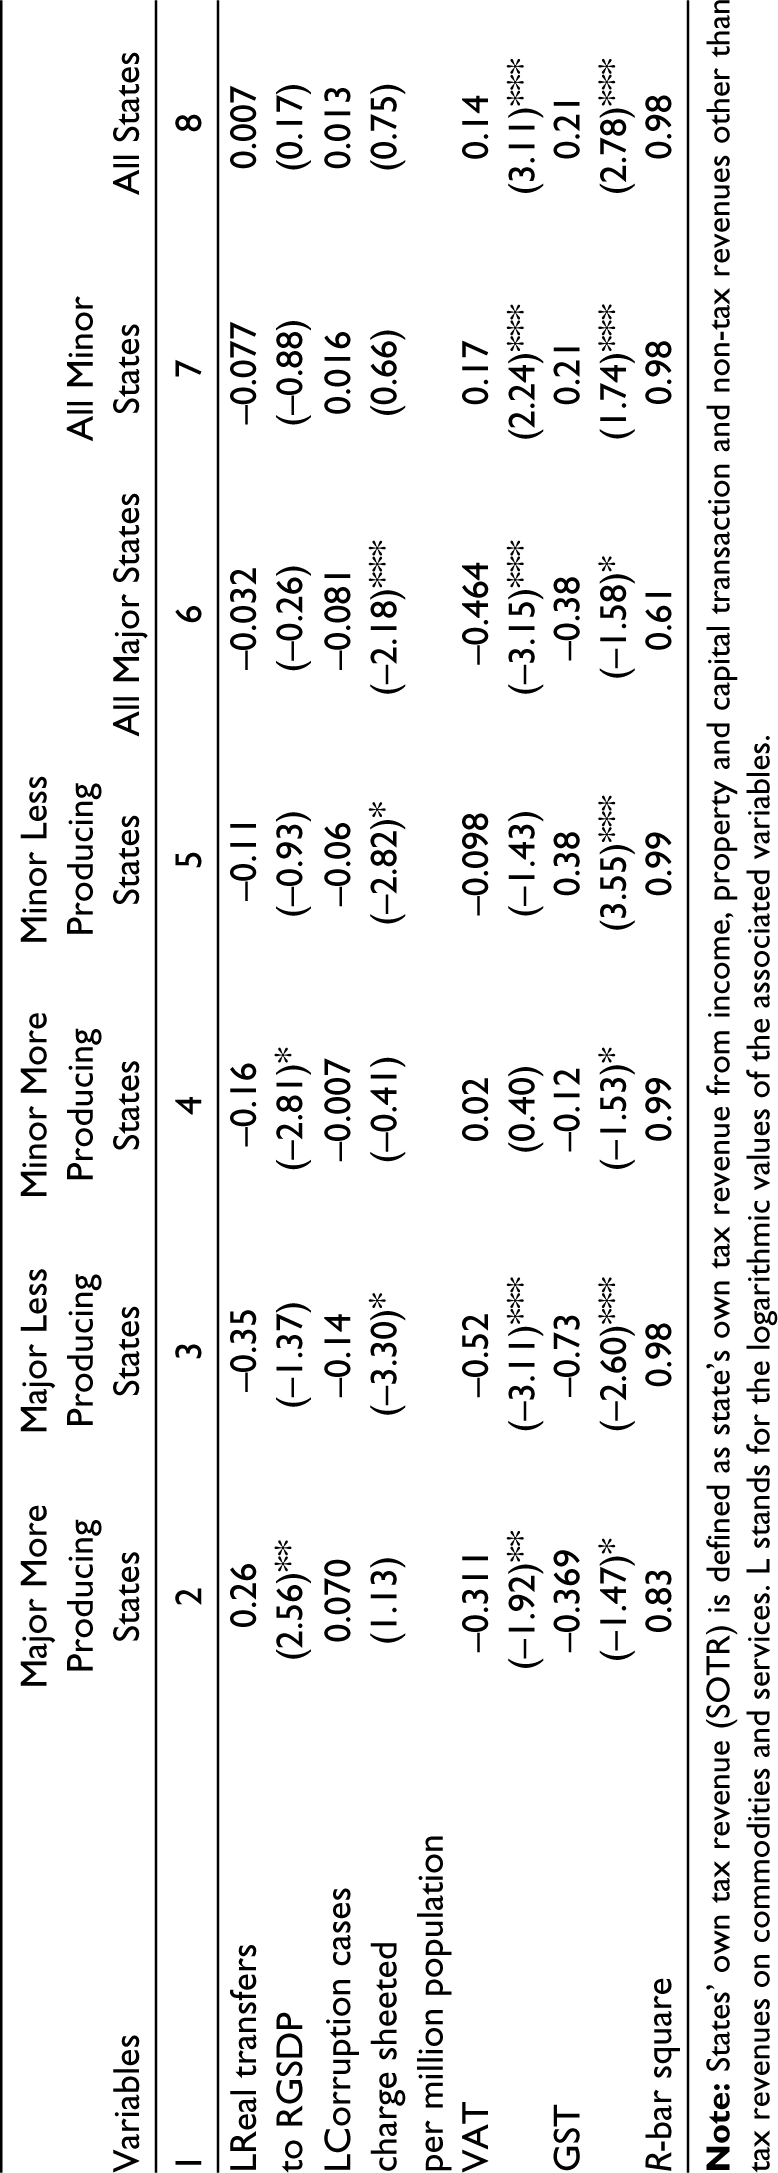
The central transfer to states (shares in central taxes and grants from centre) is positively and significantly associated, while social sector spending and use of ICT per million population are adversely impacting on their own indirect tax revenue mobilization efforts along with VAT and GST regimes of states. This means that increased allocation on social sector spending by states is not tempting them to make greater efforts to mobilise higher own indirect tax revenues. Further, the need for greater provision of capital expenditure is not inducing these states to mobilise greater own indirect tax revenues. Along with increasing transfers, the state governments are putting increased efforts to mobilise greater own indirect tax revenues, which could aim at bridging their revenue shortfalls and overall fiscal deficits. Thus, the major producer states are not under any pressure to increase their own indirect tax revenues in response to social sector spending and capital outlays, which could be on account of their better financial management following the implementation of fiscal discipline rules. This could also imply that any increase in capital outlays might be financed through borrowing from different sources by the state governments. It shows that both the tax regimes, namely VAT and GST are not significant generators of tax revenues for major producing states. This may imply that these states might be making greater efforts to mobilise OTR based on their self-fiscal discipline and fiscal discipline conditionalities associated with receipt of their gross transfers from the centre and their capacity to mobilise tax revenues irrespective of the required demand for incurring social sector spending and capital outlays.
When we consider less producer major states (column 3 of Table 3), the results indicate that there is some differential impact of per capita RGSDP on OTR as observed from the preceding results, although it is positively associated with indirect tax revenues on goods and services in all instances. One percent increase in per capita GSDP on an average leads to 0.97% increase in indirect revenues. In contrast to more producing major category states, agriculture share is having favourable impact on indirect tax revenues along with service sector share. Similar in line with more producer major category states, with increased own revenues from other sources (direct and non-tax revenues), these states are also putting greater efforts to mobilise own indirect tax revenues. However, an increased industry share for less industrial states instead of resulting in greater indirect tax revenues is inducing lesser indirect tax revenue mobilization compared to more producing major states. This might be holding true because although they are less industrialized states from major category but they might be consuming most of what they are producing as a result contributing to greater indirect tax revenues unlike for major more producer state groups. Against our expected result, this proves the point that being more producer and less producer may not be an important factor in the mobilization of own indirect tax revenues among major category states.
Social sector spending and collection cost to total tax revenues do not significantly influence tax mobilization of these states. In contrast, capital outlay and ICT induce greater indirect tax revenue mobilization. Unlike more producer major state grouping, the overall transfers do not significantly influence their own indirect tax revenue efforts. This implies that flows of greater tax devolution (share in central taxes) and grants from the centre to these states do not influence these states to make greater efforts to realise greater own revenues. When we consider tax regime impact, the result suggests that GST results in a greater decline in tax revenue mobilization by the states compared to VAT regime. The result is also similar for both the major state groupings irrespective of their high producer and less producer status. This could reflect a greater inefficiency in tax administration for major states in India in spite of recent tax reform efforts.
When we consider minor more producer states (shown in column 4 of Table 3) which comprises a smaller four number of states in the group, the result suggests that per capita GSDP has the strongest impact in raising their own indirect tax revenue mobilization even comparing all other major state groups. It is seen that the output shares from agriculture and services have a significant positive association with their tax mobilization efforts of these states, while their industry share does not have a strong association. The social sector spending is not significantly associated with indirect tax revenue efforts of states. While increased capital outlay to GSDP induces states to make greater efforts to collect more indirect tax revenues, transfers from centre in ways of tax devolutions and grants induce a negative impact on their own indirect revenue mobilization efforts. These states might be financing their increased capital expenditure partly from indirect tax revenues and partly through increased borrowings. Similar to the first state group, corruption cases charge-sheeted have no significant impact on revenue mobilization of these states. The GST regime exerts a significant adverse impact on tax revenue mobilization efforts, while VAT regime has no significant impact.
Finally, when we focus on FMOLS estimates for minor less producer states (see column 5 of Table 3), it suggests that like more producer minor category states, per capita GSDP is having a very strong positive impact on revenue mobilization. The agricultural share has no impact on indirect tax revenue effort of such states. In contrast, share of industry and services significantly induces own indirect tax revenue mobilizations of these states. The social sector spending and own revenue collection from other sources (direct and non-tax revenues) have a negative impact, while capital outlay is having positive impact on revenue mobilization of these states. The real gross transfers (tax devolution and grants) from centre have no significant impact on their own indirect tax revenue mobilization efforts. In contrast to other groups, the use of ICT significantly induces decreasing own indirect tax revenues efforts of these states along with similar implications of the quality of governance. The GST regime strongly induces greater revenue mobilization efforts of these states among the four mutually exclusive state panel groups, while VAT has no significant impact on their revenue mobilization efforts. This can be observed from all the appendix Figures (1, 2, 3 & 4) which show that despite their low industrial share in total output, most of the minor states have benefited in raising more OTR, which could be because of their greater consumption share than production share in the total output.
When we consider all the major states irrespective of more producing or less producing (see column 6 of Table 3), we see that per capita GSDP is significantly leading to greater indirect tax revenue mobilization. The share of agriculture and industry do not induce indirect tax revenue mobilization efforts. Services share induces greater indirect tax revenues. Real social sector spending is having an adverse impact on tax mobilization efforts of states along with corruption cases charge-sheeted affecting the revenues in the same direction. In contrast, capital outlay, own revenue from other sources (other than commodities and services like direct taxes and non-tax revenues) and surprisingly the use of ICT and collection cost to total tax revenues induce increased tax mobilization efforts of all the major states. It shows although both VAT and GST have negative impacts on tax efforts of states which is consistent with each major group of states, but VAT has a marginally greater negative impact compared to GST on tax revenue mobilization efforts of these states.
In contrast, when we consider all minor states as a panel ( see column 7 of Table 3), it further shows that per capita income has the stronger positive impact on tax revenue mobilization efforts of states. The shares of agriculture and services are highly inducing them to realise increased indirect tax revenue mobilization, while industry share does not have any impact, implying that structural factors are quite important in determining tax mobilization efforts of these states. Unlike all the major state groupings, the social sector spending has a significant positive impact along with own revenues from other sources and increased use of ICT which have similar impacts. The capital outlay to GSDP, transfers from centre to states and quality of governance measured from cases charge-sheeted per million population have no impact, while collection costs have a significant negative impact on indirect tax revenue mobilization. Comparing the impact of VAT and GST, it shows that although both have positive effects on own indirect tax revenue mobilization, but GST has a slightly greater positive impact compared to VAT.
When we consider all states together in one group (see column 8 of Table 4), we observe that per capita RGSDP has a positive impact on own indirect tax revenue mobilization. The share of agriculture, industry and services, all positively impact own indirect tax revenues of states, while share of services leads to greater mobilization of indirect tax revenues even comparing industry and agricultural shares. The social sector spending while positively induces greater indirect tax revenue mobilization by states, capital outlay-to-GSDP, collection cost, use of ICT led to its decline. The transfers from centre, own revenue from other sources and quality of governance do not play significant role in mobilization of indirect tax revenues. However, GST regime is found to have a greater positive impact comparing the VAT regime.
Concluding Remarks
The study investigated the factors influencing the own indirect tax revenue realization of various state groupings based on more industrialization and less industrialization status of states within major and minor category along with examining tax revenue impact of GST versus VAT regime from a comparative perspective. We observed that per capita RGSDP has a significant positive impact on indirect tax revenue mobilization efforts for four mutually exclusive state groupings including their combined groups (such as all major, all minor and all states together). The income elasticity is further observed to be greater for minor less producer and minor high producer states followed by major high producer and major less producer states. The increase in share of agriculture although has a favourable effect on own indirect tax revenue mobilization of various state groups except major high producer group but it is found statistically insignificant for all major and all minor state groups, while having a strong positive impact for all state groups together. With increased industrial share in total output, although it has significantly and adversely affected major less producer states’ own indirect tax revenues but positively induced tax revenue mobilization efforts of minor less producer states including all states together. The increased service sector share is consistently playing a strongly robust positive role in enhancing own indirect tax revenues for each mutually exclusive state group and all state groupings. This proves the importance of structural factors in determination of indirect tax revenue of states. The states which produce more services relative to its gross output might also be demanding more services for consumption within the state economy, leading to greater realization of tax revenues.
As capital outlay of states increases, less producing states belonging to major and minor including more producers from minor category states are making greater revenue efforts to generate enhanced own indirect tax revenues. The major more producer states are neutral in own revenue generation with respect to their capital outlays, while all states on an average are making reduced tax efforts to mobilise indirect tax revenues. This may imply that states might be financing their larger portion of capital outlays through borrowings from various sources than tax financing. As a consequence, this gives rise to accumulated debt and interest liabilities in the current account of the state government budgets. Cost of collection is leading to lesser revenue effort by most state groups, as it is a drain on their real resources rather than augmenting their revenue collections which raises greater concern in time of hard budget constraints. However, on the contrary, this generates greater revenue realization efforts for major category states. The use of ICT is helping only the major less producer and minor more producer states in augmenting their tax revenue efforts, whereas it results in reduction of indirect tax revenues for major more producer and minor less producer states including all states as a whole. This means the use of ICT has been less effective for most of the states in India in yielding greater indirect tax revenues. As own tax revenue increases from other direct tax and non-tax revenue sources of states, all major category states including minor more producer states keep up with their own effort in collecting increased revenues from indirect tax sources. Transfers encourage only the major more producer states to generate greater indirect tax revenue mobilization effort whose share of transfer receipts from centre are very less comparing the minor category states, while the same either discourages minor more producer states to mobilise greater indirect tax revenues or does not have any effect on other state groups. In other words, major producer states keep up with their own tax revenue effort even though they receive increased transfers as they reduce their reliance on transfers from the centre and as the centre provides very meagre amounts of resources in transfers to them comparing the minor states. The minor states in contrast irrespective of their own tax efforts, since they receive greater resource transfers from centre, the transfers does not influence their tax efforts. Quality of governance measured in corruption cases charge-sheeted per million population is resulting in loss of indirect tax revenue mobilization in major less producing and minor less producing states, while it has no effect on major and minor more producer states including all minor states and all states taken together. This implies weaker role of governance in taxation system of the country which requires serious thought on it by the policy makers in the country.
We find differential impact of tax regimes for different state groupings. Both VAT and GST have significant adverse impacts on own indirect tax revenue mobilization efforts of all major category states (more and less producer), while VAT did not have any significant impact on minor state group. In contrast, GST has having greater negative impact on indirect tax revenue mobilization efforts of minor more producer states, while it is having favourable impact for all minor less producer states. Further investigating the indirect tax revenue impact of VAT and GST on all major and all minor states, it shows that although VAT and GST have adverse effects on all major states but both the regimes have some significant favourable effects on all minor state grouping. This latter result is almost gets reflected for all the states taken together and it shows that GST is marginally having more favourable impact on tax revenues than the VAT regime. In overall, it shows that this results could be driven by the fact that minor states are greater beneficiaries from the current GST regime than major states. This finding corroborates with a study by Nepram and James (2021) conducted on North Eastern states.
Footnotes
Acknowledgements
The author is very much grateful to the ICSSR, New Delhi for funding this research project under their minor research project grant (ref no. F. No.3-16/2021/RIC). The author is very much thankful to Mrs Meenakshi Jayan for her research assistant for this research project. The author extends his gratitude to the anonymous referees of the article and the editor of the journal for providing their valuable and constructive comments, which have substantially contributed to enhancing the quality of the article to its present shape.
Declaration of Conflicting Interests
The author declared no potential conflicts of interest with respect to the research, authorship and/or publication of this article.
Funding
The author disclosed receipt of the following financial support for the research, authorship, and/or publication of this article: ICSSR, New Delhi, funded this research project under their minor research project grant (ref no. F. No.3-16/2021/RIC).