
Abstract
This article seeks to determine the real drivers of customer loyalty in the fast-moving consumer goods (FMCG) market. The study uses beer consumers in Lithuania as an empirical base for the research. A combination of qualitative (experiment) and quantitative (cross-sectional study and partial least squares structural equation modelling) research techniques are applied. The results reveal that loyalty in the FMCG market is driven by purchase frequency, promotion, price and perceived quality via moderating variables such as brand trust and brand satisfaction. Moreover, they demonstrate that consumers mostly do not recognize their favourite product among similar products; therefore, taste properties or other physical attributes of some FMCG products do not significantly contribute to the formation of brand loyalty.
Introduction
The debate about the real determinants of brand loyalty has been ongoing for more than five decades (Ebrahim, 2020; Knox & Walker, 2001; Tucker, 1964). Over this period, the focus of the research on brand loyalty has shifted from the tangible products market (Mishra et al., 2016; Ramesh Kumar & Advani, 2005) to virtual products (Kaur et al., 2020), retailers (Murray et al., 2017), perceptions of private labels (Hwang et al., 2021b) and financial services (Kosiba et al., 2018). Brand and customer loyalty have been considered to be mainly driven by the brand experience in the tangible products market (Ong et al., 2018; Rasool et al., 2021), which should be particularly true in the fast-moving consumer goods (FMCG) sector (Mostafa & Kasamani, 2020). However, some theories have challenged the abovementioned mainstream approach regarding the strength of the relationship between brand experience and brand loyalty (Hwang et al., 2021a), suggesting that brand experience is related to consumers’ perceptions of brands, which is itself influenced by various marketing measures (Chen-Yu et al., 2016) but not by the physical attributes or characteristics of the product. Some studies even contend that the average consumer is hardly able to distinguish between competitive products in the FMCG market (Robertson et al., 2018). Such discrepancies in the scientific evidence, both on a theoretical and practical levels, generate confusion regarding which factors are crucial in driving brand loyalty and what practitioners need to be aware of and consider in order to better engineer their marketing campaigns.
Therefore, the purpose of this article is to identify the key factors that contribute to brand loyalty in the FMCG market. The findings of the present research, which is based on the combination of the qualitative (experiment) and quantitative (cross-sectional study and the partial least squares structural equation modelling) research techniques further highlight the relative irrelevance of the consumer experience in the development of brand loyalty. The results of the present research contribute to the brand loyalty theory showing the importance of the habitual and transactional loyalty in the formation of brand loyalty in the FMCG market. On the other hand, our investigation also disclosed that emotional loyalty is not extremely relevant in the researched context. Additionally, we demonstrate that purchase frequency directly and positively influences the formation of brand loyalty. We show that promotion, perceived product quality and price are important factors in the development of brand loyalty in the FMCG market through mediating constructs such as brand satisfaction and brand trust.
The article is arranged as follows. The theoretical section provides a comprehensive review of the relevant literature and establishes a basis for the development of hypotheses. The methodological section introduces the materials and methods used for the research and the conceptual research model. The results section of this article presents the main findings of the research. The discussion section compares the results with the conclusions of previous work in the field. Finally, in the conclusion section, the findings are summarized, the limitations of the research are recognized, and suggestions for future research are offered.
Theoretical Background and Hypotheses Building
Studying food products, Kadanali and Demir (2018) explain purchase frequency as an effect developing from brand familiarity and mutual trust. Product trust is important and related to purchase frequency: the higher the trust, the more likely consumers are to purchase a product, as noted by Benson et al. (2020) in a study on trust in food brands. Based on the work of Lin et al. (2017), Atulkar (2020) argues that trust helps to develop and maintain lasting relationships with consumers, thereby creating brand loyalty. Indeed, consumers buy products from trusted brands more often because the perceived risk associated with choosing or purchasing them is lower (Atulkar, 2020). Relatedly, in a study of consumer loyalty in the soft drinks market, Fortes et al. (2019) claim that customers who buy branded products more frequently and build trust in the brand will be more resistant to negative situational influences and competitors’ marketing efforts.
Studying organic products, Watanabe et al. (2021) state that consumers’ confidence in a brand increase with higher purchase frequency. By purchasing the same product or brand regularly, a person becomes loyal over time because of the unique attributes of that product; Mise et al. (2013) notably explain that the more often consumers buy soft drinks of a certain brand and plan to do so in the future, the more loyal they become to that brand. Based on these scientific clues, we formulate our first two hypotheses:
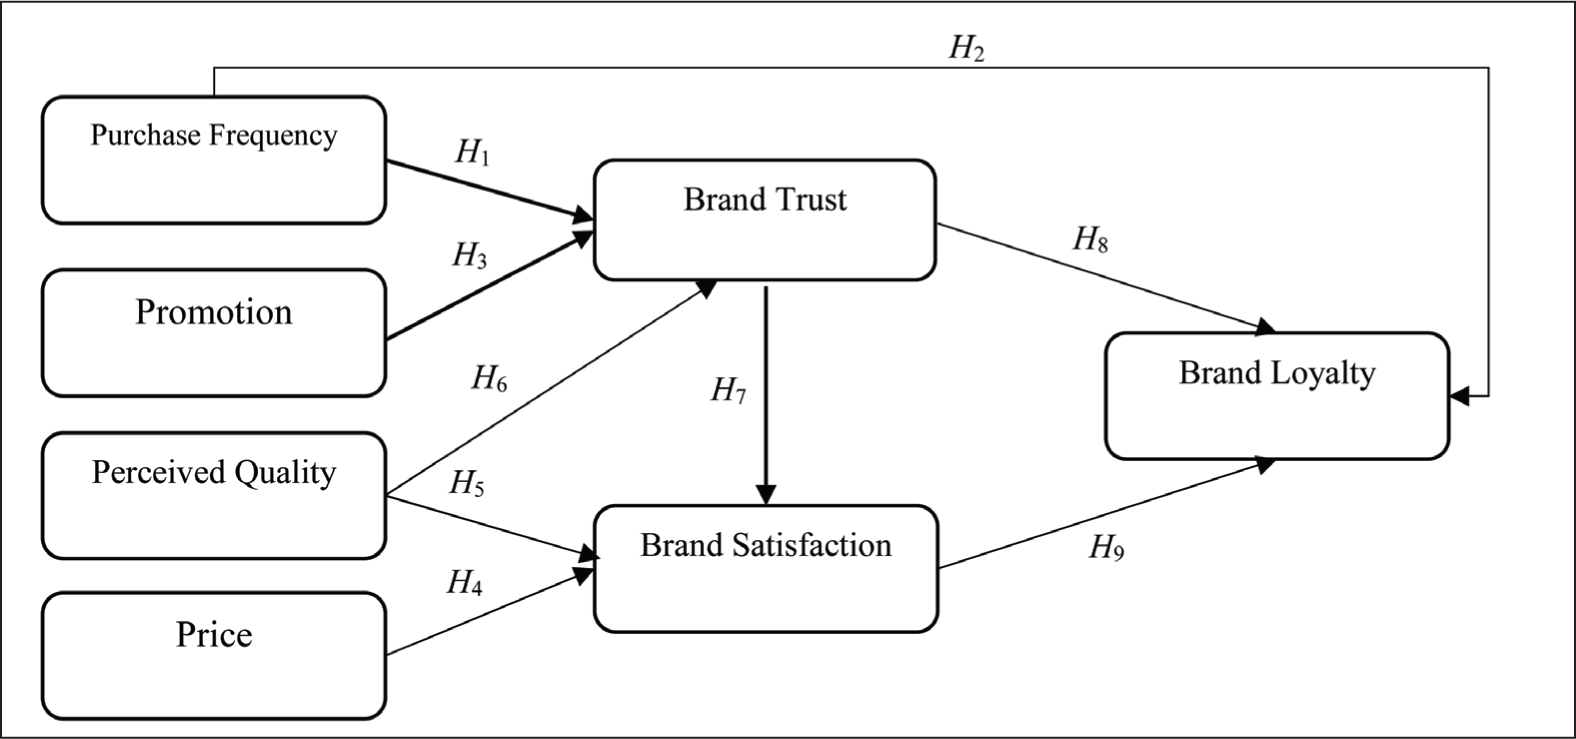
H1: Purchase frequency positively affects brand trust, ceteris paribus. H2: Purchase frequency positively affects brand loyalty, ceteris paribus.
As consumers of brands interact with advertisements or other attributes, they gradually associate the products with their brands (Nugroho, 2018). Armira et al. (2016) single out advertising as an important factor in the alcohol market and note that advertising campaigns or offers influence consumers’ decisions to choose a brand. Moreover, Kwon et al. (2021) claim that both, advertising and promotion, significantly affect brand trust, leading to better results for the brand and helping to build a relationship between consumers and companies. Similarly, Herlambang et al. (2020) conducted a research demonstrating that promotion has a statistically significant and positive impact on trust, and more frequent use of promotional tools also increases brand trust. If the consumer does not have prior knowledge of the product being purchased, the information provided through marketing channels increases trust, thereby reducing uncertainty for the consumer (Kim et al., 2019).
However, the evidence remains contradictory. Hulu et al. (2018) argue that advertising does not increase consumer trust in a brand, although they note that it may if the appropriate advertising method (such as direct-to-consumer sales) is applied. Importantly, advertising can also have negative effects, such as increased price sensitivity, reduced consumer loyalty (Mendez et al., 2015) and poorer attitudes about product quality if promotions or lower prices are advertised too often (Soomro, 2019). Based on the aforementioned evidence highlighting the significance of promotion in the development of customer loyalty, we formulate our third hypothesis:
H3: Brand promotion has a positive effect on brand trust, ceteris paribus.
Price is the most important factor that consumers consider when making repeated purchases of certain goods or services (Lie et al., 2019) and their main criterion for evaluating a product (Pratama et al., 2019). When consumers experience benefits or satisfaction from the products they receive, they perceive their price as reasonable and fair (Ekawati & Hutama, 2020). Brand satisfaction is a significant factor in consumer loyalty and is itself partially determined by the price (Delima et al., 2019; Khoironi et al., 2018; Lie et al., 2019; Pratama et al., 2019). Berliansyah and Suroso (2018) also find a positive and significant relationship between these elements specifically regarding the influence of food and beverage prices on satisfaction.
Overall, price plays a significant role in determining consumer contentment or discontentment with a brand across various dimensions. In a study on alcohol consumption, Armira et al. (2016) prove that price is indeed important when choosing and buying alcoholic beverages as most consumers would likely select a cheaper alternative if the price increased. Although price is one of the most flexible marketing elements, companies still face difficulties in determining it and finding the ideal option for their consumers (Khoironi et al., 2018). It is especially important for brands to set a price that is right for consumers. Based on this evidence, we formulate our fourth hypothesis:
H4: A perceived low price positively affects brand satisfaction, ceteris paribus.
High-quality evaluation is beneficial for brands because it gives customers a reason to buy products, differentiates brands’ products from similar products offered by competitors, allows them to sell at a higher price and encourages and facilitates brand development (Alhaddad, 2015). Farizan et al. (2019) note that when brands meet or exceed consumers’ expectations, maintaining quality in all aspects of the product, consumers will be more interested in buying their products and feel confident about their choice. Thus, brands can sell at a higher price by ensuring the best quality in the market (Beig & Nika, 2019).
In their study of consumer satisfaction, Hudaya et al. (2021) find a positive relationship between quality and consumer satisfaction and note that satisfaction is a reflection of quality. This means that if quality improves, customer satisfaction with the brand will also increase. A positive and significant relationship between these factors is also demonstrated by Berliansyah and Suroso (2018), Calvo-Porral and Levy-Mangin (2016) and Aquilani et al. (2015).
Further, perceived quality is shown to have a positive relationship with consumer trust (Abdelmawgoud & Abdelnaby, 2020; Cuong, 2020). Fortes et. al. (2019) argue that perceived quality promotes brand awareness and recognition in the market, resulting in consumers having greater trust in the brand and feeling that they take a lesser risk when they purchase its product. Moreover, Marakanon and Panjakajornsak’s (2017) research findings indicate that perceived quality has a significant and positive impact on customers’ brand trust.
Coincidentally, perceived quality is also essential in generating consumer loyalty to brands (Calvo-Porral & Levy-Mangin, 2016). Hudaya et al. (2021) report that product quality positively affects loyalty, suggesting that if companies focus on high product quality, consumer loyalty can be easily gained. Nonetheless, this perceived relationship between quality and loyalty is not perfectly clear given that Chadwick and Piartrini (2019) find no significant association between quality and loyalty among youths. From the scientific evidence above, we conclude that perceived quality is one of the key factors in understanding consumer loyalty as it affects both trust and brand satisfaction. Therefore, the following hypotheses are proposed:
H5: Perceived quality positively affects brand satisfaction, ceteris paribus. H6: Perceived quality positively affects brand trust, ceteris paribus.
According to Kim et al. (2021), when customers perceive that a brand is fulfilling its commitments or expectations, they tend to exhibit greater trust in it; even in the event of unforeseen difficulties, the brand will make efforts to ameliorate the situation. Bernarto et al. (2020) claim that trust is the main and most important aspect of creating business–consumer relationships. By trusting a brand, consumers choose to buy its products repeatedly (Bernarto et al., 2020), which implies that trust helps to maintain long-term relationships and reduces the customers’ perceived risk when purchasing specific products (Atulkar, 2020). Huang (2017) states that if customers exhibit trust in a brand, hey may be more prone to make purchases from the brand in the proximate future or have the intention to do so, thus forming behavioural loyalty. Over time, as their trust in the brand grows, customer loyalty begins to develop.
Numerous studies have identified brand trust as an important variable in determining brand loyalty (Soomro, 2019). Marliawati and Cahyaningdyah (2020) argue that trust is a crucial element in formation of brand loyalty. Chinomona (2016) also observes a strong relationship between these elements. Similarly, Marliawati and Cahyaningdyah (2020) find that trust is the main factor influencing brand loyalty. In the soft drink market, Menidjel et al. (2017) note positive relationships between trust and satisfaction and trust and loyalty. However, these findings are partially contradicted by Bianchi (2015) in a study of wine brand loyalty, which contends that trust in a brand has no significant relationship with loyalty. To test whether brand trust has an effect on brand satisfaction and brand loyalty the following hypotheses are proposed:
H7: Brand trust positively affects brand satisfaction, ceteris paribus. H8: Brand trust positively affects brand loyalty, ceteris paribus.
Examining loyalty in the FMCG market, Farizan et al. (2019) emphasize that satisfaction is a key element in evaluating brand loyalty and leads to repurchase intentions. Marist et al. (2014) conclude that brand satisfaction has a positive relationship with brand loyalty, which entails that consumers who feel content will become more loyal to the brand. Moreover, their study reveals that the impact of brand satisfaction on trust is greater than that of satisfaction on brand loyalty.
The relationship between customer satisfaction and brand loyalty is also confirmed in the research by Mustaqimah et al. (2019), who study loyalty in the cold-pressed juices market, as well as Sudari et al. (2019), who examine food and beverage consumers. Sultan et al. (2019) state that brand loyalty will be higher if consumer satisfaction is higher. Menidjel et al. (2017) highlight that the relationship between satisfaction and loyalty becomes clearer when brand trust is considered as a mediating factor. Therefore, companies that manufacture products such as soft drinks or fruit juices should recognize the significant role that satisfaction plays in establishing trust, which in turn leads to loyalty. This literature allows us to formulate our ninth hypothesis:
H9: Brand satisfaction positively affects brand loyalty, ceteris paribus.
Further, customers’ positive and pleasant experiences with products create positive moods and emotions that help them feel better and stay loyal to the brands offering the products (Marliawati & Cahyaningdyah, 2020). Khan et al. (2016) also note that positive experiences are a key factor in building brand loyalty. Positive brand experiences are singled out as the most important factor for customers to make future purchases and recommend the brand to the people closest to them (Marliawati & Cahyaningdyah, 2020). In their research on loyalty to bottled water brands, Aung and Tan (2018) identify taste and smell as the attributes that influence brand loyalty and trust. Studying energy drink loyalty, Dharviandi (2016) similarly emphasizes that enhancing the positive taste experience is important to create brand loyalty. Relatedly, Armira et al. (2016) and Moane et al. (2020) find that when choosing an alcoholic beverage, consumers rely mostly on their personal experience, in which taste is especially important. Recent studies have in fact shown that taste is the most influential attribute of craft beer (Lerro et al., 2020), and this criterion may sometimes be more valued by customers than appearance. If the product meets the consumers’ other criteria but does not taste good, they will choose another brand in the future (Moane et al., 2020). Additionally, previous findings have revealed that even when customers are presented with similar products, they report better taste only when they are informed that the particular product is made by a brand they like (Agbaeze et al., 2017). Building on the abovementioned scientific insights, we formulate our last hypothesis:
H10: The taste experience positively affects brand loyalty, ceteris paribus.
Methodology
Our research design combines qualitative and quantitative methods. The rationale for the selection of this approach lies in the fact that it is very difficult to assess the impact of such personal features as experience using purely quantitative techniques (Jayaratne, 1993), so in order to test such features as taste experience, it is suggested to use a qualitative research techniques (Jimborean et al., 2021). If it is possible, variations of the experimental design are preferred (Lee et al., 2018). Following this suggestion, we first performed an experiment to test our 10th hypothesis, namely, the impact of the taste experience on loyalty to a brand.
Qualitative Research
The experiment was conducted in December 2021 with 26 beer lovers. Before the experiment, the participants were asked about their beer consumption habits, that is, how often they drink, which beer they prefer, which beer brand is their favourite and which beer they consume most frequently (see Table A1). The study used products from beer brands that were similar to the participants’ favourite beer in terms of ingredients, taste and alcohol by volume. The beer brands used in the study are listed in Table A2. During the study, the consumers were presented with 5–7 glasses of beer, numbered 1–5 (or 1–7). The participant, not knowing which brands of beer were presented in the glasses, had to identify their favourite beer, which they always buy. The participants did not have access to any other attributes (besides taste) that could provide clues as to which glass contained their favourite beer as the same glasses with the same markings were used for all beers. The participants were asked to find their favourite beer and rank it first. All other beers had to be ranked from second to fifth (or seventh) based on taste.
Quantitative Research
A cross-sectional survey was employed as a research tool to test our first nine hypotheses. This is a quite common research technique for analysing various factors affecting customer loyalty (Morgeson et al., 2020; Morkūnas, 2023; Ngoma & Ntale, 2019; Tang & Li, 2015). Already validated scales were used for the research. This approach is valuable as it helps to ensure the robustness of the results (Rindfleisch et al., 2008). The statements and scales in the survey were adapted from the following sources: The statements for the evaluation of purchase frequency and price were taken from Mise et al. (2013), brand trust from Bianchi (2015), Delgado-Ballester and Luis Munuera-Alemán (2001) and Soomro (2019), perceived quality from Khan et al. (2019) and Mise et al. (2013), brand satisfaction from Bianchi (2015) and Mise et al. (2013), promotion from Krystallis and Chrysochou (2014) and Kwon et al. (2021), and brand loyalty from Bernarto et al. (2020) and Soomro (2019). A five-point Likert scale was used for the evaluation of the statements.
The questionnaire was uploaded onto a survey platform and disseminated online using social networks. The survey was shared in various groups on Facebook (university students, beer lovers) or sent out individually to users on Facebook and Instagram. The respondents answered the questions anonymously to ensure privacy and impartiality. Only people over the age of 20 years participated in the research. This limitation was set taking into account the legal drinking age in the Republic of Lithuania. The survey was conducted between March 2022 and May 2022 with a total of 236 respondents. Although this is not a very high number (which may be considered a limitation of our study), it corresponds to the average number of respondents (246) in similar studies aiming to reveal other aspects of customer loyalty: 300 respondents (Bianchi, 2015); 151 respondents (Chinomona, 2016); 284 respondents (Fortes et al., 2019); 300 respondents (Sudari et al., 2019); 290 respondents (Kurnianingsih & Riorini, 2021); 151 respondents (Hudaya et al., 2021). Sample used in our research is considered to be sufficient for deriving robust results using partial least squares analysis, which is design to produce reliable results from a relatively small samples (Vinzi et al., 2010).
A partial least squares modelling technique was selected as the main approach for processing the quantitative data. This is one of the few research instruments deriving reliable and robust results from smaller sample sizes (Hair et al., 2019; Morkūnas, 2022). The hypotheses that were tested using quantitative research are represented in Figure 1.
Results
Although being named the 10th in our research, the H10 was tested first using a qualitative research method—an experiment. The results (presented in detail in Table A2) shows that 17 out of 26 respondents (65%) could not recognize their favourite beer between its main rivals. Such a high margin 2/3 who did not recognize against 1/3 who recognized allows us to state that H10 is rejected (Quinn & Keough, 2002), that is, it can be stated that taste experience is not among the major factors creating a brand loyalty in a FMCG market.
The profile of the research sample is presented in Table 1.
Demographic Characteristics of the Sample.
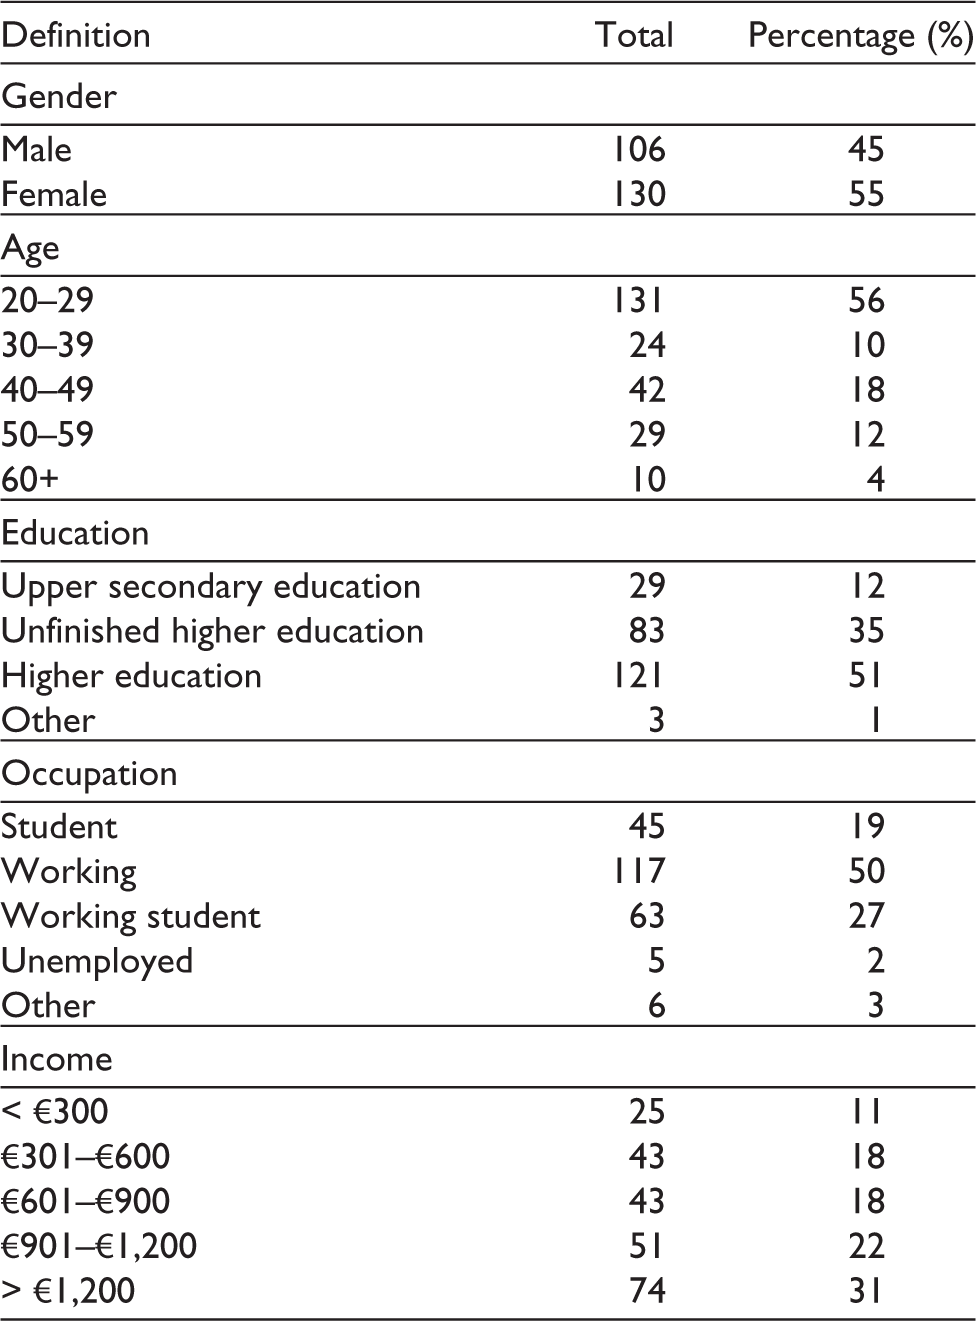
A total of 236 respondents participated in the survey, of which 55% were women and 45% were men. The age of the participants varied between 20 and 72 years, and persons younger than 20 years did not take part as they are legally forbidden from consuming alcoholic beverages in Lithuania. The largest share of the respondents (55%) consisted of young persons between 20 and 29 years of age. Slightly more than half of the respondents (51%) had a higher education, and a significant percentage (35%) were pursuing one at the time of the survey. This is expected considering that more than half of the respondents were under 30 years of age. According to a study by the Lithuanian Statistics of Lithuania (2020), persons with a higher education generally consume alcoholic beverages more often than persons with lower educational attainment.
The monthly income of the respondents was distributed variedly: 29% earned less than €600 per month, and 31% made more than €1,200 per month. This can be explained by the age distribution of the respondents as a significant number of them were under 30 years of age, which implies that their income may be lower. The lowest average (2 ±1.185) allows us to conclude that brands’ advertising campaigns have a very minor impact on the consumers. Judging only from the descriptive statistics, promotion appears to be perceived by the consumers as having the smallest impact on brand selection. The highest mean (Table 2) is found for statements related to consumer satisfaction, which shows that the customers of brands are satisfied with their decision to buy the products of the chosen brand (4.3 ±0.922) and with the specific brand experience (4.3 ± 0.914).
Descriptive Statistics and Model-Reliability Indicators.
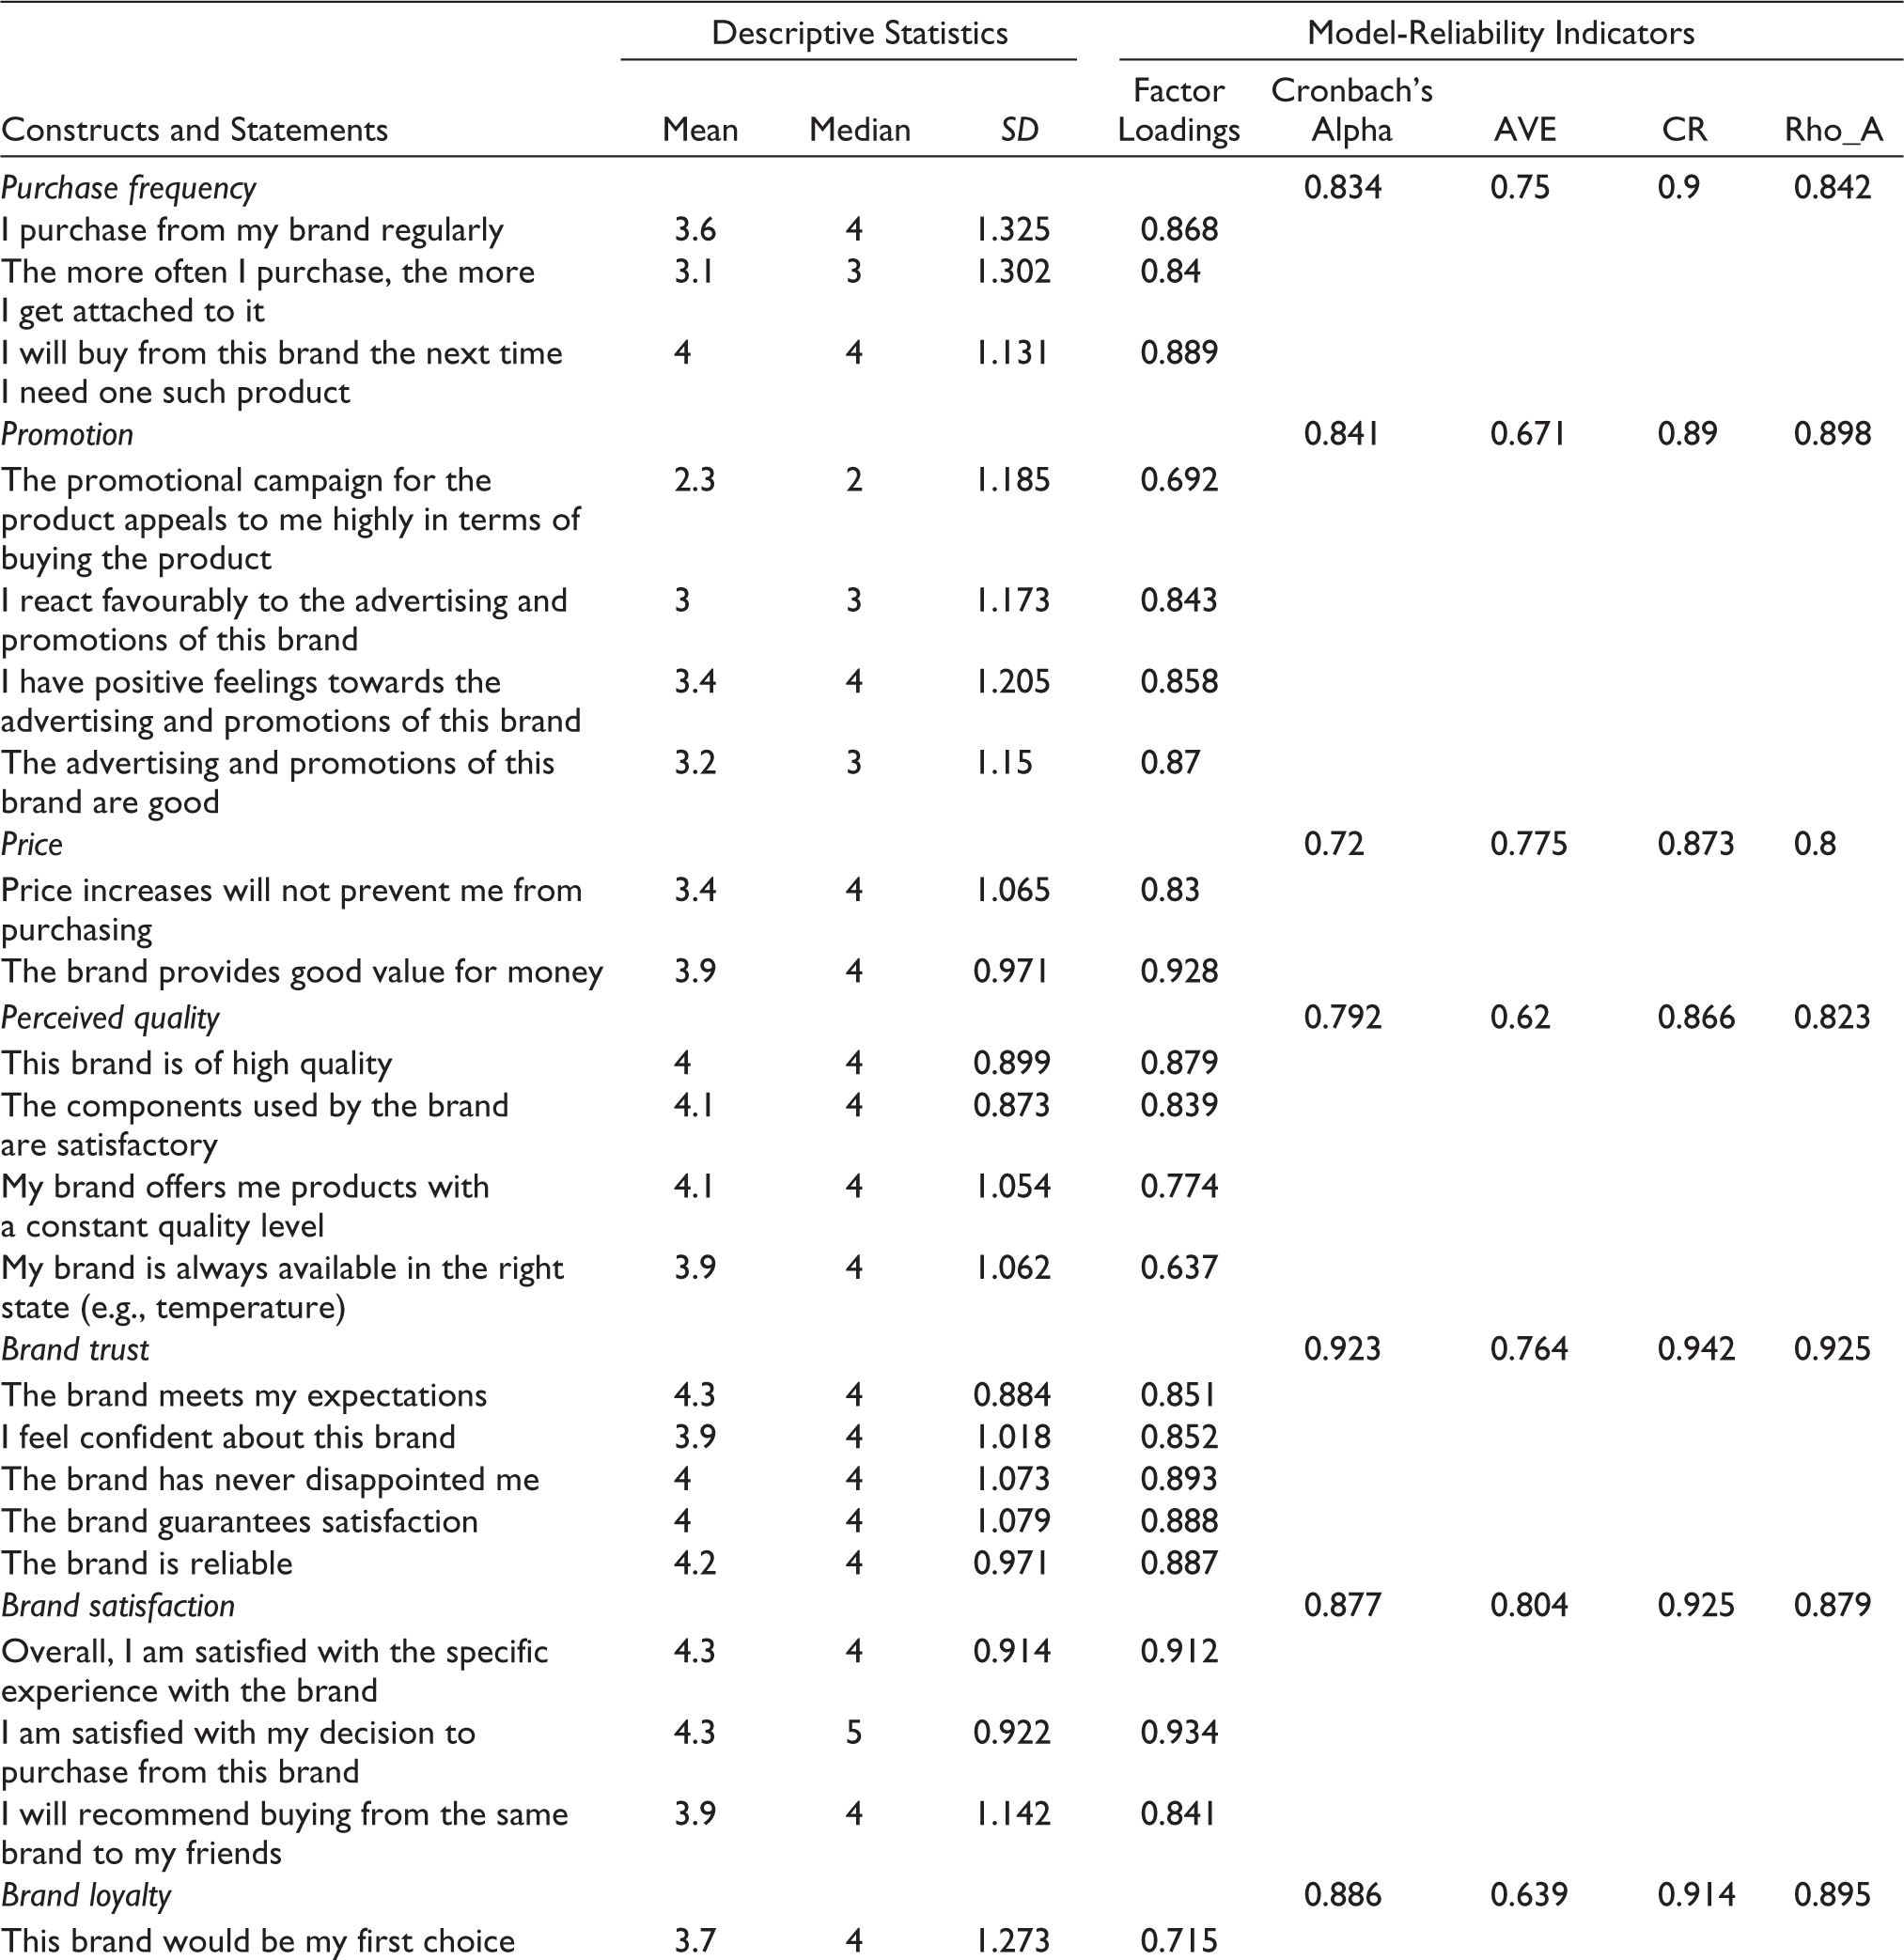

A structural model was derived to test the hypotheses (see Annexure). The descriptive statistics for the research and the model-reliability indicators are presented in Table 2.
The Cronbach’s alpha ranges between 0.720 and 0.923; thus, the statements can be considered suitable for measuring the research constructs because they are above the recommended reliability limit of 0.7. The composite reliability of a research varies between 0.866 and 0.942, meaning that the research constructs are homogenous and reliable (Vinzi et al., 2010).
To check the convergent validity, factor loadings were calculated. The figures we obtained are between 0.637 and 0.934. The average variance extracted (AVE) ranges from 0.620 to 0.804. All these values are acceptable as they are above 0.5 (Cuong, 2020). Additionally, no collinearity issue was identified as none of the VIF values reached 3 (see Table A3), which is considered to be a very good result (Purwanto & Sudargin, 2021). The R2 values for the constructs are the following: 0.589 for brand loyalty, 0.696 for brand satisfaction and 0.596 for brand trust. Consequently, they explain 58.9%, 69.6% and 59.6% of the variance, respectively.
Further, we applied a novel approach in order to test the discriminant validity: the Heteroit-Monotroit (HTMT) criterion introduced by Henseler et al. (2015), which measures the similarity between latent constructs (Table 3).
Results of the HTMT Correlations.
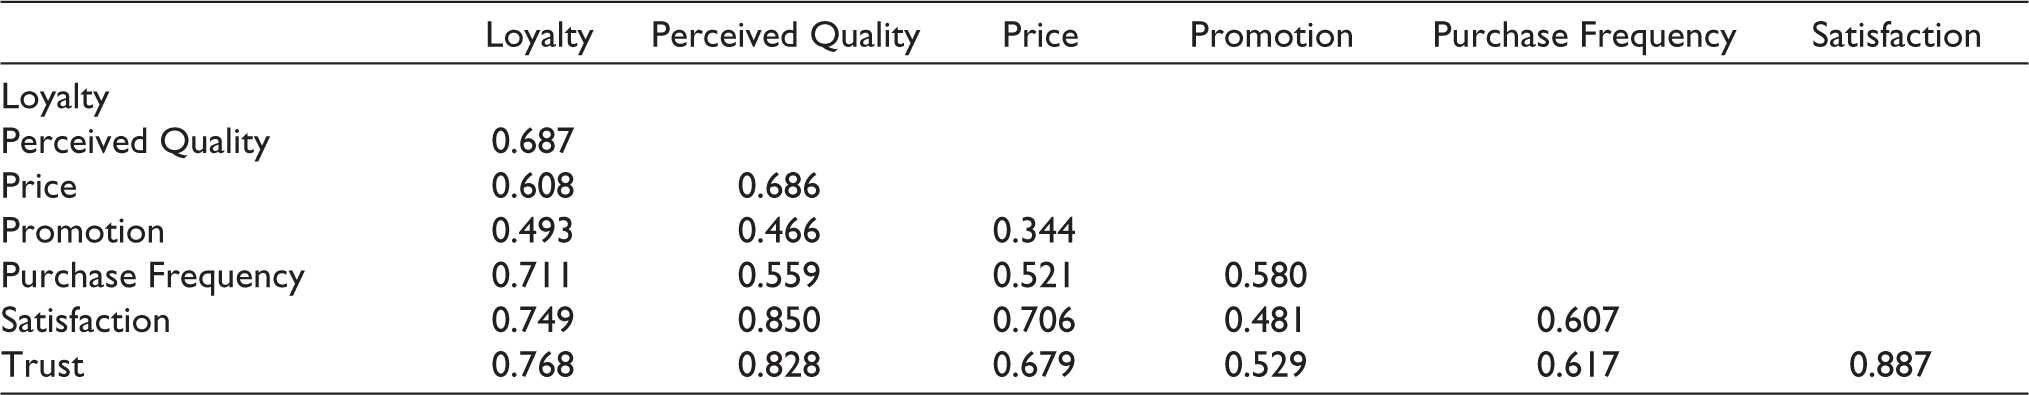
All correlations satisfy the required threshold of < 0.9 (Henseler et al., 2015), indicating that the discriminant validity of our constructs is sufficient.
Additionally, to determine whether the independent variables in a model have a significant effect on the dependent variables, the effect size (f2) had to be calculated (Vinzi et al., 2010). The f2 values for our constructs are presented in Table 4.
Effect-Size Values.
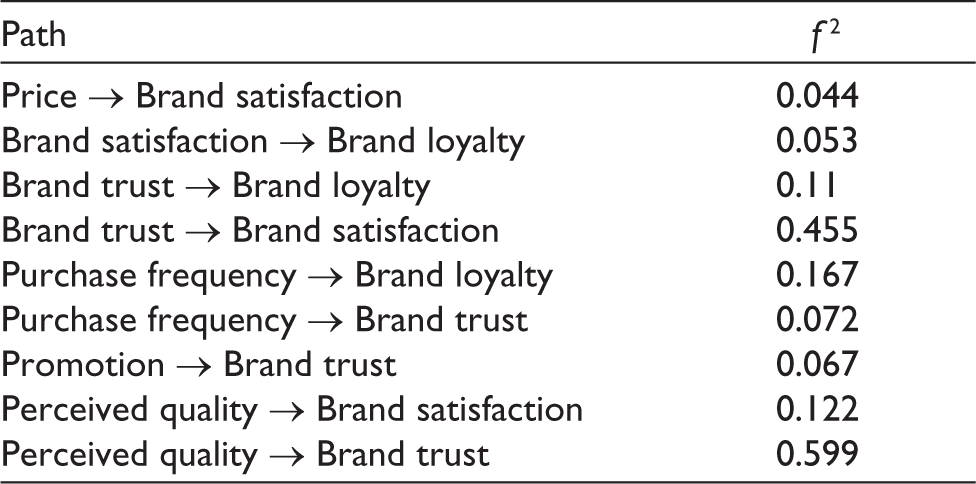
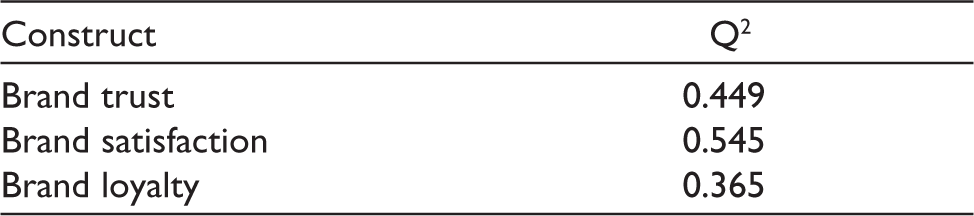
The results of the effect size (f2) show that the constructs of the model have small, medium and high local effect sizes. The high effect size of the model concerns the relationships between brand trust and brand satisfaction and between perceived quality and brand trust. Meanwhile, a moderate effect size is found for the relationship between purchase frequency and brand loyalty. The predictive relevance of the model was assessed using Stone-Geiser (Q2) criteria. Brand trust and brand loyalty show moderate predictive relevance, while brand satisfaction exhibits high predictive relevance (Table 5).
Results of the Stone-Geiser Criteria for the Constructs.
An index of goodness of fit of the model was also calculated, producing a value of 0.67, significantly above the required limit of 0.36 (Wetzels et al., 2009). This means that the model is suitable for assessing the relationships between variables.
Once the model’s suitability for the research had been ascertained, we tested hypotheses 1–9. All the hypotheses were confirmed (Table 6).
Results of the Testing of Hypotheses 1–9.
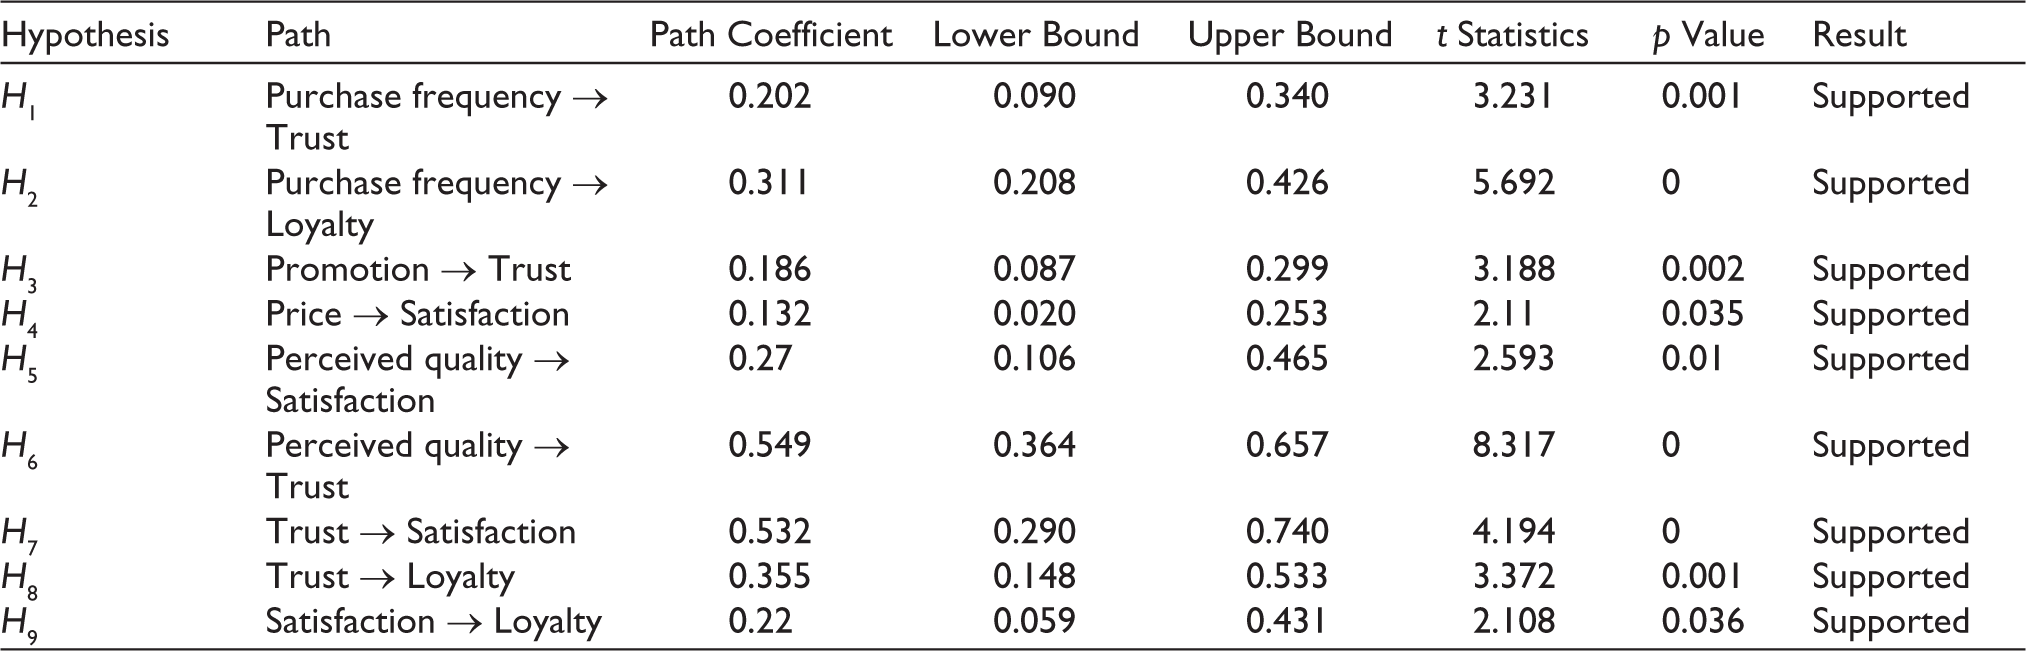
As it can be seen from the Table 6, contrary to the experiment results, all the hypotheses raised for the quantitative research were supported. These findings confirm that brand loyalty in the fast-moving consumer market is driven not by the taste experience but by some intrinsic psychological characteristics (perceived quality, perceived price, promotion, purchase intensity, etc.) most of which can be influenced by various marketing actions.
Discussion
The main findings of the research were compared with the conclusions of the prevailing theoretical streams in the field of study. We demonstrate that purchase frequency has an impact on brand trust in an FCMG market. We also show that purchase frequency affects brand trust less than perceived quality (path coefficients of 0.202 and 0.549, respectively). Purchase frequency also has an influence on the formation of FMCG brand loyalty. These findings strengthen the arguments of Mise et al. (2013) according to which the more often consumers purchase products from a particular brand, the more loyal they become. Our results also indicate that the relationship between purchase frequency and brand loyalty is stronger than that between purchase frequency and brand trust. Further, we report a relatively weak relationship between promotion and brand trust (0.186). This partially contradicts the findings of Kwon et al. (2021) in the restaurant sector, which suggest that promotion has a significant effect on brand trust. However, our results may confirm the argument by Hulu et al. (2018) that for advertising to have a significant impact on brand trust, brands need to find out which type of advertising is appropriate for their consumers.
Coincidentally, price affects consumer satisfaction with a brand, but it is the weakest of the relationships identified in the present study. A relatively weak relationship between price and brand satisfaction may mean that price is not a very important factor in determining consumer satisfaction in an FMCG market and that price changes may have less influence on consumers’ decision to purchase a product of a particular brand that builds its marketing strategy on a low price. We argue that if the price is set correctly, it will affect brand satisfaction, just as a poorly set price can reduce consumer satisfaction with a brand in an FMCG market, but no more. Meanwhile, perceived quality influences both brand satisfaction and trust in the FCMG brand. Quality has a positive influence on customer satisfaction, which is related to the fact that when product quality improves, consumer satisfaction with the product also increases. This corresponds to the results reported by Hudaya et al. (2021) and Izzudin and Novandari (2018), who focus on the relationship between these constructs. Suchánek and Králová (2019) and Khoironi et al. (2018) also proved the existence of a significant and strong relationship between perceived quality and satisfaction in the FMCG market. The results of our study suggest that perceived quality has a stronger relationship with brand trust than with brand satisfaction.
Moreover, there is a significant and quite strong relationship (0.532) between brand trust and brand satisfaction. This confirms the results of Bianchi’s (2015) study, which found that brand trust significantly and positively affects brand satisfaction. The relationship between brand trust and brand satisfaction was also observed by Menidjel et al. (2017) and Ali and Muqadas (2015). We also find that brand trust has an impact on brand loyalty (path coefficient: 0.355). This contrasts with the findings of Bianchi’s (2015) study of wine brand loyalty, where trust did not influence loyalty, but confirms those of Menidjel et al. (2017) and Alan and Kabadayı (2014) in the soft drink and food industry, which note that consumers who trust a brand will be more loyal to it. The hypothesis that brand satisfaction affects brand loyalty is also confirmed, but the relationship between these variables is weaker than that between brand trust and brand loyalty. Similarly, a positive relationship between satisfaction and loyalty was observed by Ali and Muqadas (2015), Bianchi (2015) and Farizan et al. (2019). In addition, Suchánek and Králová (2019) and Hudaya et al. (2021) emphasized that increasing satisfaction will increase loyalty.
Conclusion
Our research showed that taste experience cannot be named as one of the determinants of brand loyalty in the FMCG market. Brand loyalty in this particular segment is influenced by the perceived quality, purchase frequency, promotion and perceived price through mediating variables brand satisfaction and brand trust; the latter showing the strongest positive influence on the formation of consumer loyalty. Thus, in order to develop and strengthen consumer loyalty to FCMG brands, the emphasis should be on building consumers’ trust in the brand. Companies operating in this market should thus focus on business strategies related to the promotion of trust. To do so, promotion can be focused on ensuring that advertising and other offers from the brand meet consumers’ expectations and are appropriate for the intended audience. Furthermore, brands must guarantee the constant high quality of their products and their proper presentation (e.g., adequate temperature) at the point of sale.
The perceived high quality of beer products also positively affects consumer satisfaction with a brand. Therefore, it is particularly important to ensure the quality of both the products’ components and their presentation. To cultivate consumer satisfaction, the brands should not only maintain high product quality but also offer a reasonable price. Indeed, a properly set price can increase customer satisfaction, whereas an inappropriate (e.g., too high) price can reduce it. Thus, it is important for FCMG brands to determine what value for money is acceptable and appropriate for their target market. Both of these factors determining consumer satisfaction are essential to the formation of loyalty because customers who are satisfied with a brand and its products will purchase these goods again and be less vulnerable to the actions of competitors, such as various offers and promotions. Further, FMCG brands need to encourage consumers to buy the products they offer more often because the frequency of purchase does not only help build trust but also increases consumer loyalty to a brand.
The revealed importance of the purchase frequency towards the formation of the brand loyalty can be named habitual (Dapena-Baron et al., 2020) although showing some transactional loyalty characteristics due to focus on the economic benefit, that is, price (Louis et al., 2021). The disclosed absence of a substantial component of the emotional loyalty in the formation of a brand loyalty in the FMCG market may also have a potential for the practical implications. Relative low consumers’ emotional connectivity with the brand make some the most sophisticated marketing techniques (neuro marketing, etc.) not particularly useful in the FMCG sector, leaving marketers with a limited arsenal of tools for the creation of brand loyalty. Our findings also allow to derive additional practical implication. The revealed relative irrelevance of the taste experience in the formation of the brand loyalty suggests marketing managers not to overinvest into the some hardly noticeable taste features. It is worth to consider focusing more on the creation of the positive perception about their brands using marketing tools oriented at building a desired perceived quality, perceived attractive price or invest more on the promotion activities inducing repeated purchases.
Summarizing our research, we can state that, in general, the brand loyalty in FMCG sector is driven by the perceptions in the consumer mind created by various marketing actions (perceived quality, perceived price, etc.) but not by, at least, partly tangible factors, such as taste experience.
One of the limitations of our study lies in the fact that not all participants in the experiment may have been familiar with all the beers they tasted. Thus, their preferences may have changed during the experiment. This could partially explain why such a high percentage of the participants did not recognize their favourite product or ranked it behind some of the alternatives presented. To overcome this issue or at least minimize it, we used only well- established beer brands, which have been in the market for no less than 5 years. However, we still cannot fully reject this possible source of research limitation. Although our experiment employed a sufficient number of participants to derive scientifically reliable results (Quinn & Keough, 2002), a higher number of participants would be appreciated to derive more robust results.
Another limitation may emerge from the empirical basis for our quantitative research. We derive our conclusions from the category of beer-product consumers. Other categories may display slightly different results, in part due to the fact that younger consumers (who were not included in the research) are proven to slightly differ in their consumer behaviour (Spero & Stone, 2004; Pham et al., 2019). And in some product categories young consumers are even a focal target group (candies, etc.). Therefore, the broader study of the different FMCG categories with a view to revealing the main determinants of brand loyalty in each category could also be a promising avenue for research with the potential to contribute to marketing science. Another prospective research avenue could be the more thorough investigation of the balance between habitual and transactional loyalty in the role of building the brand loyalty in the FMCG market. Trying to disclose some possible consumer/product groups where emotional loyalty still plays part in the formation of the brand loyalty could also contribute to the development of knowledge in this scientific area.
Footnotes
Declaration of Conflicting Interests
The authors declared no potential conflicts of interest with respect to the research, authorship and/or publication of this article.
Funding
The authors received no financial support for the research, authorship and/or publication of this article.