
Abstract
We analyse how structural shifts affected India’s productivity growth from 1983 to 2017. The analysis is carried out within a broad three-sector level of disaggregation of the aggregate economy. We show that about 29% of the aggregate productivity growth of India during this period comes from structural change. While this contribution has declined since 2007, the remaining 71% of the productivity growth originates within the individual sectors, especially within the tertiary sector, which alone explains about 30% of this productivity growth. About a quarter of the total productivity growth that occurred prior to economic liberalization in 1991 is attributed to the tertiary sector. We found that between 2007 and 2017, the tertiary sector was responsible for almost 38% of India’s total productivity growth. This contribution is much larger than the contribution made by structural change, and, therefore, the significance of the tertiary sector in Indian economic expansion is growing. Our findings also indicate that the most structural change occurred between 1998 and 2007, which may have contributed to productivity increase in the decade.
Keywords
Introduction
The year 1991 is considered a watershed moment in Indian economic history. India has witnessed a remarkable increase in its aggregate labour productivity after the liberalization in 1991. 1 An average Indian worker used to earn ₹51,872 ($1,036.32) in 1983. This figure increased rather nominally to ₹62,815 ($1,254.94) in 1991 but the most impressive ₹289,491 ($5783.59) in 2017. Overall, during 1981–2017, a 5.6 times jump in earnings implies a mean rate of productivity growth of 5.19% per annum. 2 During 1983–1991, the average productivity growth rate was a meagre 3.03% per annum, but during 1991–2017, it became a phenomenal 6.06%. The latter period covers the years 2007–2009, when a dramatic economic recession affected almost all the economies of the world, making this growth rate an even more significant achievement. Understanding the source of this productivity growth has umpteen policy consequences and lessons for the other economies in the emerging world.
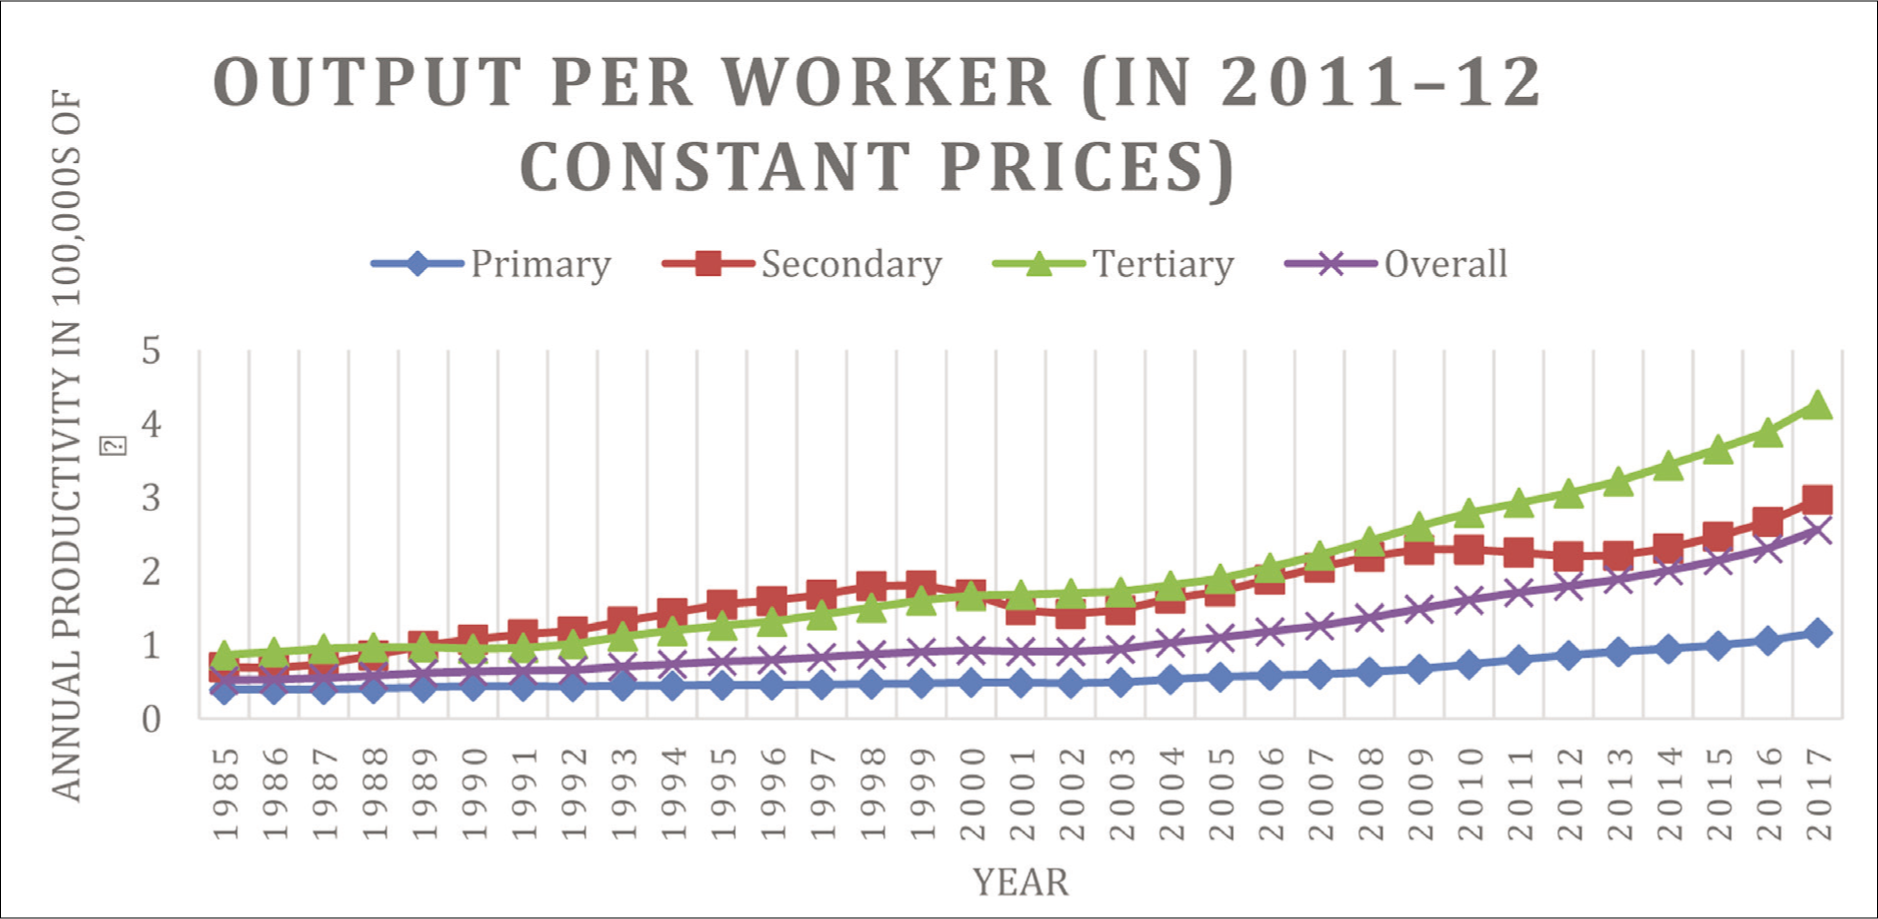
In Figure 1, we have plotted the annual average productivity (or output) level of a representative Indian worker in three broad sectors of the economy. A closer look reveals that the tertiary industry is expanding far quicker than the other two, and the primary sector is growing at the lowest rate for the entire time horizon. However, the growth rate in the secondary sector is not uniformly positive as there are many episodes of negative growth rates (e.g., 1999–2001 and 2008–2011) in this sector. Overall, the aggregate growth (‘Overall’ curve in Figure 1) rate has been positive for the entire time horizon if we take a 3-year moving average.
Scholars (McMillan & Rodrik, 2011; Rodrik, 2013; McMillan et al., 2014) hypothesize that structural change, that is, relocation of employment from the less productive traditional sectors to the more productive modern sectors, could play a crucial role in growth for the emerging economies. Consequently, it is imperative to evaluate the share of structural change towards this massive productivity growth. While some policies may be universally applicable for the productivity growth of an economy, some other policies may facilitate a trade-off for the productivity growth of a sector in lieu of another one. While some of India’s productivity growth is taking place within the individual sectors, the process of sectoral reallocation of labour (or the structural change) may explain a large part of this productivity growth. We measure the various components of the productivity growth of the whole economy explained due to structural shift. We demonstrate our results using the standard shift-share analysis and at a three-sector level of disaggregation where the broad sectors are primary, secondary and tertiary.
We divide the entire period of our investigation into four sub-periods which are 1983–1991, 1991–1998, 1998–2007 and 2007–2017. The idea of this division may merit a discussion. A similar spread for the sub-periods is a desirable criterion we sought while dividing the sub-division into different parts. We consider the pre-1991 years as the initial sub-period. After the initial economic wave of economic reform in 1991, the second wave of reforms effectively began in 1998 when India got a stable government at the centre after a few years of political instability. This is why we consider 1998 as the second breakpoint. The year 2007 gives a natural break to compare the pre- and post-global economic crisis period. The absence of microdata measuring the labour force during 2012–2017 precludes us from considering any further breakpoint post-2007.
Growth in gross domestic product (GDP) occurs when factors of production shift from outdated to cutting-edge industries. Rising productivity, rather than the sectoral GDP share, is what drives economic growth. The rate at which factors of production are transferred from one region to another is one of the most significant measures of economic growth. This means that, rather than focusing on just a few industries, the best way to assess the economy’s future is to consider the labour productivity of the entire economy. Our article is one of the first in the Indian context to take a look at the development experience of the Indian economy from this angle.
The main results of our empirical investigation are as follows:
Structural change contributes to a sizable part of the aggregate productivity growth in India. However, its contribution has declined from 32% (during 1998–2007) to 23% (during 2007–2017). A major part of the aggregate productivity growth (around 71% on average) originates within the individual sectors, which is increasing. During 1983–1998, the sectoral labour shares were almost stagnant, limiting the share of structural change in backing per-labour output growth. Since 1998, workers have been moving away from the (relatively) low-productive primary sector and getting absorbed by the (relatively) higher-productive secondary and tertiary sectors. This mechanism is responsible for the beneficial impact of structural shift to the increase of total labour productivity.
Our empirical inquiry enhances the literature in the following ways. First, we have created the sector-specific labour forces by analysing the microdata from the National Sample Survey Organization (NSSO). In the absence of this exercise, comparison and decomposition of the sectoral productivities are impossible. None of the existing studies have used micro-level data in similar studies related to India for this entire time span. Second, the majority of the studies (for example, see Azenui & Rada, 2021) on this topic are cross-country in nature, and individual country-specific analysis is rare. We contribute to the literature by bringing in a focused country-specific analysis that helps explain the country’s long-run economic evolution.
The debate on the relative emphasis of the three sectors in policymaking is neither new nor settled. We offer a new perspective on this debate. If the goal of an emerging economy is to boost productivity growth, then the emphasis on different sectors may be commensurate with their propensity to growth. Our perspective unfolds a new metric to assess the relative contributions of the sectors. The policy may take care of this aspect of the sectors while considering their relative importance. In addition to this, we can evaluate the role that structural shifts play in the growth of productivity. Therefore, policymakers may actually measure the impact of the preferential treatment of a sector towards productivity change. This may offer them another dimension to policymaking in order to implement a desirable amount of structural change. We discuss this aspect of policymaking with a few examples in the section titled ‘Policy Implications’ of this paper.
The plan for the rest of the paper is given as follows. We have undertaken a comprehensive literature survey in the second section. The measurement of structural transformation and issues related to structural break have been discussed in the third section. The fourth section contains empirical investigation and results. We discuss the relevance of our work to policymaking and the limitations of our study in the fifth and sixth sections, respectively. Finally, the last section concludes the paper.
Structural Change Literature
There is a vast amount of empirical research linking structural shifts and productivity increases. 3 Some of these studies focus on the Indian market and make an effort to place a monetary value on the role that structural transformation has played in the expansion of the country’s productive capacity. Bosworth and Collins (2008) provide a ground-breaking analysis of the stagnating aggregate productivity growth in India between 1978 and 2004 and argue that structural change is largely to blame for this (see Bosworth & Collins, 2008, Table 5). According to their research, between 1993 and 2004, the service industry accounted for about 47% of the total gain in productivity. In our work, while the tertiary sector’s contribution remained at 51% from 1991 to 1998, this has declined to 39% from 2007 to 2017.
De Vries et al. (2012) analyse the issue of productivity growth for the BRICS (Brazil, Russia, India, China and South Africa) group of countries and show that India’s structural change contribution has decreased from 30% during 1981–1991 to 20% during 1991–2007 (see De Vries et al., 2012, Tables 6 and 7). Although our databases, timelines and sectoral compositions differ from theirs, we show that the contribution of structural change has an overall increasing trend during 1983–2007 at the three-sector level.
Delong (2012) has analysed the growth experience of India since independence using the framework laid out by Mankiw et al. (1992). His study captures the time period from 1960 to 1992. The main contribution of his analysis is that India’s abysmal economic performance during 1962–1980 (anecdotally referred to as ‘the Hindu growth rate’) was very much in line with the world’s average economic performance. Our study is a departure from the Mankiw et al. (1992) framework as we have not used data on human capital and physical capital.
Kohli (2006) has considered the 1980s as part of the Indian growth experience. The underlying reason for the Indian growth is postulated as the government’s favourable view of the Indian capitalist class to facilitate the growth experience. The conclusion of Rodrik and Subramanian (2005) is similar, who claim that when the government’s attitude shifted from pro-market to pro-business, it triggered the development in the economy.
For the period between 1951 and 2006, Panagariya (2008) classifies India’s economic development into four stages. From 1951 through 1965, the economy expanded at a moderate rate under a reasonably liberal economic policy. The period from 1965 to 1981 is characterized by socialist economic policies and a halt in economic growth. The years 1981–1988 are remembered for their economic recovery and partial deregulation of the economy. Finally, the years 1988–2006 are considered the most liberal in history. Using the vector autoregression (VAR) and structural break determination time series technique, Cortuk and Singh (2011) found 1988 to be the endogenous result of the structural break in the Indian economy. The results they obtained agree with those of Panagariya (2008). However, the primary variable in our research, the sectoral labour share, has been ignored by both of these previous studies.
Kathuria et al. (2010) gathered factory-level data in India and compared the rates of productivity in India’s organized and unorganized manufacturing sectors. The analysis reveals that the organized sector’s labour productivity has improved over time, while the unorganized sector’s labour productivity and capital intensity have declined between 2000–2001 and 2004–2005. Similarly, Das and Dandapat (2021) have studied the unorganized manufacturing enterprises’ expansion and productivity of the economy for the Indian economy as a whole and also for the state economies. While Kathuria et al. (2010) and Das and Dandapat (2021) have considered the organized and unorganized manufacturing sectors, our present study considers the three-sector disaggregation of the Indian economy for three and half.
Azenui and Rada (2021) monitored the rate of change in labour productivity in 30 low-income countries in Africa between the years 1991 and 2018, and they identified certain industries as major contributors to this rate of change. In addition, they evaluated the strength of the association between a rise in aggregate labour productivity and its sectoral components and a number of factors that are believed to boost economic growth. This evaluation was done in order to determine whether or not there was a correlation between the two. Because of this, they were able to establish whether or not the association holds any significance. According to their findings, there is a weak connection between increasing global trade and either improved productivity within individual sectors or growth-enhancing structural reform in African Least developed countries (LDCs). Both of these factors are important for economic development. The findings of their investigation led them to come to this realization. In contrast to Azenui and Rada’s cross-country panel research, the focus of our study is on analysing the experiences of a particular nation (2021).
This article proposes a methodology for comparing the major sectors of the Indian economy on which considerable disagreement exists among scholars. Chandrasekhar (2007) has concluded that the disparity between the agricultural sector’s pace of expansion and its non-agricultural counterparts has increased significantly after the 1970s and more remarkably after the mid-1990s. The same concern is echoed by Tyagi (2012), Binswanger-Mkhize (2013) and De Roy (2017). These scholars argue for an enhanced emphasis on the primary sector.
On the other hand, many scholars, such as Ansari (1995), Wu (2007), Verma (2010), Eichengreen and Gupta (2011, 2013), Mukherjee (2013), and Latha and Shanmugam (2014), have drawn the conclusion that Indian growth is led by a boost in tertiary-sector productivity. Therefore, a greater emphasis on the services sector is required for that purpose. Ramaswamy and Agrawal (2012) have argued for an emphasis on the secondary sector as they consider it more effective for providing employment for a greater number of people and thereby implementing structural change. Rath (2018) has argued for an emphasis on both secondary and tertiary sectors. Das et al. (2013) have prescribed more emphasis on structural change.
Measuring Structural Transformation
Justification for Our Choice of 1991
As mentioned earlier, we divide the entire period of our empirical study into four sub-periods, the first of which is 1983–1991. There is wide diversity in the choice of subperiods in earlier studies, and there is no consensus 4 on a particular year as a preferred choice. We have taken the year 1991 as the end of the first subperiod since it is widely accepted that the balance of payments crisis of 1991 that marked a watershed moment in economic policies of India, when the government finally gave up on the planning-based economic model it had relied on for decades to the market-oriented economy.
Our choice of the year 1991 is in contrast to Panagariya (2008) and Cortuk and Singh (2011), which have considered the years 1981–1988 as a sub-period. These studies have considered sectoral GDP share as their variable of interest as opposed to labour productivity which is our prime variable. In this article, we use labour productivity and its growth rate, which requires micro-data of labour and value-added available since 1983. We have also performed a statistical structural break analysis and showed (next sub-section) that 1991 was a year of a structural break in the Indian economy.
Statistical Test for the Break Points
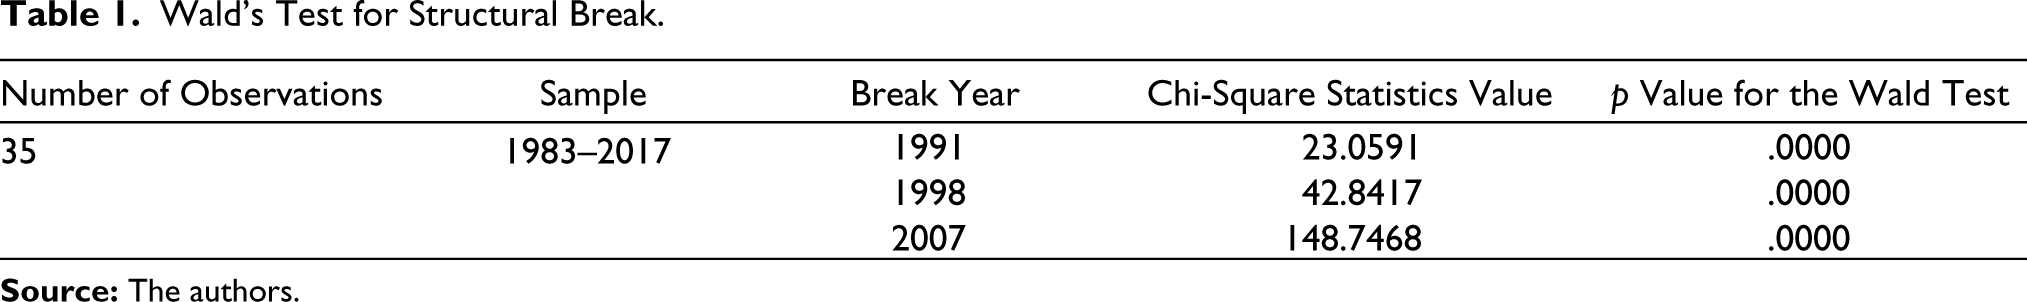
Our break points of 1991, 1998 and 2007 are chosen in alignment with the overall socioeconomic and political environment of the Indian economy. In the interest of statistical verification, we have conducted a structural break analysis on the regression results of aggregate labour productivity on a linear trend. The structural break is indicated by a change in the regression coefficient for the given year. We have performed Wald’s test with the null hypothesis that no structural change happened during the given year (see Table 1). Chi-square statistics with one degree of freedom should characterize the test statistics. All three years, we were able to determine that there was a structural break by rejecting the null hypothesis at the 1% level.
Wald’s Test for Structural Break.
A Demonstration for Structural Transformation.
Construction of the Structure Transformation Index
The labour force transitions from traditional to modern sectors as structural transformation takes place. We require a suitable measure in order to calculate the changes in the economic structure (Gangopadhyay et al., 2020). We follow the earlier literature in decomposing the aggregate labour productivity growth into three major components. The following equation captures the various components:
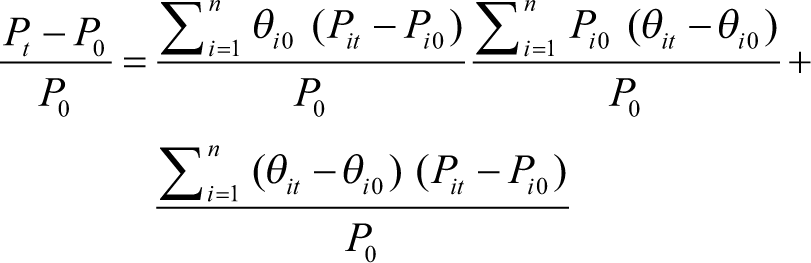
where Pit and refer to the productivity of and the labour share employed in the ith sector at time t, respectively. The initial period is denoted by setting t to 0. Pt denotes the overall productivity of the economy at time t, which is essentially the weighted average of sectoral productivities with weights being sectoral labour shares.
The rate of expansion in total labour productivity is denoted by the variable on the left-hand side of Equation 1. The effect of competition within a sector is represented by the first term on the right-hand side of Equation 1. The term that comes in second is known as the between-sector effect, while the term that comes in third is known as the interaction effect. These last two terms together constitute the measure of ‘structural change’. In essence, we express the measure of the structural transformation, called ‘structural transformation index’ (henceforth, STI), through the following ratio:
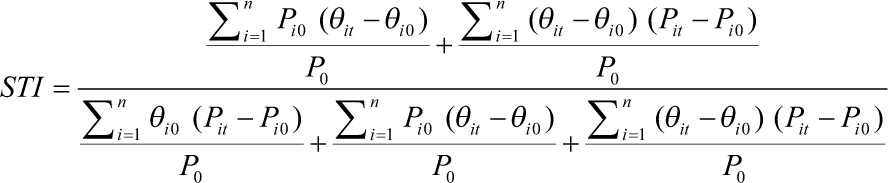
STI may assume any real value as the different components of the aggregate labour productivity growth could be both positive and negative. We motivate the utility of our measure for structural transformation through a toy example, as specified below.
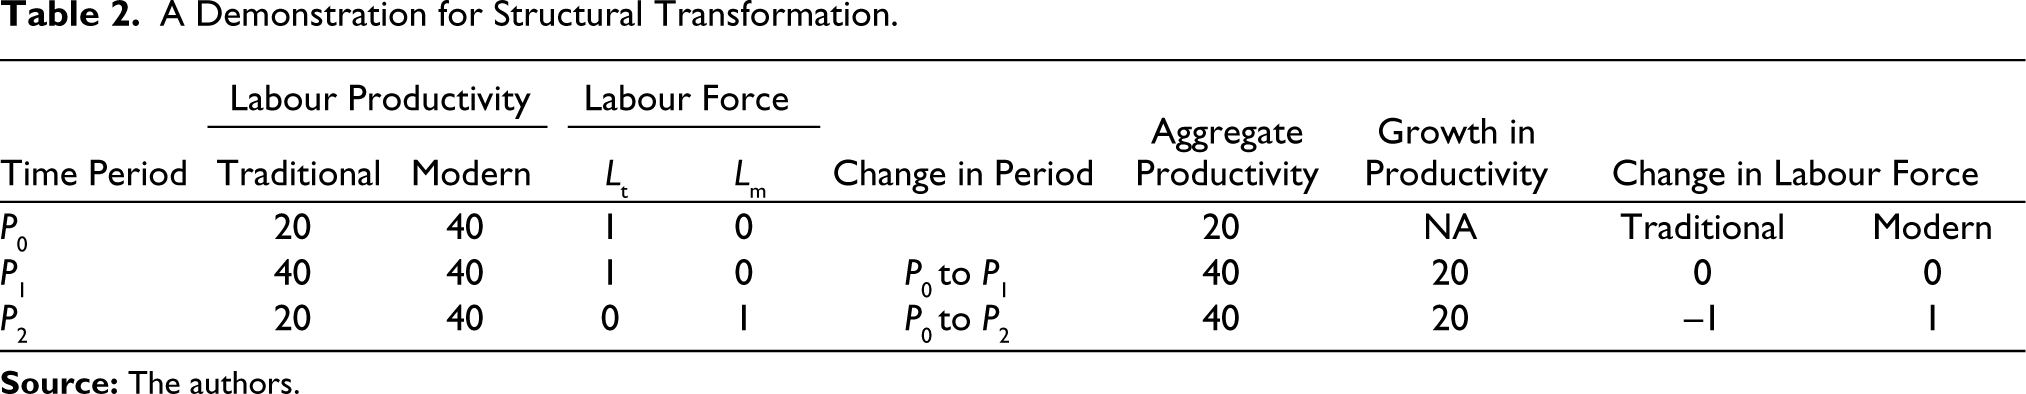
We examine a two-sector economy, labelling the two halves ‘traditional’ and ‘modern’. To begin with, during the period P0, traditional sector productivity was 20, whereas modern sector productivity was 40. There was one worker employed in the traditional economy and none in the modern economy.
During P1, traditional sector productivity rose from 20 to 40, while modern sector productivity stayed stable at 40. The workforce employed in both industries also remained same.
During P2, there was no change in overall productivity between the traditional and modern sectors from P0 levels, but the lone labourer switched jobs, moving to the contemporary sector. Thus, there was no manual labourer hired in the old sector, whereas one was used in the modern sector.
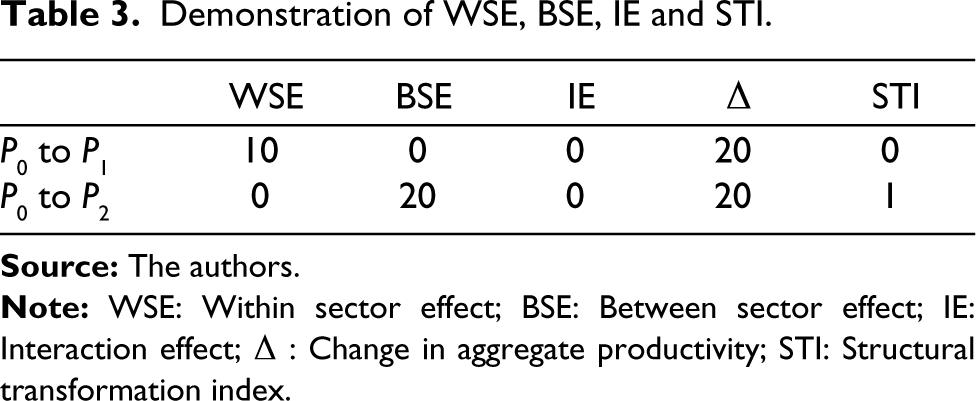
According to Table 3, the growth in total productivity from P0 to P1 is identical to the total productivity figure from P0 to P2. However, throughout the shift of the whole economy from P0 to P1, there is no cross-sector labour mobility. This shift from P0 to P1 is growth-promoting despite requiring minimal structural alteration. In contrast, the transition of the economy from P0 to P2 reveals a transfer of labour force through sectors without an alteration in sectoral productivities. In this instance, economic expansion is fully attributable to structural transformation. The STI (as described in Equation 2) is determined in the table for this fictitious scenario (3). The calculated STI for the transition from P0 to P1 is zero, while the calculated STI for the transition from P0 to P2 is 1. This example (Tables 2 and 3) is certainly simplified in comparison to the actual world. Nonetheless, it is anticipated that the STI will capture the magnitude of structural change in the same manner.
Demonstration of WSE, BSE, IE and STI.
The Empirical Investigation
Construction of the Database
In our three-sector classification, the ‘primary sector’ consists of ‘(a) agriculture and allied activities and (b) mining and quarrying. The “secondary sector” consists of (c) manufacturing, (d) construction and (e) electricity, gas and water supply. Finally, the “tertiary sector” consists of (f) transport storage and communication, (g) trade, hotels and restaurants, (h) finance, insurance, real estate and business services, (i) government services and (j) community, social and personal services’.
We consider the micro-data as collected by various agencies of the Government of India for 1983–2017 to study the sector-wise productivity and its growth. We use the National Accounting Statistics for measuring the output as available in the Economic and Political Weekly Research Foundation India Time Series (EPWRFITS) data source, which provides us with the Net Domestic Product (NDP) data for India as well as outputs for various sectors of the economy spanning the phase 1960–2018. Since our labour force data have been available only since 1983, we take the relevant output data only from 1983 to make a balanced panel.
The labour force data come from the Census and three different surveys of NSSO. These are (a) the employment-unemployment survey conducted by the NSSO exclusively for the purpose of labour force measurement, (b) the periodic labour force participation survey, which is introduced by the NSSO exclusively for labour force measurement in 2017, (c) household consumer expenditure (HCE) survey conducted by the NSSO but to understand HCE pattern and (d) the Census which is decadal and was conducted during 1991, 2001 and 2011.
Our most important variable is labour productivity. On India’s key drivers of labour productivity development, the academic literature is virtually silent. The principal contribution of the current study is the construction of a sector-by-sector measure of labour productivity for the time period under consideration. This is accomplished by computing the sector-by-sector NDP at a constant price (2011–2012) and dividing it by the sector’s labour force at a specific time period.
For multiple reasons, NDP is a better measure of labour productivity. First, the capital compensation allowance associated with compensation to capital as an input of production should not be part of labour productivity. When we deduct capital compensation allowance from GDP, we arrive at the NDP figure. Second, labour income exhibits much smaller fluctuations as shares of NDP as opposed to that of GDP, argues Fisher and Hostland (2002). If the goal of the exercise is to measure the long-run (secular) productivity, we need NDP for that exercise. Many noted researchers, such as Lahiri and Yi (2009), Saito and Settsu (2010), Amirapu and Subramanian (2015), consider NDP instead of GDP as the measure of productivity.
From Table 4, we observe that the labour share in the primary sector has been declining from 68.53% in 1983 to 44.32% in 2017. While both the secondary and tertiary sectors’ labour shares were almost stagnant during 1983–1998, they have increased substantially by the year 2017 compared to 1998. Figure 2 shows the sectoral employment shares during 1983–2017. As evident from Table 4 and Figure 2, sectoral reallocations of labour mostly took place after the year 1998 and, therefore, productivity growth during the pre-1998 era was mostly driven by within-sector productivity improvements as opposed to structural change-related growth.
Sectoral Labour Share (in Percentages).
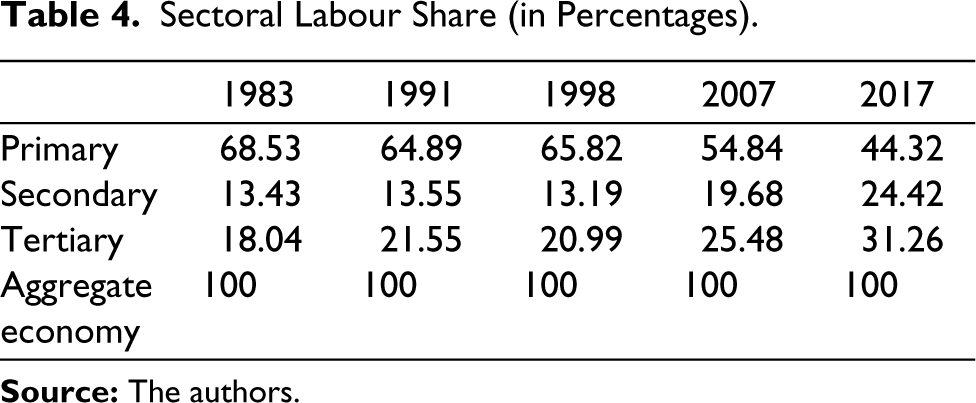
Figure 2 shows the trend of labour movement during the study period. The primary sector has witnessed a 24.21% decline in its labour force. Corresponding changes happened with the labour force of secondary and tertiary sectors. The secondary sector has seen an increase of 10.99%, and the tertiary sector has seen a rise of 13.22% during the study period. However, the primary sector remains the largest employer in the country.
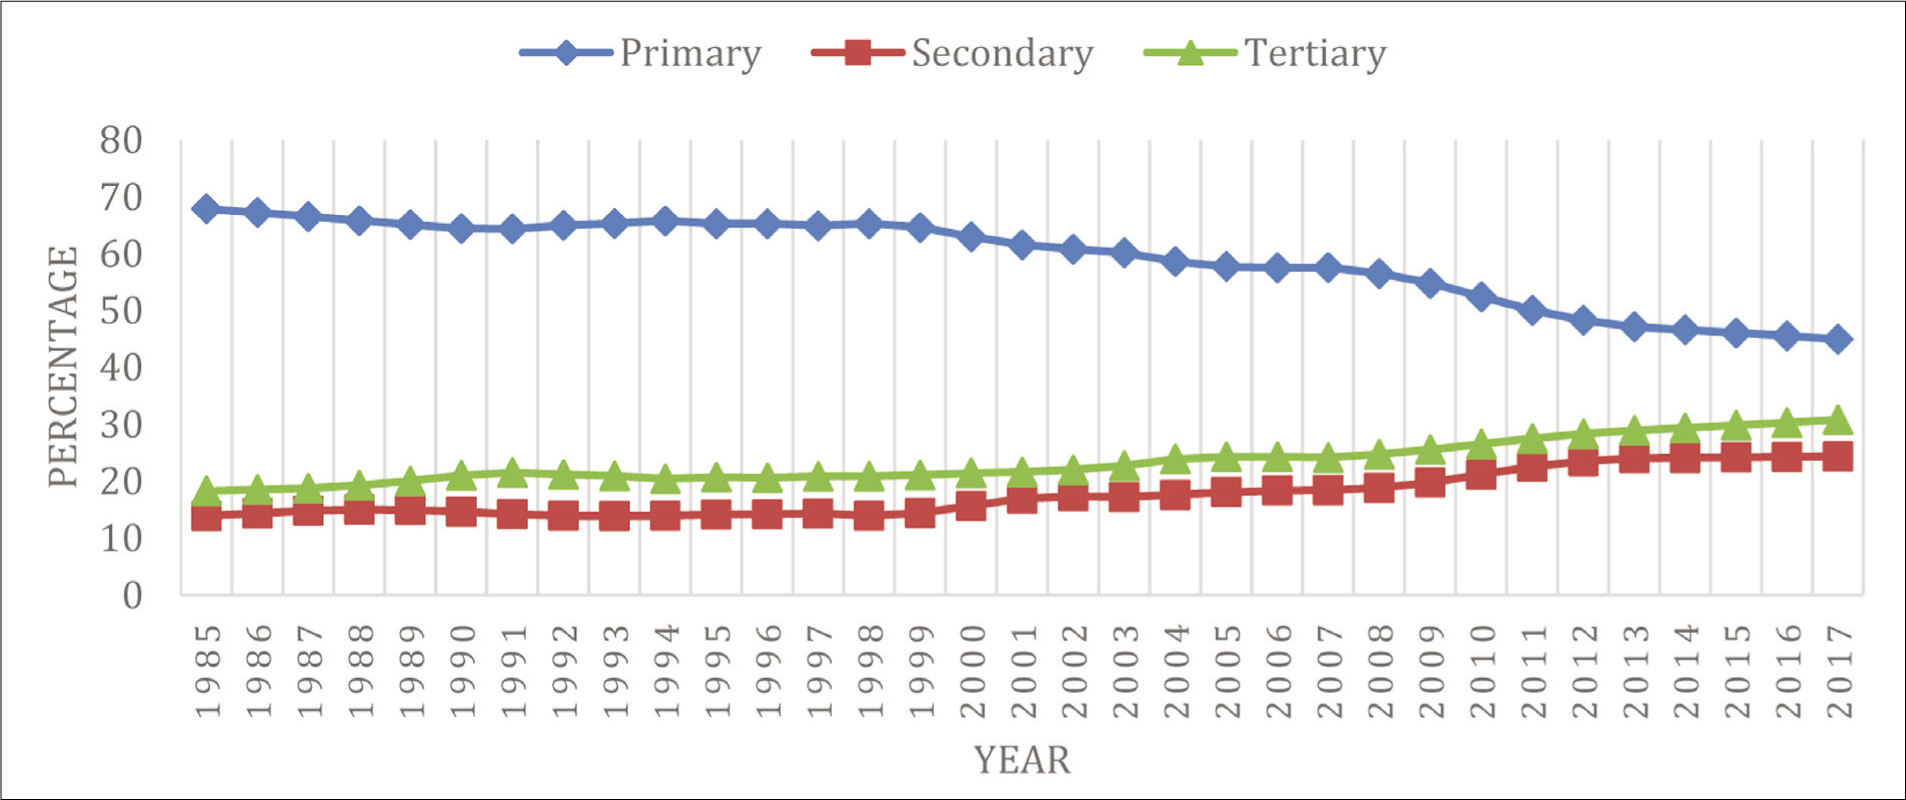
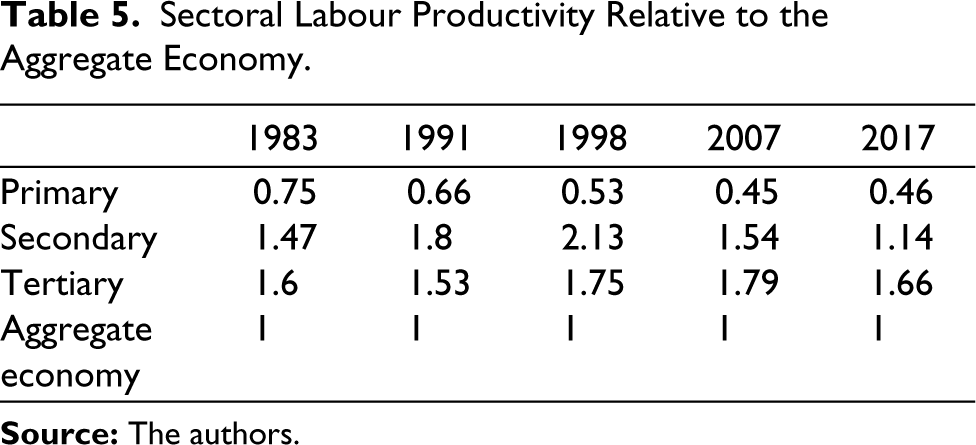
Table 5 shows that the primary sector was 75% as productive as the aggregate economy in 1983, which fell to 46% in 2017. In comparison, the tertiary (secondary) sector’s relative productivity has increased (decreased) from 160% (147%) to 166% (113%) from 1983 to 2017. Understandably, the tertiary sector’s productivity growth rate has been the highest among the three sectors during this period. Tables 4 and 5 imply that workers move away from relatively low to high productive sectors. Next, we quantify this structural change’s share to the total labour productivity growth of the Indian economy.
Sectoral Labour Productivity Relative to the Aggregate Economy.
The Shift-Share Analysis
In Table 6, we present the productivity decomposition using the shift-share analysis at the three-sector level and report the right-hand side values of Equation 1 as computed from the database. For the entire time horizon (Table 6; last column), the average annual productivity growth has been 5.19%, and the structural change contributes about 29% of this growth (which is 1.49% out of 5.19%). The contribution of structural change was the highest during 1998–2007 (approximately 32%), characterized by the golden years of the economic reform period, and it was even negative (at –5% level) during the period 1991–1998. Note that during 1991–1998, the labour share in the primary sector increased marginally at the expense of the secondary and tertiary sectors (see Table 4). Therefore, it was a productivity-reducing structural change from 1991 to 1998.
Decomposition of Annual Labour Productivity Growth Rate (in Percentage) at the Three-Sector Level.
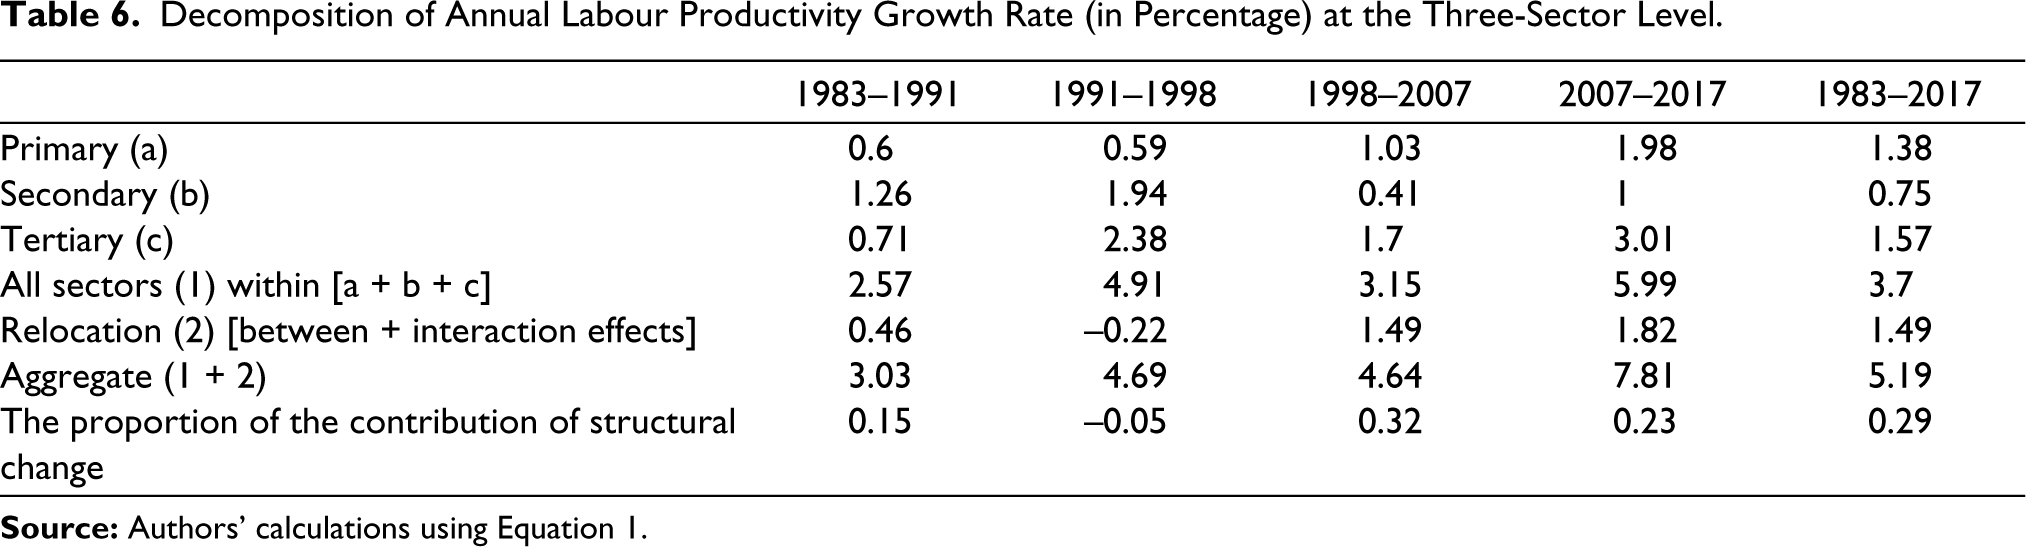
Notice from Table 6 that the bulk of the productivity growth (around 30%) originates within the tertiary sector during the entire time horizon (Table 6, last column). The primary sector is the next major contributor to productivity growth, accounting for about 27% (or 1.38% out of 5.19%), followed by the secondary sector, which contributes around 14% only.
When broken down into its component parts, the yearly labour productivity growth rate at a three-sector level shows that labour productivity has been constantly increasing in the primary sector since 1991. After 1991, the growth rate initially decreased in the secondary and tertiary sectors, but then it began to increase again in the years that followed. On the other hand, the proportion of the labour force that is employed in the primary sector has been progressively declining, while the proportions of those employed in the secondary and tertiary sectors have been constantly increasing. The reduction in the number of people working in the primary sector is not the only factor contributing to the increased productivity in that sector. In fact, we argue that sectoral productivity changes are related not only to the sectoral reallocation of labour but also to within-sector productivity changes.
Policy Implications
Many policy implications of our study exist in the macroeconomic domain and also in the cases of efficient resource allocation. We describe how policymakers and even corporate leaders could reap the benefits of our methodology in these different domains.
One of the long-term problems of the Indian economy is that of distortions of the economy. The distortion of the labour wage and capital rent in different sectors is one of the main economic reasons for differential sectoral growth. As a matter of fact, Hsieh and Klenow (2009) estimate that if capital and labour are suitably and efficiently reallocated, then the manufacturing total factor productivity (TFP) for India may increase by as much as 40%–60%. While the exact extent is yet to be ascertained, distortion definitely lies at the heart of hurting growth for the other sectors. Our methodology can be used to estimate this distortion efficiently. Therefore, our estimation may help policymakers and corporate leaders alike to identify the sectors and sub-sectors in which the levels of misallocation are the highest. The company executives, too, can identify the projects for the company in which the misallocation is suboptimal. Once the suboptimality is identified, efficient future allocation is possible.
A recurring theme in public policy revolves around debating the relative importance of the various sectors given in policymaking all over the world and, in particular, in India. The imbalance between the agricultural and non-agricultural sectors is a common concern for many economists. We have described the different points of view of economists either towards the manufacturing sector or towards the service sector in the second section. While the debate on this relative desirable importance is not new and has varied perspectives, a quantitative framework is still often missing. We argue that a quantitative evaluation of the contribution of the sectors to productivity growth may offer that missing framework. Given that an economy has a target for overall productivity growth, the relative focus on the sectors may be understood by the differential growth prospects calculated from the within-sector, between sectors, and interaction effects.
Some of the examples of policymaking that benefit different sectors unequally include government subsidies towards institutes for research and development of different sector-specific technologies, subsidies directly offered to producers of different sectors, differential freight charges by government-controlled transport companies such as railways, provision of loans to the producers at subsidized rates, priorities offered to different infrastructure projects with varied benefits to various sectors, indirect taxes imposed on materials crucial for different sectors and so on and so forth. We can calculate the optimality regarding varied emphasis on different sectors from our framework.
The other important use of the measurement of contributions for each of the sectors to productivity growth lies in detecting the prospect and problems in different sectors by comparing them to the global scenarios. While every economy has its strengths and weaknesses, a comparison with the global contribution often helps policymakers understand the scope for improvement in different sectors. Moreover, as the policymakers emphasize lowering the unemployment rate for the economy, the contribution of different sectors helps the policymakers plan and develop skills among the youth population for the respective sectors.
The policymakers may even subdivide each of these sectors into many sub-sectors and do the same exercise as we have done. The policymakers could identify the prominent sub-sectors in which productivity growth is actually happening. On identification of those sub-sectors, they may make special efforts to prioritize the problems of production growth for those sub-sectors. The industry leaders, too, may want to invest more to supplement the government efforts. The outcome could be more economic growth at a lower cost since targeted policies are likely more efficient than non-targeted ones. Since a large part of the productivity growth happens because of the tertiary sector, government policies should also focus on the smooth functioning of the tertiary sector. The government should make a plan to keep the research and development work happening in the tertiary sector.
One may treat the companies as the economies and the projects or the different geographies of operation—countries, states, or regions—within the company as sectors within the economy. Now, for the overall growth of a company, the corporate leadership should focus on the key projects and the projects that can change the companies’ prospects dramatically over time. The survival rate of the firms is very low; therefore, one needs to identify proper projects or geographies to focus on for sustainable growth and long-term survival. The portfolio of General Electric has changed a lot over time, but the company has consistently grown over time. Jack Welch, the legendary Chief Executive Officer of General Electric, is considered fundamental to the success of the company. Our prescription may help aspiring corporate leadership identify the area of growth suitably and systematically.
A long-stagnant manufacturing sector is the leading problem of growth. The wage growth is less than desirable on account of the stagnancy in this sector. While the Indian growth story may continue, the speed of change is considered critical for success. Our methodology may measure the speed of change in different sectors and sub-sectors, particularly so for the infrastructure sector. The policymakers have aimed for a $5 trillion economy in 5 years in 2019. The derailment of that plan due to the COVID pandemic by 2 years may still need the economy to achieve it by 2026. If the structural change is slow in the key sectors, such a target may not be achievable. Our methodology may guide the policymakers about the present speed of change and also the required speed of change for achieving the target. We can also evaluate the role of human capital and skill creation in that structural change and plan the necessary levels of investment in different human capital improvement or skill creation activities to attain the target growth rate.
Limitations and Future Research Directions
This article has many limitations. First, we understand that labour productivity is only a partial measure, and a complete TFP measure could be applied. However, we have followed the existing literature (e.g., Bosworth & Collins, 2008; Duarte & Restuccia, 2010; de Vries et al., 2012; Rodrik, 2013) and used average labour productivity as the relevant variable/measure. Though country-wise TFP data are now available in the recent version of the Penn-World Table, we wanted to be in line with the existing literature in this article.
Second, we could not include the unorganized sector in our present study due to a lack of data on that sector. Not only a large number of employees in India were from the manufacturing sector, but a significant part of the manufacturing sector was also from the unorganized sector (Vaidyanathan, 2014). Economists often lack enough data to estimate the productivity in this sector. A future study can gather reliable data on the unorganized sector and correct all the estimates of this study.
Third, we anticipate that the productivity of the service sector has continued to grow after 2017–2018, which is the end of our study. The manufacturing sector, in terms of productivity, remained stagnant till then. However, in recent times, the Government of India has initiated many measures to boost manufacturing sector’s productivity. The Productivity-linked Incentive Scheme (PLI scheme), for instance, is said to provide qualified businesses with a reward of 4%–6% of incremental sales (over the base year) of products made in India and covered under target segments for a period of 5 years following the base year, as defined. The manufacturing sector may have had increased productivity as a result of this.
Fourth, human capital is important to structural change and productivity growth (Mankiw et al., 1992). Our study does not account for the average growth rate of human capital and its impact on productivity growth. Bosworth and Collins (2008) discussed this aspect of structural change in their study over a different time period. A future study may investigate this aspect of structural change and the suitable policy measures associated with boosting human capital.
Fifth, our study could not address the important issue of labour income share and relative earning inequality. Addressing these issues requires data on wages and human and physical capital, which is beyond the scope of our present analysis. This limitation may be addressed by appropriate future research.
Sixth, openness in trade is related to the evolution of productivity in different sectors. It cannot be ruled out that the stagnation of the manufacturing sector has happened as a consequence of the opening up of the economy. Appropriate future research may investigate this idea.
Finally, COVID-related lockdowns have forced countries to be inward-looking and rely less on trade and openness in countries’ economic progress. Hence the role of manufacturing and services—in varying proportions as the former is more tradable compared to the latter—have been severely affected after 2020. This brings in the possibility of reverse structural change where the labourers are increasingly looking for agricultural employment as opposed to non-agricultural. The Government of India has initiated the ‘Vocal for Local’ campaign to boost the self-sufficiency of the Indian economy.
Discussion and Conclusion
The current study is founded on the three-sector decomposition of productivity growth of the Indian economy. We show that around 30% of the labour productivity growth in the economy during 1983–2017 is explained by structural change and sectoral relocation of labour. These sectoral relocations of workers have mostly been unidirectional, where labourers are moving away from primary and into tertiary and secondary sectors. The employment share of the primary sector was reduced to 46% in 2017 compared to 76% in 1983. While this is a very slow pace of shift 5 of employment away from the primary sector, we must note that around 70% of the productivity growth is still originating from within a sector.
As future research potential, one may focus on the role of structural change within a particular sector, especially the tertiary sector. While the broad sectoral level analysis, which is performed in this article, may not identify any important sub-sectors that are critical in its contribution to the sectoral or economy-wide productivity growth; however, the outcomes in the current article are pertinent to the broader understanding of the role of structural shift in the aggregate productivity growth in India.
It is important to bring this up that the contribution of the structural transformation depends upon the level of sectoral disaggregation. But one may not find any monotone pattern regarding the values of the structural change index as we go on for a more detailed break-up of the economy. For example, in de Vries et al. (2012), the contribution of structural change in aggregate growth for India has increased to 47% at the 31-sector level analysis compared to 30% at the three-sectoral level analysis for 1981–1991. However, for Brazil, this is exactly the opposite, where the structural change component explains only 9% at the 35-sector level compared to 50% at the three-sector level for 1995–2008.
Economists often talk about targeted subsidies to facilitate welfare augmentation for marginalized groups. In this article, we suggest that policymakers pursue targeted policies towards making the most promising sectors and sub-sectors even more productive. Some of the sub-sectors at a lower level of aggregation may have local and regional issues that could be solved in the interest of overall productivity growth for the Indian economy.
Footnotes
Declaration of Conflicting Interests
The authors declared no potential conflicts of interest with respect to the research, authorship and/or publication of this article.
Funding
The authors received no financial support for the research, authorship and/or publication of this article.
* Parts of this article are adapted from the thesis work by Thasni T at the Indian Institute of Management Kozhikode.