
Abstract
Objective:
The aim of this study was to describe multimorbidity prevalence in hospitalized adults, by urban–rural area of residence and socioeconomic status (SES).
Methods:
Linked hospital episode data were used. Adults (≥18 years) admitted to hospital as an inpatient during 2014 in Grampian, Scotland, were included. Conditions were identified from admissions during the 5 years prior to the first admission in 2014. Multimorbidity was defined as ≥2 conditions and measured using Tonelli et al. based on International Classification of Diseases-10 coding (preselected list of 30 conditions). We used proportions and 95% confidence intervals (CIs) to summarize the prevalence of multimorbidity by age group, sex, urban–rural category and deprivation. The association between multimorbidity and patient characteristics was assessed using the χ 2 test.
Results:
Forty one thousand five hundred and forty-five patients were included (median age 62, 52.6% female). Overall, 27.4% (95% CI 27.0, 27.8) of patients were multimorbid. Multimorbidity prevalence was 28.8% (95% CI 28.1, 29.5) in large urban versus 22.0% (95% CI 20.9, 23.3) in remote rural areas and 28.7% (95% CI 27.2, 30.3) in the most deprived versus 26.0% (95% CI 25.2, 26.9) in the least deprived areas. This effect was consistent in all age groups, but not statistically significant in the age group 18–29 years. Multimorbidity increased with age but was similar for males and females.
Conclusion:
Given the scarcity of research into the effect of urban–rural area and SES on multimorbidity prevalence among hospitalized patients, these findings should inform future research into new models of care, including the consideration of urban–rural area and SES.
Keywords
Introduction
Multimorbidity, defined as the coexistence of two or more conditions in the same individual, 1,2 is common and increasing. 3–5 Recent policy publications have highlighted multimorbidity as a growing public health concern and a key research priority at the international level. 2,6,7 Multimorbidity places a burden on patients, their caregivers and health systems. 2 As highlighted by the World Health Organization, patients with multimorbidity are at higher risk of safety issues including polypharmacy, complex management regimens and more frequent and complex interactions with healthcare services. 8
The Academy of Medical Sciences recently highlighted that the health systems are largely configured for individual diseases rather than multimorbidity and suggested that this is likely to be a barrier to the provision of integrated care required by patients with multimorbidity. 2 A person-centred approach for people with multimorbidity has been recommended, including developing models of care and designing secondary care around those with multimorbidity. 6,7,9 The National Institute for Health and Care Excellence has also recommended taking account of multimorbidity in tailoring the approach to care. 10
People with multimorbidity have more hospital admissions, stay longer in hospital, are more likely to be readmitted and have a higher risk of mortality than individuals without multimorbidity. 7,11 Patients with multimorbidity may be discharged from hospital with ongoing care needs, which can have an impact on their families and carers. 12 Identifying patients with multimorbidity at the point of admission has the potential for facilitating more informed care, taking account of the management of multiple conditions. Discharge planning ideally starts at the point of admission, 13,14 and consideration of multimorbidity is an important part of this process. 10 With the growing availability of electronic health records, there is now the potential to identify patients with multimorbidity at the point of admission by using information about their prior admission history, thus supporting a tailored, person-centred approach to decision-making and secondary care planning. In the absence of integrated health records in Scotland (including primary and secondary care data), the most readily available source of information at the point of admission is prior hospital admissions.
Socio-demographic factors influence health and well-being. Socioeconomic deprivation is an important determinant of poor health outcomes and lower life expectancy. 15 Rural residency is associated with poor outcomes in several health conditions 16 but also associated with higher life expectancy in Scotland. 17 The social-ecological model views any differences in health and well-being as the outcome of interaction among many factors at different levels – the individual, interpersonal, community, organizational and policy/enabling environment, 18 as has been demonstrated in, for example, cancer outcomes. 19
Multimorbidity is associated with age, socioeconomic status (SES), and there have been reports of urban–rural divides in the prevalence of multimorbidity. 2,20 This evidence, however, comes from primary care and general population studies. Our literature search for studies reporting the prevalence of multimorbidity in hospitalized patients revealed that the majority of studies have been focussed on adults over 65 years and/or patients with high severity of illness or highly selected patients. 21 –30 Studies including unselected younger patients have reported the overall prevalence of multimorbidity, 31–34 but less often in detail by gender or specific age groups, 32,33 and we did not identify any studies investigating the prevalence of multimorbidity by urban–rural area or SES. In Scotland, rurality and SES are taken into account for allocating resources to NHS Boards. 35 It is important therefore to understand and demonstrate the burden of multimorbidity in different socioeconomic and geographical groups, to help ensure these formulas take account of any variances. Our previous study compared two multimorbidity measures for assessing the prevalence and outcomes of multimorbidity. 11 In this study, the aim was to describe the prevalence of multimorbidity by urban–rural area and SES.
Methods
Study design and setting
This study is reported as per REporting of studies Conducted using Observational Routinely-collected Data (RECORD) guidelines. 36 This was a population-based observational study using linked electronic health records carried out in a secondary care setting in a single health region in north-east Scotland (Grampian region, total population 2014, 584,220 37 ). Aberdeen is the largest city in the region with a total population of 113,477. 37 The region is spread over approximately 3000 square miles of city, town, village and rural communities. 38 The population is served by one tertiary hospital in Aberdeen, specialist hospitals (children’s, maternity, mental health, palliative care and care of the elderly), and one district general hospital. There are also several community hospitals where most patients are cared for by their own general practitioners (GPs). The age, sex, socioeconomic and urban–rural distribution of the Grampian population is presented in Table 1.
Characteristics of Grampian population, characteristics of the study population and prevalence of multimorbidity.

CI: confidence interval; SIMD: Scottish Index of Multiple Deprivation.
a Estimated Grampian population (≥18 years) by sex and age group, mid-2014, 37 by Urban Rural Classification 39 and by SIMD. 40
b p Value for χ 2 test for the association between multimorbidity status (<2 or ≥2 conditions) and patient characteristics.
c Three hundred and fourteen patients had missing values for SIMD category and 576 patients had missing values for Urban Rural category.
d Distribution of patients who had no admission in the previous 5 years: SIMD1 7.6%, SIMD2 14.3%, SIMD3 23.0%, SIMD4 27.1%, SIMD5 26.8%; UR1 35.0%, UR2 14.9%, UR3 7.8%, UR4 9.3%, UR5 18.3%, and UR6 12.8%.
Data sources
We used hospital episode data, Scottish Morbidity Record (SMR), 41 from general/acute (SMR01) and psychiatric (SMR04) admissions, from the years 2009 to 2014. SMR is an episode-based patient record relating to all patients discharged from the hospital in Scotland. A record is generated when a patient completes an episode of care (period of time spent under the care of one consultant). These episodes are then linked to form a continuous inpatient stay representing one admission, which may include transfers between consultants, specialties and/or hospitals. SMR data are collated in a national database, managed by Information Services Division Scotland, 42 and data are returned to each regional health authority on an ongoing basis. Data collected include patient identifiable and demographic details, episode management details, general clinical information and death data. Clinical information is recorded as the main diagnosis and up to five other significant diagnoses and coded using the World Health Organization’s International Classification of Diseases (ICD-10). Using hospital episode data reflects the real-world situation at the point of admission. In the absence of integrated patient records, hospital episode data may be the only information available to clinicians when a patient is admitted.
Study population
We included all adult patients (≥18 years) admitted to all hospitals as an inpatient during 2014 (general/acute admissions only), in a single regional health authority (NHS Grampian). A patient’s first admission in 2014 was classified as their ‘index admission’, and the admission date was classified as their ‘index date’. We excluded day case, obstetric and psychiatric admissions when identifying the index admission/study population. The flow diagram for identifying the study population is shown in Figure 1.

Flowchart of study population and data linkage. aCHI number was missing or invalid for 662 inpatient general/acute admissions in 2014 (patients ≥18 years), therefore not included in the study population. SMR: Scottish Morbidity Record; SIMD: Scottish Index of Multiple Deprivation; CHI: Community Health Index.
Multimorbidity
Multimorbidity was defined a priori as ≥2 conditions, 1,10 measured using an unweighted simple count of conditions. Conditions were identified from general/acute (SMR01, including day cases) and psychiatric (SMR04) admissions in the 5 years prior to the index date. All ICD-10 codes recorded as main or other diagnoses (up to five) were included. We used the multimorbidity measure developed by Tonelli et al. 43 This measure was based on the measure developed in the study by Barnett et al. 20 for measuring multimorbidity in a primary care population, using coding unique to primary care in the United Kingdom (Read codes). Tonelli et al. 43 developed a corresponding validated coding scheme for use with administrative data based on the ICD system. The specific ICD-10 codes for the 30 conditions included are detailed in Online Appendix 1. These codes were translated into computerized algorithms and applied to SMR data to identify the conditions of interest. For data quality purposes, a validation data set containing all ICD-10 codes for main and other diagnoses recorded in the 5 years prior to the index date for a random sample of 50 patients were manually checked against the final data set. This showed that the computerized algorithms correctly captured conditions for all patients in the sample.
Urban–rural and SES measures
Urban–rural status was measured using the Scottish Government 6-fold Urban Rural Classification 2009/10.
39
This classification is based on two main criteria – settlement size and drive time to major settlements based on postcodes. The 6-fold Urban Rural Classification categories are as follows: Large urban areas – settlements of ≥125,000 people; Other urban areas – settlements of 10,000–124,999 people; Accessible small towns – settlements of 3000–9999 people, and within a 30 min drive time of a settlement of ≥10,000; Remote small towns – settlements of 3000–9999 people, and with a drive time of over 30 min to a settlement of ≥10,000; Accessible rural – areas with a population of <3000 people, and within a 30 min drive time of a settlement of ≥10,000; Remote rural – areas with a population of <3000 people, and with a drive time of over 30 min to a settlement of ≥10,000.
SES was measured using the Scottish Index of Multiple Deprivation (SIMD) 2012, categorized as quintiles (quintile 1 is the most deprived and quintile 5 the least deprived). 40 SIMD provides a deprivation rank for each of the 6505 data zones in Scotland, based on postcodes. SIMD combines seven domains of deprivation, namely, income, employment, health, education, skills and training, housing, geographic access and crime. The Scottish Government provides an overview of the SIMD methodology. 44 Patients’ SIMD quintile was identified by linking their postcode to the Scottish Government SIMD lookup files.
Other covariates
Other baseline characteristics were sex, age and admission type (routine or emergency). Age was categorized into six age groups.
Data linkage
NHS Grampian SMR data were held in a dedicated secure server, managed by the accredited Grampian Data Safe Haven (DaSH). 45 The Community Health Index (CHI) number, a unique patient identifier used throughout the Scottish healthcare system, was used to link the study population to hospital episode data using deterministic matching. Postcodes were used to link the study population to the Urban Rural Classification and SIMD to identify categories using the Scottish Government’s lookup files. The de-identified data set was prepared and hosted by the Grampian DaSH, 45 allowing secure controlled access for researchers while ensuring data security.
There were 662 admissions with missing CHI numbers in 2014 (inpatient general/acute, ≥18 years), therefore these were not included in our study population. There were 314 patients who could not be linked with SIMD, and 576 patients who could not be linked with Urban Rural Classification, because of postcode issues (Figure 1). The characteristics of patients with missing values are reported in Online Appendix 2.
Statistical analysis
Baseline characteristics were described as frequencies and percentages or as median and interquartile range (IQR). We calculated the prevalence of multimorbidity, and 95% confidence intervals (CIs), as the proportion of patients with ≥2 conditions. Multimorbidity prevalence was reported by age group, sex, admission type, Urban Rural category and SIMD quintile. To assess the association between multimorbidity status (<2 or ≥2 conditions) and patient characteristics, we used the χ 2 test (2 × n tables). Analyses were performed using Stata v13.0.
Ethical approval
The study was approved by the North of Scotland Research Ethics Service (REC B Ref. 16/NI/0088), NHS Grampian Research and Development (Ref. 2016UA006) and NHS Grampian Caldicott Guardian. The DaSH registration number (DaSH 140) provides provenance for all data sets and linkage processes.
Results
Characteristics of study population
Table 1 shows the characteristics of the study population. There were 41,545 patients, with a median age of 62 years (IQR 44–75 years) and 52.6% were female. The majority of patients were admitted as an emergency (69.3%). Just over half of patients were from the two urban categories (52.7%) and the two least deprived quintiles (52.4%). Just over a third (35.5%) of patients had no admission to hospital in the 5 years prior to the index date. The distribution of urban–rural and SIMD categories for patients who had no admission in the previous 5 years was very similar to the overall study population.
Comparing the study (hospitalized) population with the general population (Table 1), there was a higher proportion of patients from deprived areas and a lower proportion of patients from less deprived areas than in the general population. There was a higher proportion of patients from remote areas than in the general population, while the proportion of patients from accessible small towns and accessible rural areas was slightly lower than the general population.
Prevalence of multimorbidity
Of the 30 individual conditions that contributed to the Tonelli measure, the most common conditions recorded were hypertension (19.0%), diabetes (8.4%), chronic kidney disease (8.2%), asthma (6.7%) and atrial fibrillation and flutter (6.1%) (Online Appendix 1). Counts of conditions ranged from 0 to 11 (Table 2).
Number and per cent of patients with different counts of conditions.
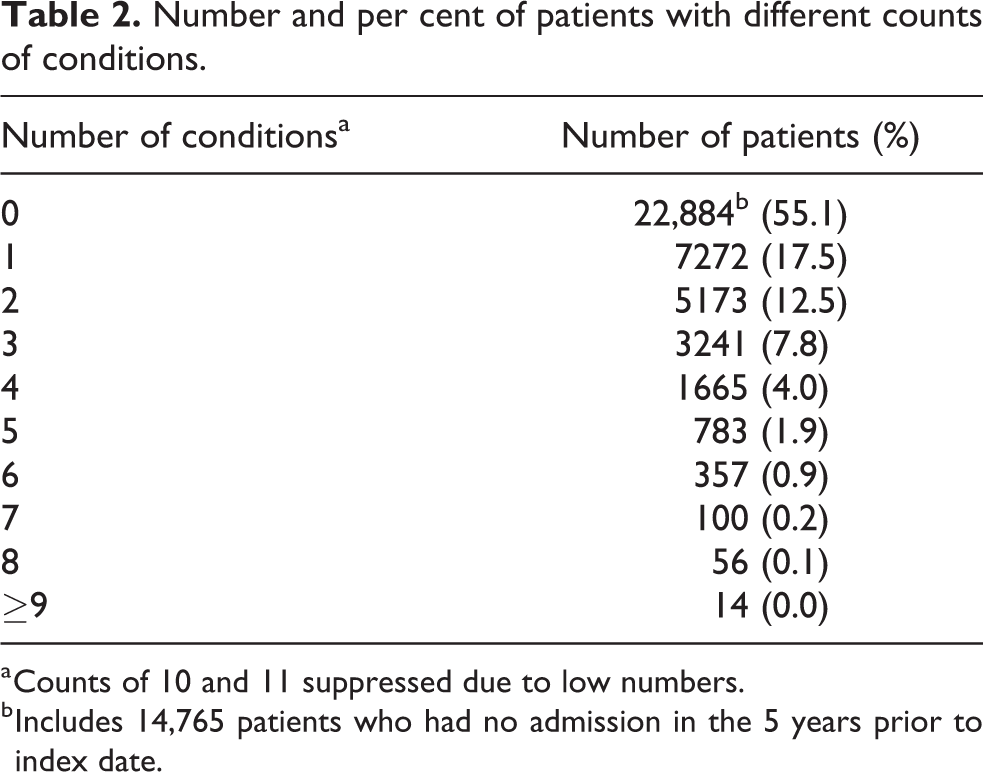
a Counts of 10 and 11 suppressed due to low numbers.
b Includes 14,765 patients who had no admission in the 5 years prior to index date.
Table 1 shows the prevalence of multimorbidity (≥2 conditions) by baseline characteristics. The overall prevalence of multimorbidity was 27.4% (95% CI 27.0, 27.8). There was a significant association between multimorbidity status and urban–rural category. The prevalence of multimorbidity was higher in patients from urban areas compared to rural areas (28.8% (95% CI 28.1, 29.5) in large urban versus 22.0% (95% CI 20.9, 23.3) in remote rural). This effect was consistent in all age groups, but not statistically significant in the age group 18–29 years (Figure 2 and Online Appendix 3).

Prevalence of multimorbidity by age and urban–rural category. *p < 0.05 (χ 2 test for association between multimorbidity status (<2 or ≥2 conditions) and urban–rural category).
There was a significant association between multimorbidity status and SIMD quintile. The prevalence of multimorbidity was higher in patients from more deprived areas compared to less deprived (28.7% (95% CI 27.2, 30.3) in the most deprived quintile versus 26.0% (95% CI 25.2, 26.9) in the least deprived quintile). This effect was consistent in all age groups, but not statistically significant in the age group 18–29 years (Figure 3 and Online Appendix 4).

Prevalence of multimorbidity by age and socioeconomic status. SIMD: Scottish Index of Multiple Deprivation. *p < 0.05 (χ 2 test for association between multimorbidity status (<2 or ≥2 conditions) and SIMD quintiles).
The proportion of patients with multimorbidity increased with age. Figure 4 shows the number of conditions cumulatively by 5-year age bands. By the age of 55–59 years, 22.5% of patients were multimorbid, and by age 65–69 years, approximately one-third of patients were multimorbid. In absolute terms, more people with multimorbidity were 60 years and older (n = 8809, 77.3%) than younger than 60 years (n = 2580, 22.6%). There was no association between multimorbidity status and gender.
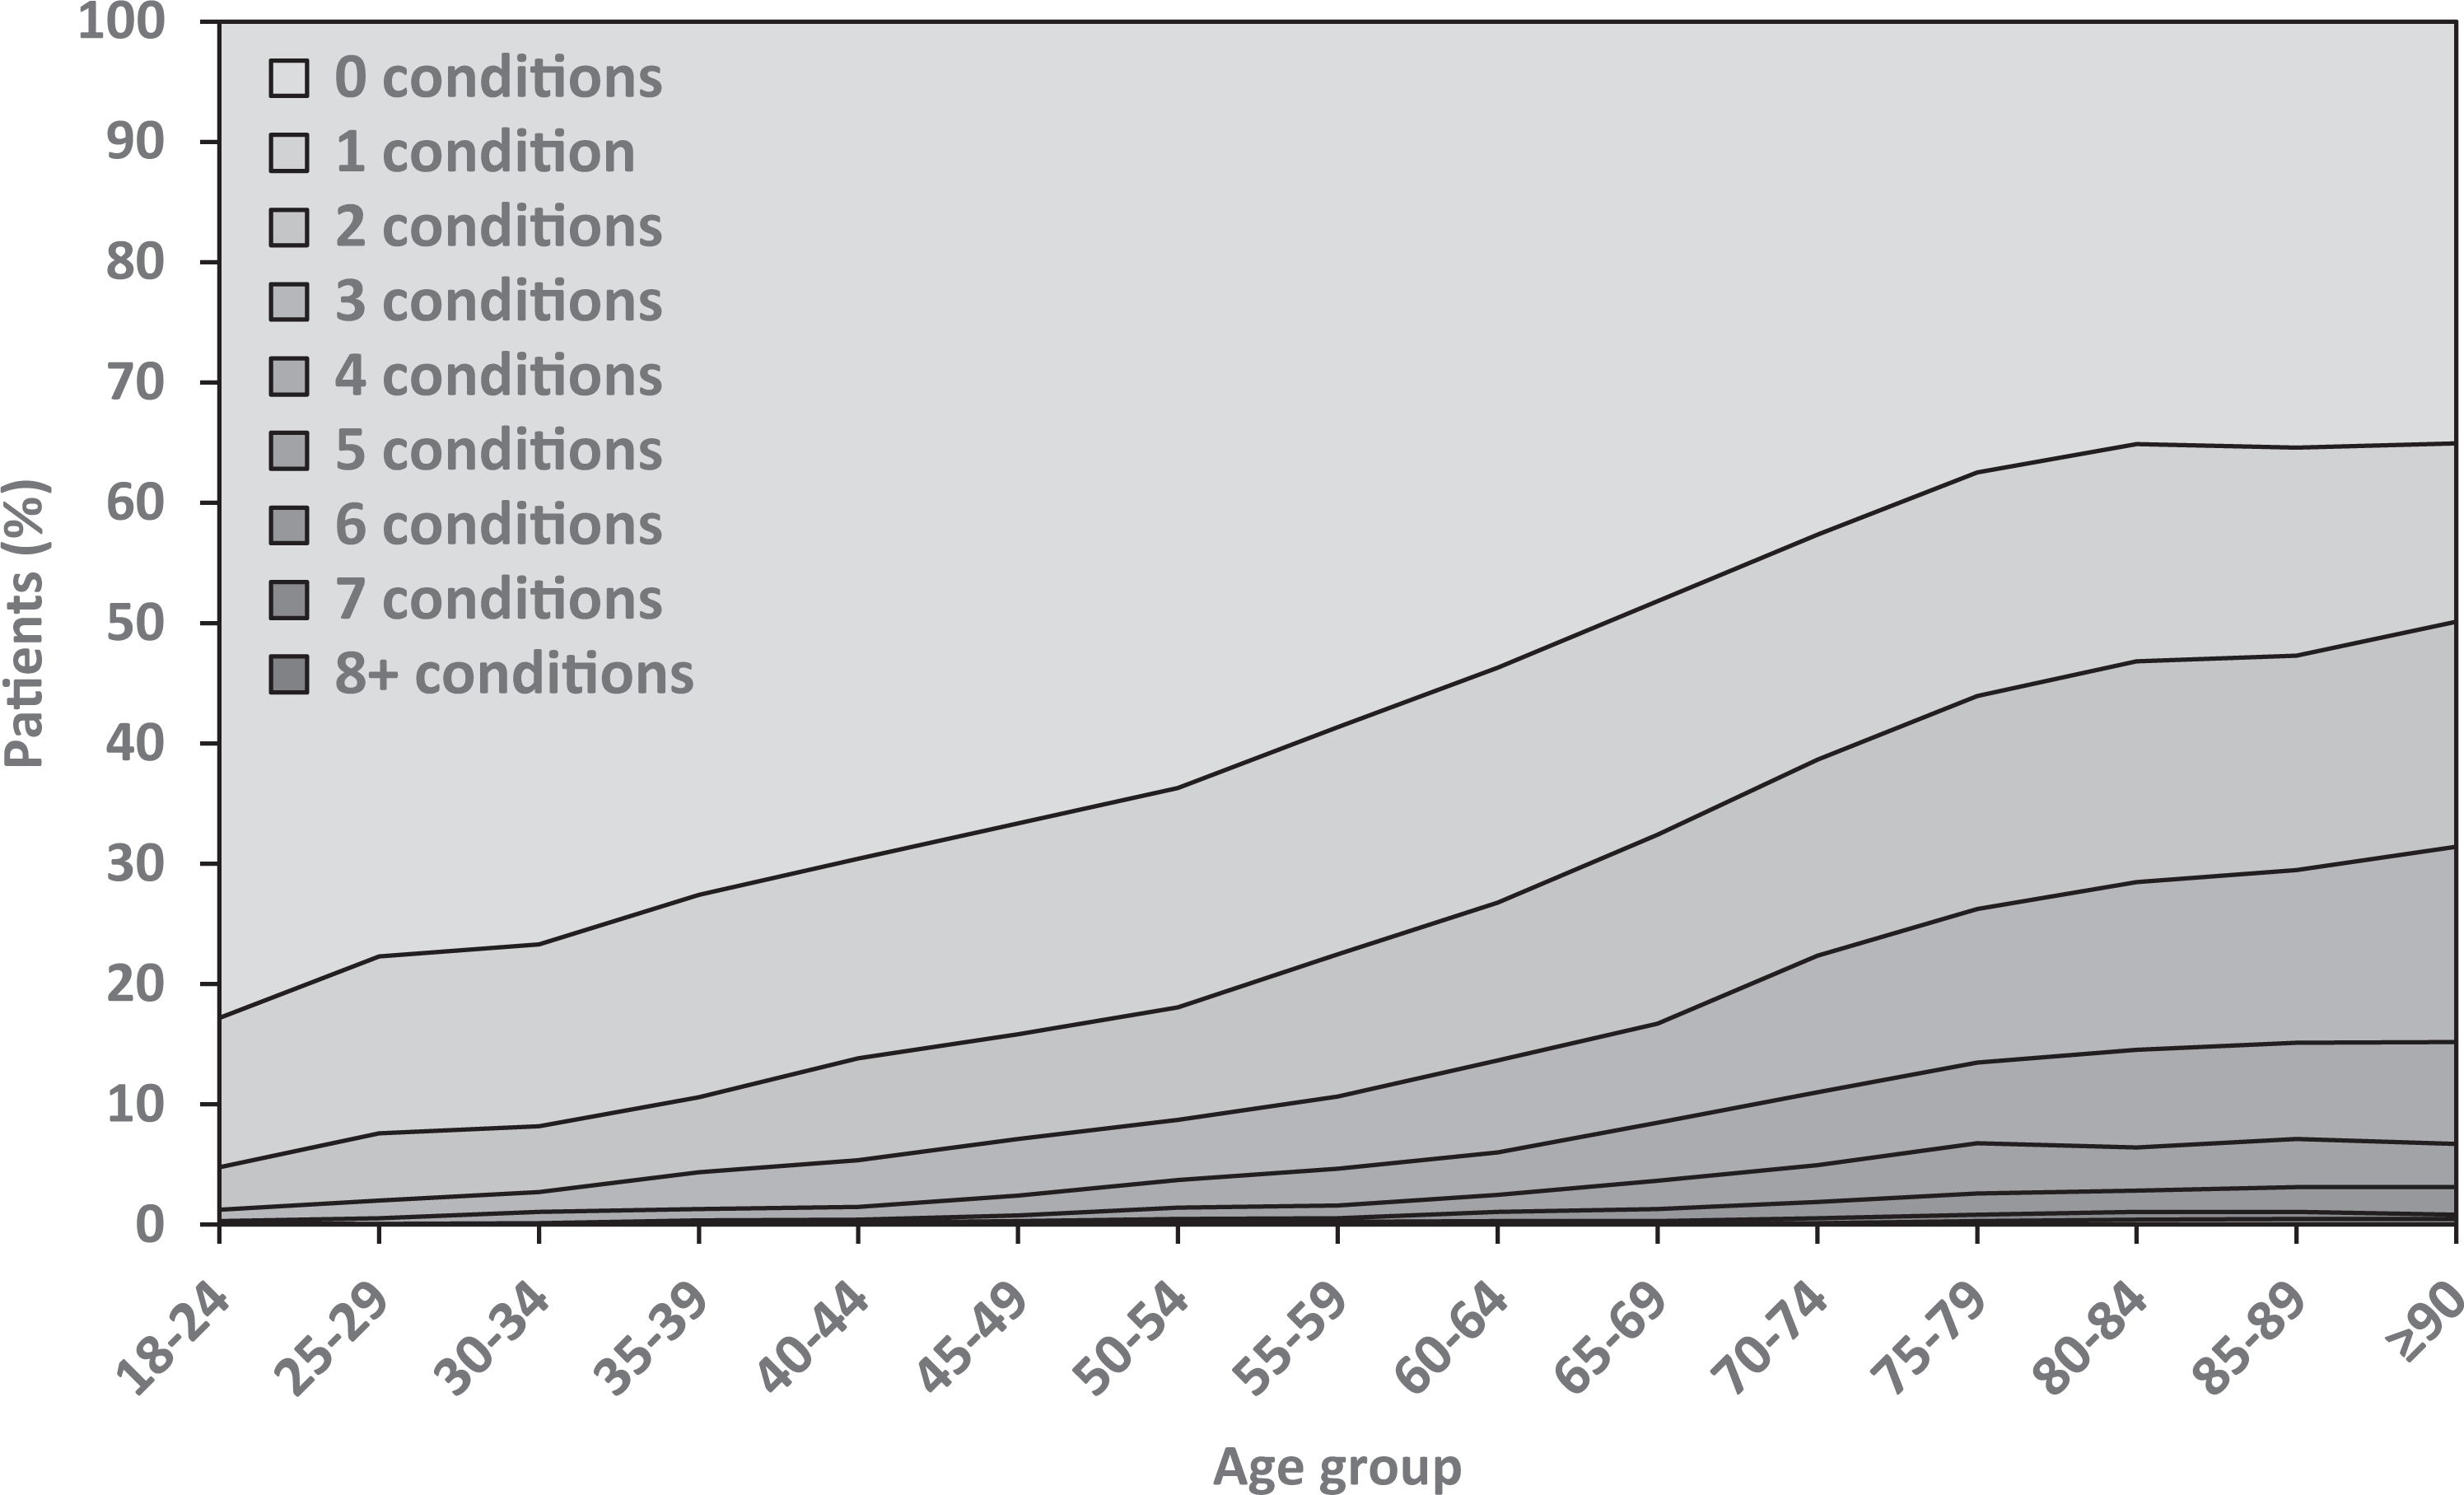
Number of conditions by age group.
Discussion
Main findings
To our knowledge, we are the first to characterize multimorbidity by urban–rural area and SES in a hospitalized population which also included younger adults. We found that multimorbidity was more common among patients from urban areas and those from more deprived areas.
Multimorbidity prevalence was higher in patients from urban areas compared to other areas, in all age groups, although not statistically significant in the youngest age group. Although our search did not identify any studies in hospitalized patients investigating multimorbidity by urban–rural area, primary care and general population studies have reported multimorbidity to be higher in urban areas 46 or similar for urban and rural. 47,48 The effect of urban–rural environments on health is affected by a number of factors which operate together, making the interpretation of our findings complex. The social-ecological model encourages us to consider the complexity of determining mechanisms, both individual and environmental that affect health and well-being. For example, patient-level health-seeking behaviours, healthcare providers’ behaviours and access to services may operate differently in urban and rural areas, as has been demonstrated in cancer outcomes. 19
Interpretation of the urban–rural findings must involve consideration of how multimorbidity was measured. Only those patients who had a previous hospital admission will have conditions recorded. Therefore, there will be some patients classified as not multimorbid, who have multimorbidity, but have been managed in primary care and not previously admitted to hospital. Our population, therefore, represents those whose health conditions were serious enough to require admission to hospital, and this may affect the urban–rural disparity in multimorbidity prevalence.
The finding that multimorbidity was more common in patients from deprived areas has been consistently reported in primary care and general population studies. 2 We found this effect in all age groups, although not statistically significant in the youngest age group. A Scottish primary care study reported similar results, except that they did not find this effect maintained in the oldest age group (≥85 years). 20 This might be explained by the fact that the oldest patients in a hospitalized population are likely to be in poorer health than the oldest patients in a primary care population (which will include healthy survivors). In fact, our oldest age group (≥90 years) showed the widest gap in multimorbidity prevalence between patients from the most and least deprived areas. Factors influencing the association between SES and health are numerous and complex and would include similar factors as mentioned above in relation to urban–rural status.
We found an overall multimorbidity prevalence rate of 27.4%. Previous studies of unselected adult hospitalized patients have reported a range of prevalence rates (24–78%). 31–34 These studies measured multimorbidity in different ways which makes comparison difficult. It has been highlighted that varying approaches to defining and measuring multimorbidity complicate the comparison and synthesis of research findings. 2,49
We found that the prevalence of multimorbidity increased with age, a well-established association. 2,3,33 Nevertheless, there was still multimorbidity present in younger patients. Clinically, there will be greater pressure on secondary care as a result of increasing multimorbidity, and younger patients with multimorbidity will have greater healthcare needs earlier in their lives, will live with multimorbidity for longer and will have the prospect of accumulating more conditions over time.
This was a large, population-based study. We ascertained conditions over the 5 years prior to the index date, as longer lookback periods are more effective for identifying conditions, 50,51 and used validated coding algorithms. We used high-quality administrative data 52 and undertook quality assurance assessments to ensure the accuracy of coding algorithms. The methodology used in our study would be applicable to health systems worldwide that use the ICD-10 coding system. Although our study was limited to a single geographical area, the findings would likely apply to other hospitalized populations with similar characteristics to our study population.
Limitations, however, should be recognized. Conditions were identified from hospital episode data in the 5 years prior to admission in 2014, and 35.5% of our population had no admission in the previous 5 years. Those with no admission, however, were similarly distributed by urban–rural and SIMD category as the study population as a whole. Nonetheless, we will not have recorded conditions for patients who were first-time presenters and will have underestimated the multimorbidity burden in our population, especially for conditions that do not lead to hospitalization or which are not a priority for recording on discharge records. However, as hospital episode data may be the only information available to clinicians when a patient is admitted, we feel that using this methodology is relevant and important to examine. We have not fully adjusted for all confounding factors as our aim was to describe the burden of multimorbidity, rather than identify significant risk factors or adjusted associations. In addition, there are complex interrelationships between multimorbidity, urban–rural and SES measures, for example, SIMD has domains for health and geographical access, and further detailed examination of these complex relationships would be useful in future research. Finally, as there is no universal ‘gold standard’ multimorbidity measure, 1 we used the list of conditions from Tonelli et al. which provided validated ICD-10 coding schemes, acknowledging that there are limitations in the application of ICD-10 codes. For example, a study comparing two multimorbidity measures reported that while 12 conditions were common to both measures, only 3 of these had identical ICD-10 codes. 11 All coding can be affected by variation in coding practices. In Scotland for instance, guidelines are provided regarding the coding of comorbidities, in which a list of comorbidity groups are prioritized as important conditions to record. 53 Nevertheless, ICD-10 is a well-known coding system used worldwide.
The urban–rural disparities in multimorbidity prevalence require further investigation into the mechanisms behind this association. Studies should be carefully and appropriately designed taking account of the complex interrelationships between urban–rural and SES measures, and the potential of electronic health data provides opportunities to do that. Information from primary care, secondary care and social care will be required to fully explain the complexities and highlight avoidable inequalities. The importance of an integrated primary and secondary care patient record is therefore highlighted.
Importantly for healthcare planners and policymakers, the findings of our study support calls for new models of care for patients with multimorbidity and designing secondary care around those with multimorbidity, since we have demonstrated the high burden of multimorbidity in a hospitalized population. 7,54 Any action to improve care and outcomes for people with multimorbidity should not be restricted to services targeting elderly people, 7 and there should be ongoing consideration of the link between multimorbidity and wider social determinants of health.
Conclusions
Given the scarcity of research into the effect of urban–rural area and SES on the prevalence of multimorbidity among hospitalized patients, in particular, including younger patients, these findings should inform future research into new models of care, including the consideration of urban–rural area and SES.
Supplemental material
Supplementary_appendices - Urban–rural and socioeconomic status: Impact on multimorbidity prevalence in hospitalized patients
Supplementary_appendices for Urban–rural and socioeconomic status: Impact on multimorbidity prevalence in hospitalized patients by Lynn Robertson, Dolapo Ayansina, Marjorie Johnston, Angharad Marks and Corri Black in Journal of Comorbidity
Footnotes
Acknowledgements
We thank NHS Grampian who funded this work and provided data. We also thank the Grampian Data Safe Haven, who hosted the data and provided data management support and the linkage service. This work was supported by Health Data Research UK which receives its funding from HDR UK Ltd (HDR-5012) funded by the UK Medical Research Council, Engineering and Physical Sciences Research Council, Economic and Social Research Council, Department of Health and Social Care (England), Chief Scientist Office of the Scottish Government Health and Social Care Directorates, Health and Social Care Research and Development Division (Welsh Government), Public Health Agency (Northern Ireland), British Heart Foundation (BHF) and the Wellcome Trust. We also acknowledge the support of our Study Steering Committee, which included clinical, epidemiological and health intelligence representation.
Data accessibility statement
De-identified data used for this study are held by Grampian Data Safe Haven. These data are available provided the necessary permissions have been obtained. Further information is available at ![]() and requests for data may be made to Professor Corri Black on behalf of Grampian Data Safe Haven,
and requests for data may be made to Professor Corri Black on behalf of Grampian Data Safe Haven,
Declaration of conflicting interests
The author(s) declared no potential conflicts of interest with respect to the research, authorship and/or publication of this article.
Funding
The author(s) disclosed receipt of the following financial support for the research, authorship, and/or publication of this article: This work was funded by NHS Grampian, Public Health Directorate. This work was also supported by Health Data Research UK which receives its funding from HDR UK Ltd (HDR-5012) funded by the UK Medical Research Council, Engineering and Physical Sciences Research Council, Economic and Social Research Council, Department of Health and Social Care (England), Chief Scientist Office of the Scottish Government Health and Social Care Directorates, Health and Social Care Research and Development Division (Welsh Government), Public Health Agency (Northern Ireland), British Heart Foundation (BHF) and the Wellcome Trust.
Supplemental material
Supplemental material for this article is available online.
References
Supplementary Material
Please find the following supplemental material available below.
For Open Access articles published under a Creative Commons License, all supplemental material carries the same license as the article it is associated with.
For non-Open Access articles published, all supplemental material carries a non-exclusive license, and permission requests for re-use of supplemental material or any part of supplemental material shall be sent directly to the copyright owner as specified in the copyright notice associated with the article.