
Abstract
This article systematically reanalyses the long-run effects of democracy on economic prosperity by using new Varieties of Democracy and gross domestic product (GDP) per capita data for a panel data set between 1789 and 2019. Adopting (a) dynamic panel strategies controlling for country and year-fixed effects and (b) newly introduced matching methods for time-series cross-sectional data, the findings clearly indicate that democracy substantively increases economic development. My reanalysis of Acemoglu et al.'s seminal study indicates that in the long-run democracy has a positive average effect on GDP per capita of around 17% for the period between 1789 and 2019. Overall, the findings strengthen the existing literature by using a large sample of countries in the entire 19th and 20th centuries and measuring democracy and liberalization episodes in a more nuanced and rigorous fashion.
Keywords
Introduction
The question of whether democracy causes economic growth and development has been the subject of a vast literature in political science and economics. As Colagrossi et al. (2020: 1) concluded, researchers “adopting a variety of identification strategies, estimation techniques and different samples of countries and periods” came to different conclusions on the relationship between democracy and growth. However, recent literature has developed into a broad consensus that democratization and democracy foster economic growth (e.g. Acemoglu et al., 2019; Colagrossi et al., 2020; Eberhardt, 2022; Gerring et al., 2005; Giavazzi and Tabellini, 2005; Gründler and Krieger, 2022; Krieger, 2022; Madsen et al., 2015; Papaioannou and Siourounis, 2008; Persson and Tabellini, 2007; Rodrik and Wacziarg, 2005).
This article reinvestigates the democracy-economic development nexus by using a global time-series dataset from 1789 to 2019 and 177 countries with newly introduced gross domestic product (GDP) per capita data and more robust democracy measures. It reestimates the impact of democratization on economic growth and development with different identification and estimation strategies. First, this article uses dynamic linear panel models with country-fixed effects and autoregressive dynamics as implemented by Acemoglu et al. (2019), and different treatment variables for measuring democracy and democratization. Second, this article uses difference-in-differences matching methods provided by Imai et al. (2023) to estimate the causal effect of democracy. By using matching methods for time-series cross-sectional (TSCS) data, this article provides additional evidence for the link between democracy and growth and supports the findings from the dynamic linear panel models. The different empirical analyses imply two main findings: First, the empirical results suggest that a transition from autocracy to democracy causes economic growth between 1789 and 2019. Using the dynamic linear panel models by ANRR during the 1789–2019 period, the estimates imply that a transition from autocracy to democracy results in a 17% higher GDP per capita in the next 25 years compared to a country without such a democratization event, which is comparable to ANRR's 20% estimate for the period between 1960 and 2010 (Acemoglu et al., 2019: 48).
Second, my analysis of the effects of democratization episodes (Edgell et al., 2020) that are defined as an increase of 0.1 or more on the Electoral Democracy Index (EDI) demonstrates that neither liberalization in autocracies nor democratic deepening of established democracies is significantly associated with economic development. However, the estimates imply that a democratization episode results in 15% higher GDP per capita but with relatively wide confidence intervals when estimating the dynamic panel data models. The estimates also show that a democratization episode has no developmental advantage when estimating diff-in-diff estimators in the panel data matching design. These results suggest that democratization episodes do not causally explain economic development, while democratic transitions do.
This article contributes to the broader literature on the economic development effect of democracy. Recent literature has made important progress suggesting that democracy has a long-run economic benefit (Acemoglu et al., 2019; Eberhardt, 2022; Madsen et al., 2015). However, while recent literature suggest that democracy causes growth, this study contributes to the literature by testing the relationship with more robust democracy data (Varieties of Democracy (V-Dem)) and newly introduced estimates for GDP per capita (Fariss et al., 2022) and thereby expanding the external robustness of the democracy-economic development nexus. In addition, previous studies can be categorized by two criteria (Eberhardt, 2022): The nature of democracy measure (continuous versus dichotomous) and the identification strategy. However, this paper adds a third criterion that is meaningful to categorize the results from different studies: The robustness and quality of the democracy measure (see also Boese, 2019; Gründler and Krieger, 2022). In particular, newer studies examine the aspects of the construction of democracy measures (definition of democracy, conceptualization, aggregation rules) and how different steps in the creation of democracy measures affect empirical growth (Gründler and Krieger, 2022; Krieger, 2022). In this setting, while democracy seems to cause economic growth in the long-run for the 19th and twentieth centuries, the effects vary across different democracy measures and time periods under study. In addition, this paper adds to the democracy-economic development literature by using a novel approach to measure democratization, and by using an additional identification strategy: Matching methods for TSCS data (Imai et al., 2023).
The remainder of this article is organized as follows: The next section discusses existing studies from political science and economics contextualizing the democracy-economic development nexus. This literature review indicates that democracy may have varying effects on development depending on identification strategies and democracy measures as well as country and period coverage. The ‘Data and methods’ section introduces the data and empirical methodology. The ‘Empirical results’ section presents the main results in six steps. The ‘Discussion and conclusion’ section concludes the article.
Does democracy have a dividend for growth?
Research on the relationship between economic development and democracy has recently made important progress with new studies suggesting that democracy has a long-run economic benefit (e.g. Acemoglu et al., 2019; Madsen et al., 2015). Madsen et al. (2015) show that a one standard deviation improvement in democracy results in a 96% increase in income per capita by using data from 1820 to 2000 and 2SLS regression models along with a continuous democracy measure by Polity IV. Acemoglu et al. (2019) find a 31% increase in income per capita for a permanent democratic transition with 2SLS regressions. They use a binary measure for transitions to democracy by combining data from Freedom House and Polity IV and coding inconclusive cases by hand (Acemoglu et al., 2019: 53–55). In contrast to Madsen et al. (2015), Acemoglu et al.'s sample is restricted to the third wave of democratization and covers 1960–2010. Both studies found a large and statistically significant effect of democracy on growth. However, previous contributions frequently failed to establish such a substantial and significant effect of democracy on economic development (e.g. Barro, 1996; Baum and Lake, 2003; Helliwell, 1994; Minier, 1998; Murtin and Wacziarg, 2014).
According to Eberhardt (2022: ix), studies on the link between democracy and growth can be categorized using two criteria: The nature of the democracy measure (continuous variable or dichotomous variable), and the identification strategy. This study adds a third criterion that is meaningful to further categorize the results from different studies: The robustness of the democracy measure. Eberhardt argues that studies published in the 1990s mainly adopted continuous variables for democracy, such as Freedom House and Polity data with “either simple IV strategies arising from the panel structure […] or even plain least squares” (Eberhardt, 2022: ix). However, robust data for a wide temporal and spatial sample of countries by the V-Dem project and recently published GDP data (Fariss et al., 2022) leads to new opportunities to re-test these “older” studies. To sum up, studies from the 1990s can be recapitulated as showing that there is no relationship between democracy and growth (e.g. Barro, 1996; Helliwell, 1994) or a non-linear relationship (e.g. Barro, 1996; Minier, 1998).
In the 2000s, authors argue that democracy stock (democracy + time) fosters the development of physical, human, social, and political capital, which then has a positive democratic dividend on economic development (Baum and Lake, 2003; Gerring et al., 2005). Giavazzi and Tabellini (2005) implemented a Diff-in-Diff identification strategy with a binary democracy measure (Polity IV) and showed that the findings are overall positive but fragile to the decision of how to measure democracy (permanent transition or not). They were also among the first arguing for a binary democracy approach to democratization. This binary measurement approach of democratization became the default solution in the economics literature thereafter (Acemoglu et al., 2019; Papaioannou and Siourounis, 2008; Persson and Tabellini, 2007; Rodrik and Wacziarg, 2005). Most of the studies in the mid-2000s found a positive and significant relationship between democracy and economic development by using either a Diff-in-Diff design (Giavazzi and Tabellini, 2005; Papaioannou and Siourounis, 2008) or (two-way) fixed effects regressions (Persson and Tabellini, 2007; Rodrik and Wacziarg, 2005). Acemoglu et al. (2019) contribute to the literature by the implementation of several empirical strategies to address common problems in cross-sectional time-series analysis, such as endogeneity, dynamic causal processes, and linearity assumptions.
More recent contributions using continuous democracy indicators implemented causal identification strategies, such as the Arellano and Bond or the Blundell and Bond estimators but came to different conclusions. While Knutsen (2013) found a positive effect of democracy measured by Freedom House on economic growth for a sample of 44 countries between 1972 and 2004, Murtin and Wacziarg (2014) found positive but not significant effects of democracy on economic development for a sample of 69 countries between 1870 (1960) and 2000. As discussed above, Madsen et al. (2015) found a strong positive effect of democracy on development by using IV estimations for a large sample of countries between 1820 and 2000. In a recent study, Gerring et al. (2021) showed a positive link between democracy and human development and found that “the relationship is more likely to be perceived when democracy is measured in a nuanced fashion, taking account of gradations of democracy and autocracy” (Gerring et al., 2021: 308). These authors strongly argued that disparate findings in the research on the link between democracy and human development concern issues of conceptualizing and measurement of democracy, “which are often neglected” (Gerring et al., 2021: 325). This study reiterates this point and re-estimates the findings from Acemoglu et al. (2019) by using more robust measurements of democracy (and GDP per capita).
However, before diving into the empirical details, two meta-regression analyses should be noticed. Doucouliagos and Ulubaşoğlu (2008) applied a meta-regression analysis for 84 studies on democracy and growth with 483 models. The authors concluded that democracy “does not have a direct impact on economic growth” (Doucouliagos and Ulubaşoğlu, 2008: 61) but has indirect effects “through higher human capital, lower inflation, lower political instability, and higher levels of economic freedom” (Doucouliagos and Ulubaşoğlu, 2008: 61).
In contrast, Colagrossi et al. (2020) applied a meta-analysis for 188 studies with 2047 models finding a positive and direct effect of democracy on economic growth. The authors explain their findings arguing that the “growth effect of democracy appears to be stronger in more recent papers not surveyed in Doucouliagos and Ulubaşoğlu (2008).” In addition, the authors show that spatial and temporal differences in the samples lead to inconclusive results in the literature on democracy and growth.
As Eberhardt concluded “both strands adopting dichotomous and continuous measures of democratic change in the most recent iterations have yielded positive, large, and statistically significant causal effects” (Eberhardt, 2022: xi). This article adds to this research by using novel approaches for measuring democratization episodes by the Episodes of Regime Transformation (ERT) dataset (Edgell et al., 2020), and with Regimes of the World (RoW) data (Lührmann et al., 2018). By doing so, this study re-examines the important contribution by Acemoglu et al. (2019) with more robust binary democracy measures from V-Dem for a worldwide sample of countries between 1789 and 2019. In addition, this study triangulates the findings with estimators from matching methods for cross-sectional time series data. By stretching the period back to 1789, this study includes all three democratization waves (see Huntington, 1993) and maximizing case coverage. By doing so, the likelihood that “limited geographic or temporal coverage of a measure” (McMann et al., 2022: 437) introduce bias is reduced. In addition, maximizing case coverage also improves the precision of the estimates, provided the data quality of the democracy data and the GDP data is acceptable. In sum, by including all three waves of democratization and using a robust and reproducible democracy measure, this study adds to the literature by showing that the findings from previous studies are robust to the inclusion of almost all democratization events since 1789.
Data and methods
The assessment of the impact of democracy on economic prosperity requires TSCS data on economic development and political regimes, ideally for a long time period and a large number of countries. Data with such granularity including estimates for measurement uncertainty is only collected by a small number of research data projects. Previous research on the link between economic development and democratization relied on relatively coarse democracy measures, such as Polity IV (Giavazzi and Tabellini, 2005; Madsen et al., 2015; Persson and Tabellini, 2009; Rodrik and Wacziarg, 2005) or a combination of different data sources (Acemoglu et al., 2019; Papaioannou and Siourounis, 2008).
This article relies on data collected by the V-Dem project (Coppedge et al., 2020b) and data from Fariss et al. (2022), which estimates historic GDP per capita estimates by a latent variable modelling framework. The compiled TSCS dataset covers 177 countries from 1789 to 2019 including the first democratization wave in Western Europe and Northern America as well as the global second and third wave. The unit of analysis is the country-year.
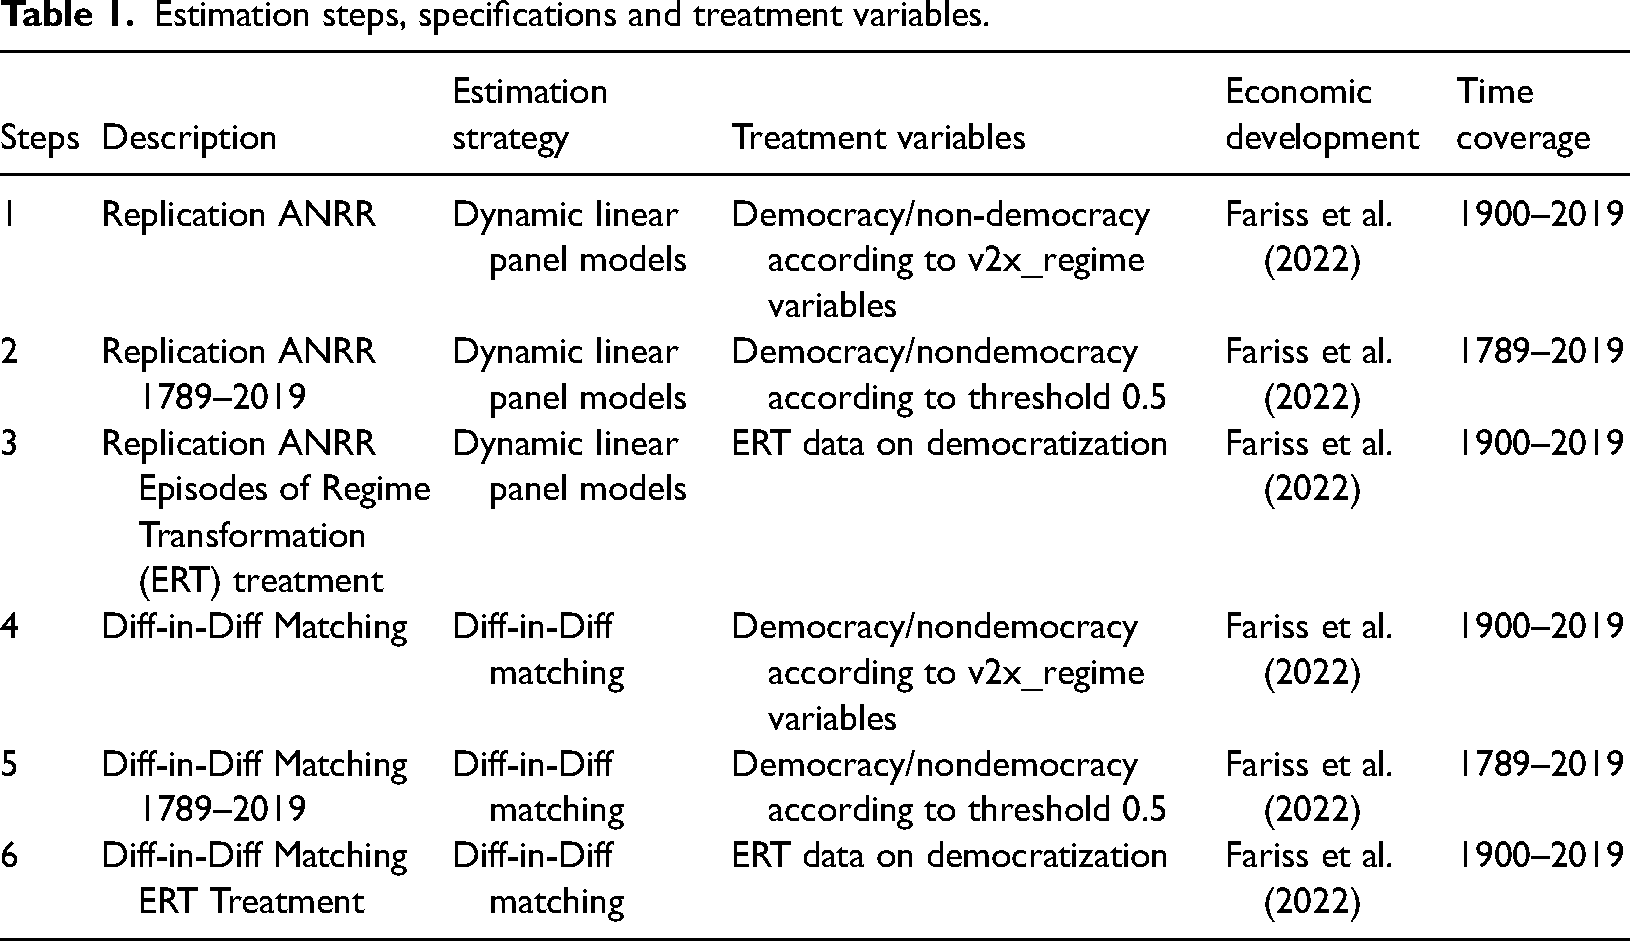
Methodologically, this article relies on two different identification strategies. First, it reestimates the original dynamic linear panel models implemented by Acemoglu et al. (2019) with a dataset covering two centuries and providing more rigorous measures for the dependent and independent variables. Second, it uses a difference-in-differences analytical framework to tackle the problem that countries that democratize may differ from countries that do not have experienced such an event by relying on newly introduced matching methods with TSCS data (Imai et al., 2023). A main advantage of the matching method for TSCS methods over popular two-way fixed effects linear regression models is that it is less vulnerable to model misspecification and identifies a clear set of control observations that share the same short- to medium-term political developments (e.g. Imai et al., 2023). Table 1 provides an overview of different estimation steps, specifications, and treatment variables.
Estimation steps, specifications and treatment variables.
Data on economic development
Economic development is measured by logged real GDP per capita in prices constant across countries and over time (in 2011 international dollars, purchasing power parity (PPP)) from Fariss et al. (2022). This real GDP per capita data comes from the Maddison Project database (Bolt and van Zanden, 2020) and originally ranges from 1500 to 2014. According to Fariss et al. (2022), this GDP data from the Maddison Project is comparable across countries and over time by using the PPP and is the only dataset that combines vast spatial and temporal coverage with cross-country and over-time comparability. Conditional on the empirical models and different estimation steps as shown in Table 1, this article uses the data from 1789 ongoing. 1
Fariss et al. (2022) use a dynamic latent variable (DLV) model estimating posterior predictions for GDP, GDP per capita, and population. By doing so, the authors address three common problems in socioeconomic data: Measurement coverage, measurement uncertainty, and measurement bias (Fariss et al., 2022: 2). By using this DLV model, they provide estimates for economic development and population size for a wide sample of countries and country-years. The DLV model also incorporates measurement error by quantifying the uncertainty of the point estimates. In contrast to the GDP data from the World Development Indicators that were used by ANRR in their seminal study, the Fariss et al. GDP data address potential biases, for example updating their base year data (Jerven, 2013b), and the contribution of sectors over time (Jerven, 2013a).
In this article, I use the point estimates of these posterior predictions for real GDP per capita and benefit from additional information on missing data points originally curated in the original Maddison database. By reducing the non-random missing observations (clustered in country and years) and using the point estimates from the DLV model, this paper minimizes the probability of systematic bias induced by limited geographic or temporal coverage of a measure (sampling bias). 2
Data on democracy and democratization
In contrast to ANRR's approach to measuring democracy, 3 this article relies on state-of-the-art democracy data (see Boese, 2019) provided by the V-Dem project. The main advantage of the V-Dem data is that it takes coder disagreement and measurement uncertainty seriously by using a customized Bayesian item response theory (IRT) measurement model (Pemstein et al., 2020) to aggregate more than 3500 country experts. Democracy is defined as electoral democracy that reflects a bundle of institutions: freedom of association, suffrage, clean elections, elected executive, freedom of expression, and alternative sources of information (see also Coppedge et al., 2020a: 27–42).
However, Gerring et al. (2005: 325) argued that the institutional effects of democracy “unfold over time, sometimes a great deal of time, and that these temporal effects are cumulative.” Thus, democracy is a stock, and democracy and autocracy are “commonly thought to construct deep legacies, extending back several decades, perhaps even centuries” (Gerring et al., 2005: 326). Nevertheless, this article does not use a stock variable to measure democracy for reasons of comparability to the replicated study by ANRR. In addition, this study conceptualizes democracy in terms of Dahl's polyarchy concept defining democracy in a procedural manner. Nevertheless, measuring electoral democracy between 1789 and 2019 remains demanding in terms of conceptual clarity and comparability across countries and over time. Another shortcoming when constructing dichotomous democracy measures is relatively arbitrary thresholds to discriminate between autocracy and democracy (see also Gründler and Krieger, 2022; Munck and Verkuilen, 2002). For a detailed discussion on how to conceptualize (electoral) democracy, see also Coppedge et al. (2011) and Gerring et al. (2005).
As shown in Table 1, this article relies on three different strategies to identify the treatment. All three strategies have in common that they identify non-permanent transitions to (electoral) democracy (and liberalization episodes in autocracies), while previous approaches (Papaioannou and Siourounis, 2008) consider only permanent transitions to democracy. These approaches are at least problematic because the data is necessarily right-censored and future democratic reversals cannot be predicted by researchers.
In the first approach, this article uses a dichotomous measure of democracy in a country c at time t. I use the RoW indicator (Lührmann et al., 2018) to build a dichotomous treatment variable for democracy. Building a dichotomous treatment variable is implemented for reasons of comparability with the original ANRR study, although we have fine-grained data on democracy. To account for short-term liberalization periods that lasted less than a year, this article codes only those countries as democratic that were coded as a democracy by the RoW indicator for more than one consecutive year. This democracy measure covers 177 countries from 1900 to 2019 and is available for all country-years in the V-Dem dataset. It identifies 185 democratization events and 104 breakdowns from democracy to autocracy. This first approach is superior compared to the second approach as it follows clear criteria to identify (electoral) democracies and avoids relatively arbitrary thresholds (for a discussion, see Lührmann et al., 2018).
The second approach to measure democratization events relies on the EDI from the V-Dem dataset (Coppedge et al., 2020b). In contrast to the RoW data, the EDI is available for the entire temporal coverage of the V-Dem dataset. Thus, as shown in Table 1, whenever estimating the democratic dividend for economic development including years before 1900, this article considers democracy as those regimes that have EDI score ≥0.5 on a scale between 0 and 1 for two consecutive years. This binary democracy measure covers 177 countries from 1789 to 2019 and identifies 173 transitions to democracy and 85 democratic breakdowns. Using a relatively low-threshold for identifying democratic country-years is supported by the findings of Kasuya and Mori (2022), which implemented a threshold assessment using dichotomous measures of democracy as benchmarks to dichotomize continuous measures of democracy. However, even when relatively arbitrary thresholds may create empirical problems (Gründler and Krieger, 2022), the baseline measure of democracy is robust compared to the original ANRR democracy measure.
The third approach relies on more fine-grained data for identifying democratization. The data for this treatment variable comes from ERT dataset (Edgell et al., 2020). This third approach takes an episode approach to measure liberalization rather than modelling democratic transitions as a discrete outcome (see also Edgell et al., 2020). Autocracies tend to liberalize gradually (see Figure 1), and therefore the detection of the start and end dates of such liberalization episodes enable scholars to analyse democratization as a two- or multi-stage process of liberalization. Thus, we can differentiate between liberalizing autocracies, which fail to produce a democratic transition by countermeasures against such a liberalization or by introducing autocratic elections that do not meet the democratic standards that are necessary for a democratic transition (stabilizing electoral autocracy). Second, an autocracy can transition to democracy, while third, a democracy can also liberalize further. By using this conceptualization of democratization, this article can detect those gradual increases in the level of democracy that lead to substantial liberalizations that should affect economic development, also when the liberalization does not result in a democratic transition.
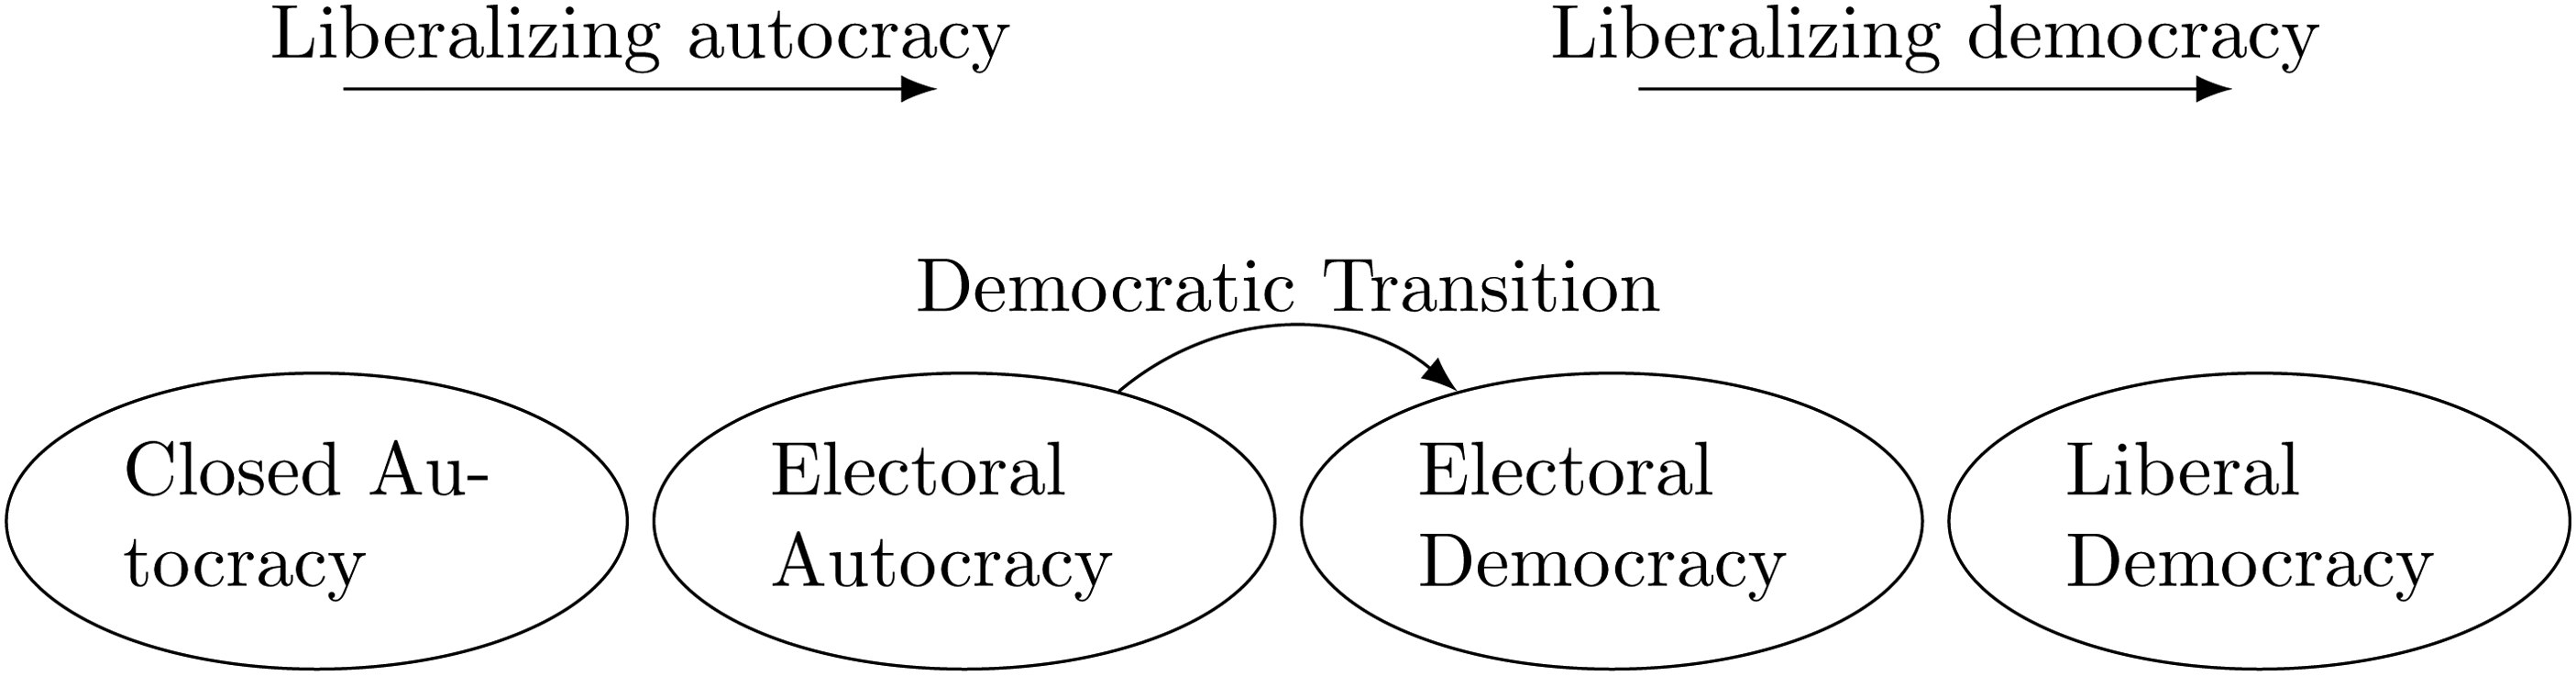
Conceptualizing democratization episodes.
According to the ERT dataset, this article defines a liberalization period as an increase of 0.1 or more on the EDI (Edgell et al., 2020). The EDI ranges on a continuous scale between 0 and 1. In contrast to the default start threshold implemented by the ERT dataset, 4 this article defines that a liberalization episode starts with an increase in the EDI of 0.05 points or more. A liberalization period has ended, when there is temporary stagnation in the EDI with no further increase of 0.05 points in five consecutive years, the EDI increases by 0.03 or greater in a given year, and the EDI gradually decreases by 0.1 over a 5-year period (Edgell et al., 2020). Thus, this study relies on the most reliable conceptualization of regime transformation with the best available fine-grained data on democracy (cf. Pelke and Croissant, 2021; Wilson et al., 2022). Between 1900 and 2019, the dataset includes 348 episodes of liberalization occurring in 158 countries.
Figure 2 compares all three approaches for measuring democratization empirically by illustrating the development of democracy in Turkey and Venezuela. It shows that Turkey had four liberalization episodes according to the ERT dataset, and two of them were liberalization episodes in autocracies, two of them led to a democratic transition. The dichotomous measure of democratization counts two transitions to democracy. For Venezuela, Figure 2 shows that two liberalization episodes can be observed. The first one was a liberalization period in the Venezuelan autocracy, and the second one led to a democratic transition. The binary measure of democratization lists the transition in 1963 as the first and only one.
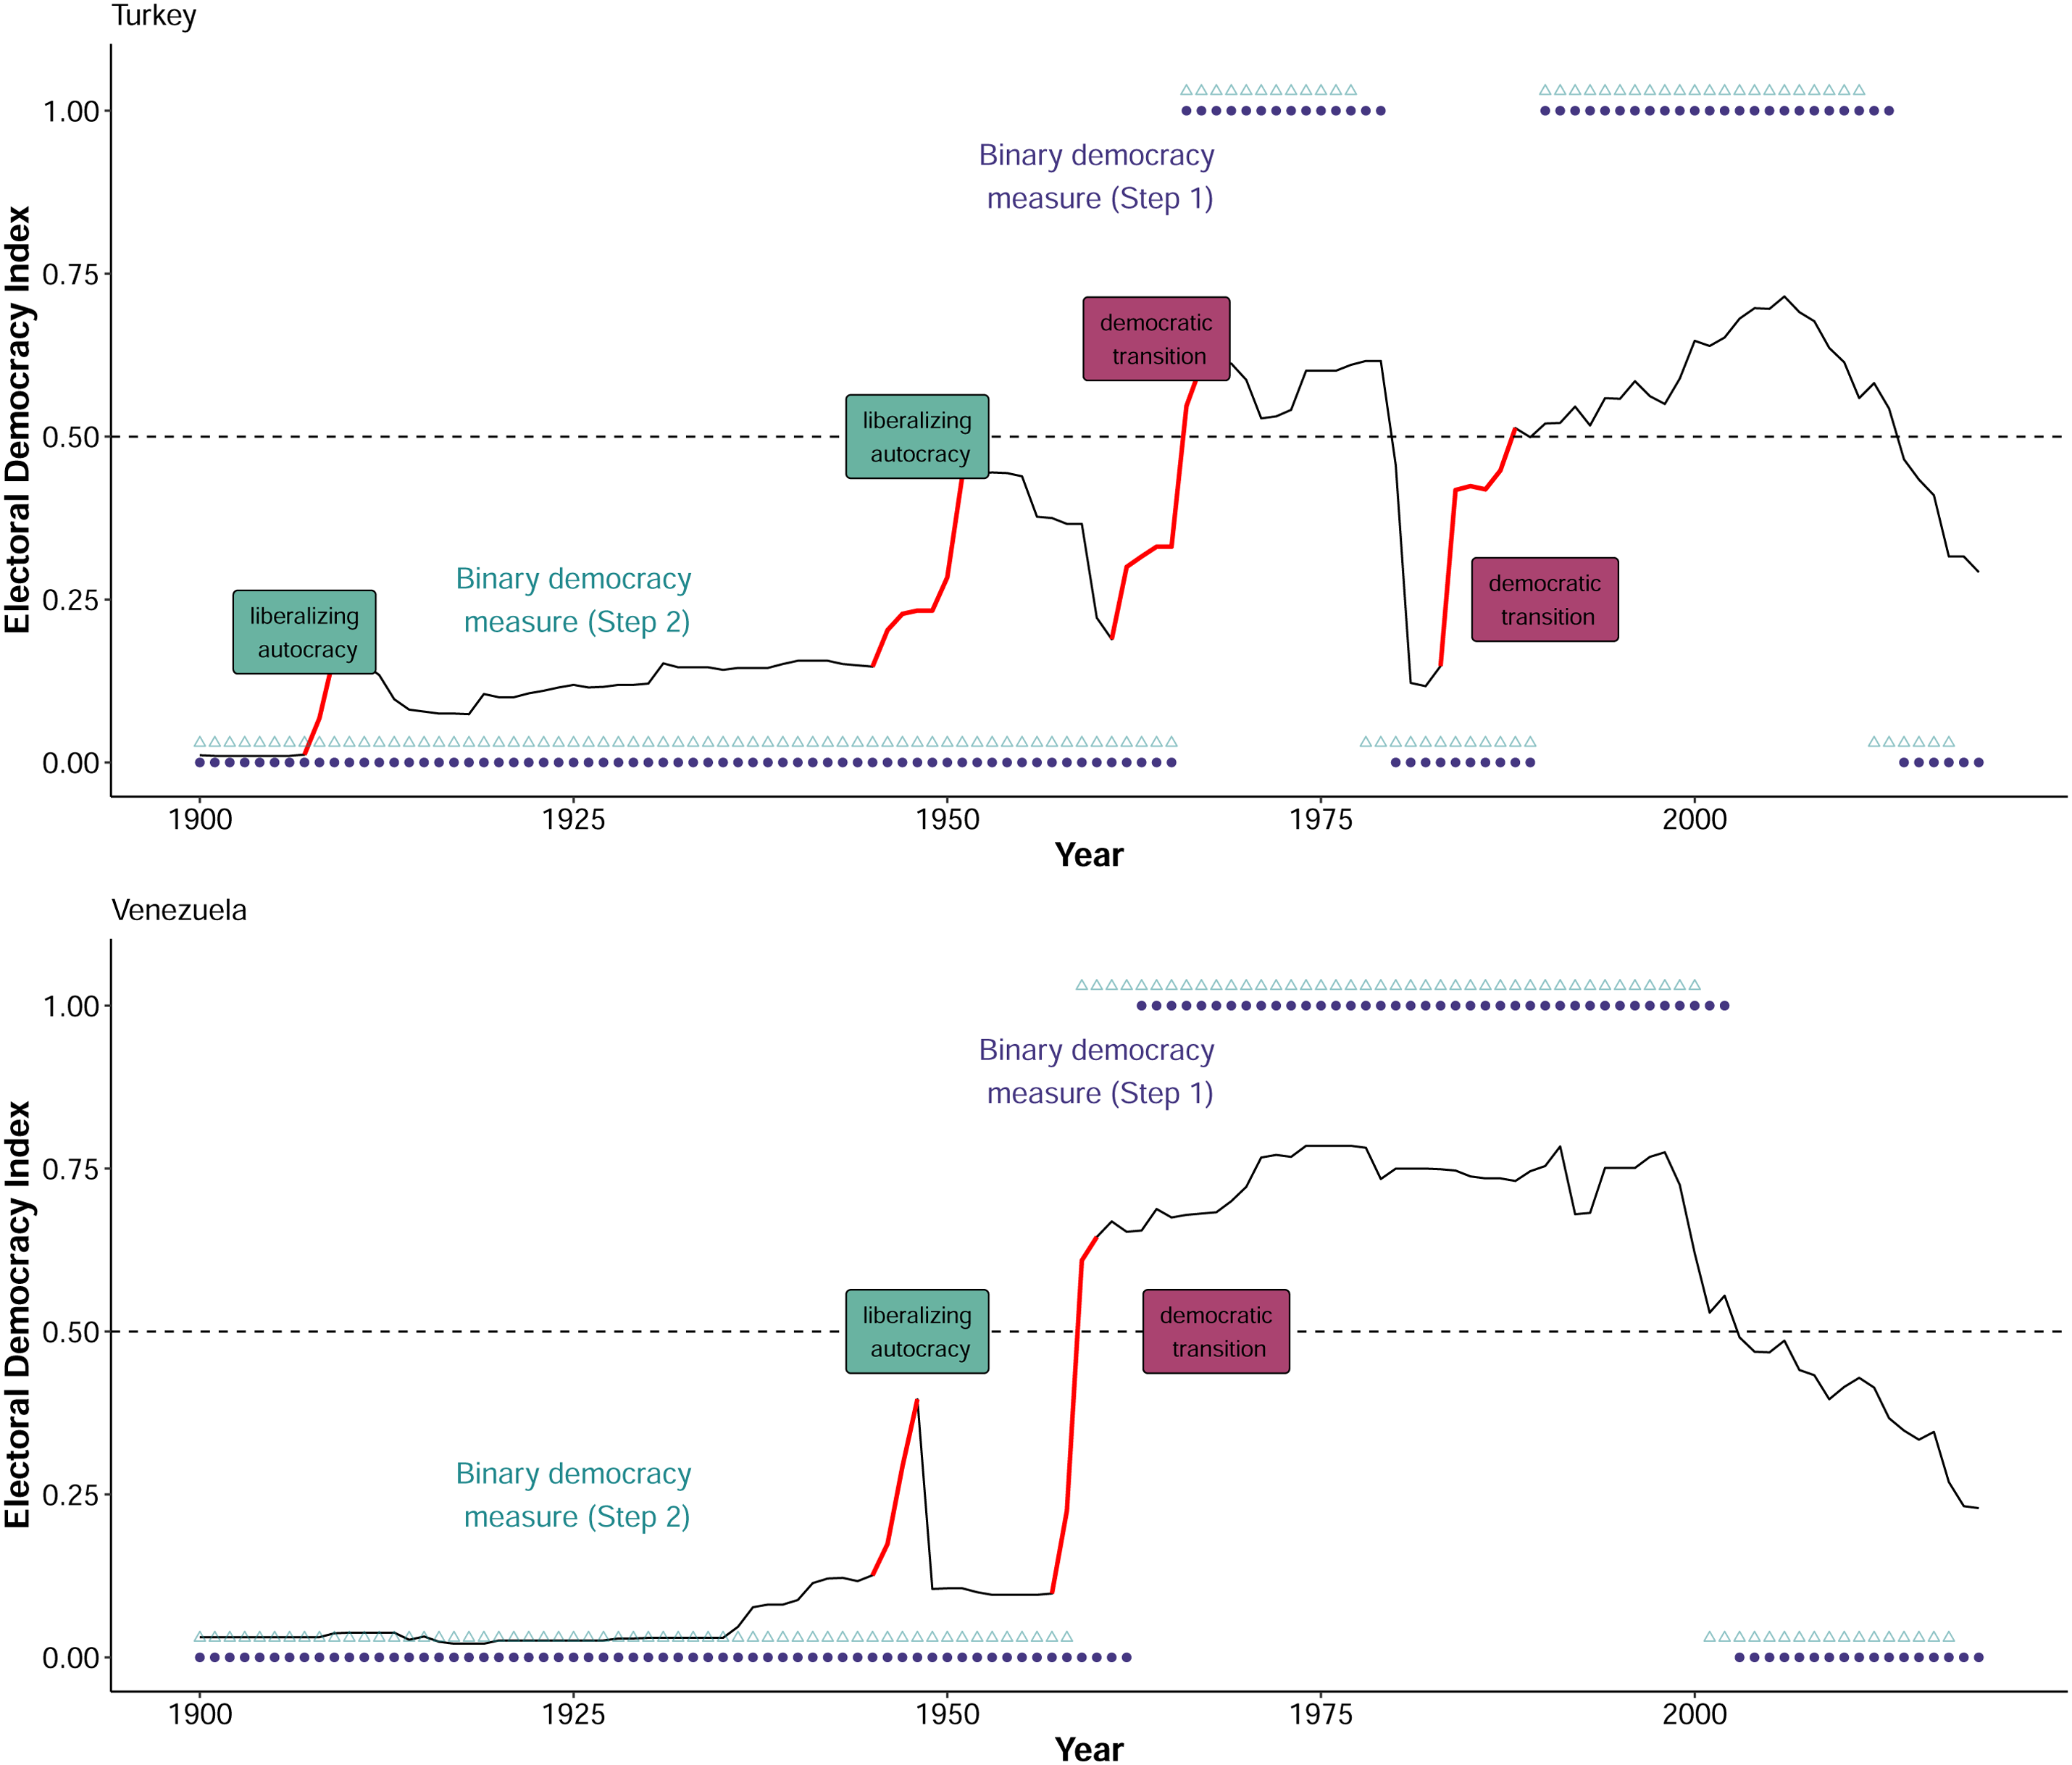
Illustrating the democratization (episodes) operationalization for Turkey and Venezuela. Democratization episodes by Episodes of Regime Transformation (ERT) coloured in red lines. Points and rectangles refer to the dichotomous democracy measures.
In addition, Table A1 in the Supplemental Appendix shows the countries in the study with their first year of democracy. Table A1 reveals that before 1900 only four countries were classified as an electoral democracy: Switzerland in 1849, Australia in 1856, New Zealand in 1868, and France in 1876. For example, the United States of America was classified as an electoral democracy first in 1921 according to the second proposed binary measure of democracy, while the United Kingdom was first an electoral democracy in 1919.
Data on time-varying covariates
In different specifications, this study uses additional time-varying covariates, for example for the matching procedure in Steps 4–6. These controls may affect both the outcome and treatment. The additional variables used for both estimation strategies include the EDI, bureaucratic quality, state authority over territory, population size, and five-year averages of GDP per capita growth.
The EDI as a time-varying covariate (Coppedge et al., 2020c) controls for the initial level of democracy in countries that (do not) face democratization. Second, this study controls for the bureaucratic quality of countries (cf. Andersen and Doucette, 2022) using “rigorous and impartial public administration” variable from V-Dem (Coppedge et al., 2020c: 162). Third, the models control for “state capacity” by using the “state authority over territory” variable from V-Dem (Andersen and Doucette, 2022; Coppedge et al., 2020c: 175). It measures the percentage of the territory over which the state has effective control. Fourth, the models control for the size of the population by using the logarithms population size from Fariss et al. (2022). Finally, this study controls for the five-year average of GDP per capita growth prior to democratization. Annual GDP per capita growth is constructed from posterior predictions from Fariss et al.'s (2022) data. These additional covariates were used in light of available data, while other socio-economic controls are likely to affect the economic dividend of democracy, such as prior stocks of human capital (Gerring et al., 2021).
Empirical strategy
In this section, I introduce the two empirical strategies this article employs to study the impact of democratization on economic development. The first empirical approach is directly motivated by ANRR's dynamic (linear) panel data regression model (Acemoglu et al., 2019). These dynamic linear panel regression estimators are implemented in Steps 1–3 of the empirical analysis. The second empirical approach employs a difference-in-differences design for TSCS data by Imai et al. (2023). The implementation of this Diff-in-Diff design takes into account that recent literature has serious concerns regarding the implementation of two-way fixed effects estimators as a Diff-in-Diff framework when the treatment effects are likely to be heterogeneous, selection into treatment is likely to be endogenous, and non-parallel treatment effects (see Athey and Imbens, 2018; De Chaisemartin and D’Haultfœuille, 2020; Imai et al., 2023). These Diff-in-Diff matching estimators are implemented in Steps 4–6 of the empirical analysis (see Table 1).
According to ANRR, the dynamic model estimating GDP per capita is: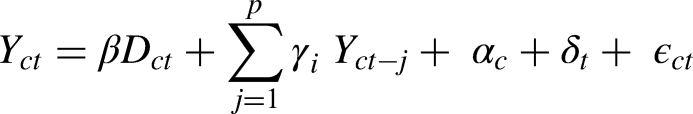
In addition, to account for potential Nickell bias in my models, System GMM estimators are reported. However, as mentioned by ANRR (Acemoglu et al., 2019: 62), when T is large the Nickell bias should be small. In my sample, countries have 83 country-year observations on average.
The second empirical approach implemented in Steps 4–6 adds to the empirical evidence from Steps 1–3 by testing the effect of democratization measured analogous to Steps 1–3 on economic development by using Imai et al.'s (2023) matching methods for TSCS data. In compliance with the ANRR approach, it uses four lags of GDP per capita and time-varying confounders as specified above. The models in Steps 4–6 calculate the average effect of democratization for the treated case, as defined:


Empirical results
While recent literature often tests the democracy-economic development nexus using either one preferred empirical specification (two-way fixed effects estimators) or either one empirical measure of democratization, this article relies on another study design:
Steps 1–3 present a series of two-way fixed effects estimators relying on the two presented estimators of ANRR (within estimators, Arellano and Bond System GMM estimators). Step 1 replicates the results of ANRR with an IRT-based measure of democracy and a country sample from 1900 to 2019. Step 2 enlarges this sample further to 1789–2019 but thereby using a less robust measure of democracy as presented above. Step 3 uses the conventional sample from 1900 to 2019 and tests the effects of liberalization episodes.
Steps 4–6 present a series of Diff-in-Diff estimators calculating average treatment effects of democracy on economic development. As presented above, these Diff-in-Diff models are based on matching methods that are likely to reduce model dependence. The country-year samples and treatment variables are defined in Steps 1–3.
Democracy and economic development re-estimated, 1900–2019
In this section, I provide the baseline regression results using the same dynamic linear panel data model for GDP per capita as ANRR in their article (Acemoglu et al., 2019). However, as shown in Table 1, the main differences are the democracy data as well as the temporal scope of these regressions: 1900–2019.
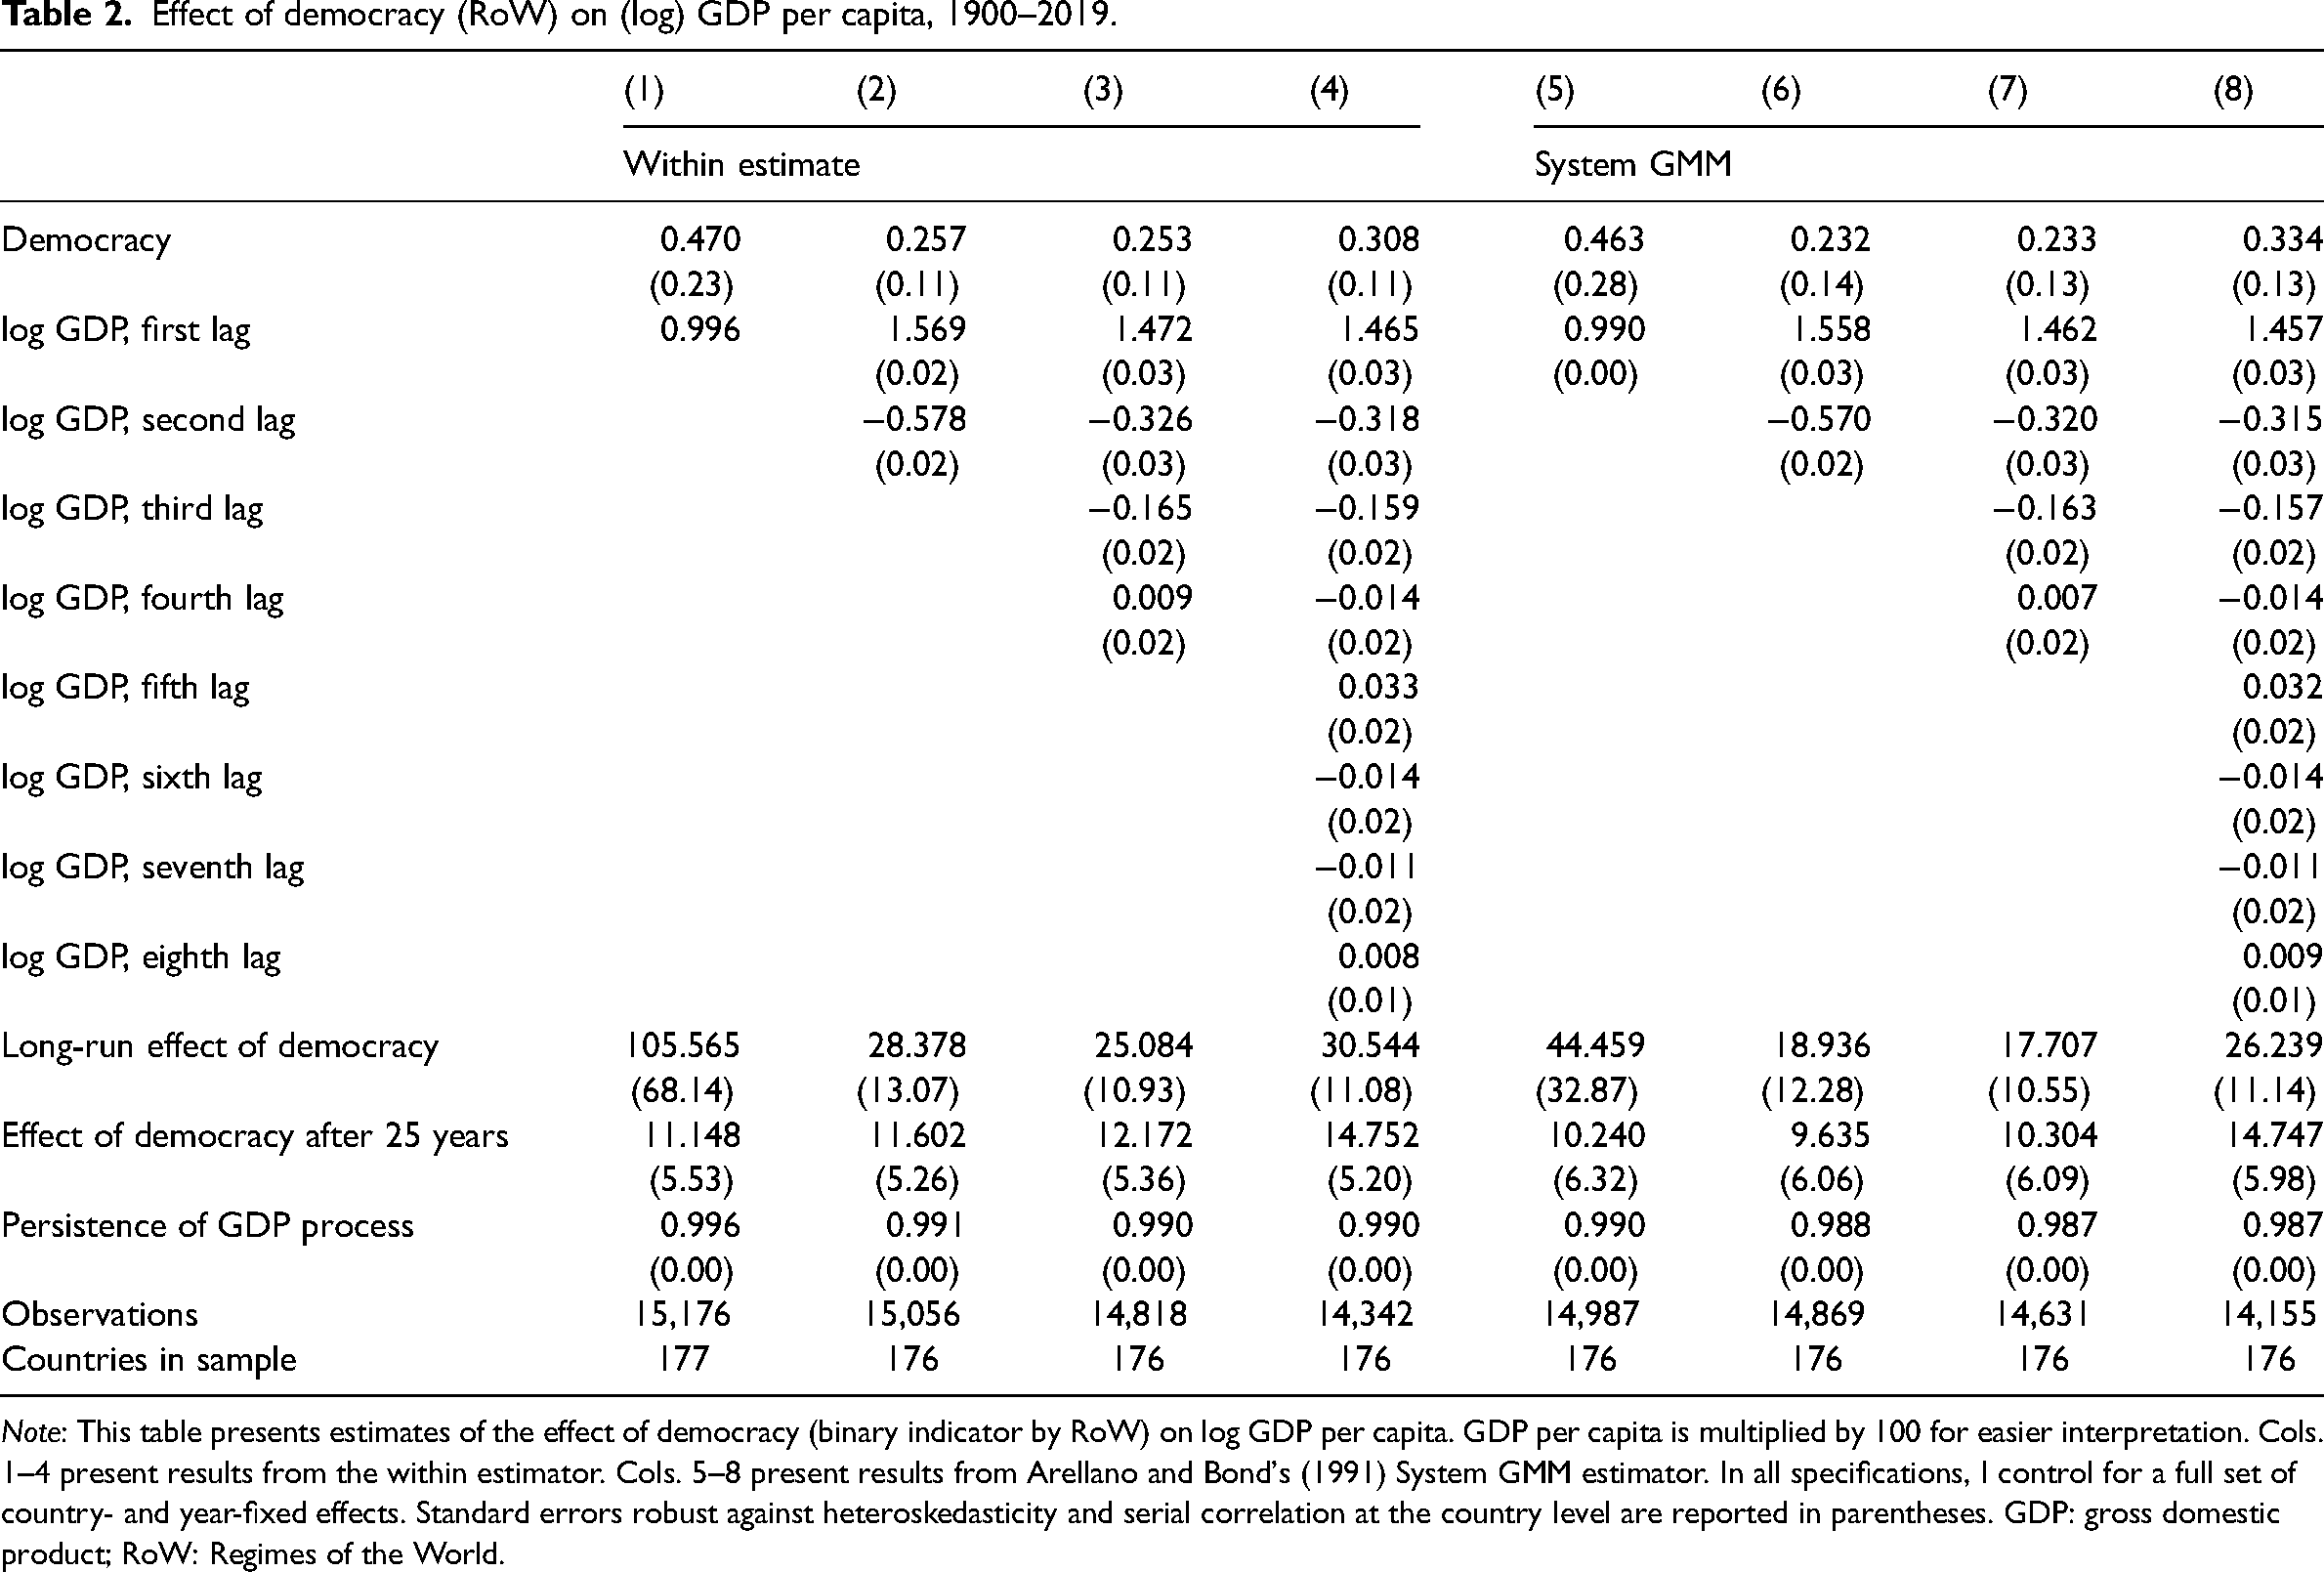
Table 2 shows that GDP per capita is relatively persistent with a coefficient for lagged (log) GDP per capita of 0.996–0.987, which fits well the stationary assumption. Column 2 adds a second lag, while Column 3 includes four lags of GDP per capita, and Column 4 includes eight lags of GDP per capita. The effect of democracy on GDP per capita (log) is estimated to be positive with a coefficient of 0.253 (SE = 0.11) in Model 3, the preferred lag specification. After 25 years, a transition to democracy has a positive effect of about 12.172% on GDP per capita (SE = 5.36). The overall patterns in those specifications are very similar to the first column.
Effect of democracy (RoW) on (log) GDP per capita, 1900–2019.
Note: This table presents estimates of the effect of democracy (binary indicator by RoW) on log GDP per capita. GDP per capita is multiplied by 100 for easier interpretation. Cols. 1–4 present results from the within estimator. Cols. 5–8 present results from Arellano and Bond's (1991) System GMM estimator. In all specifications, I control for a full set of country- and year-fixed effects. Standard errors robust against heteroskedasticity and serial correlation at the country level are reported in parentheses. GDP: gross domestic product; RoW: Regimes of the World.
In addition, to substantively interpret the findings, Figure 3 plots the effects of a transition on GDP per capita at time 0 and subsequent years after democratization, together with 95% confidence intervals (based on Model 3). It shows that 25–30 years after a democratic transition, GDP per capita is 12.17%–13.9% higher than at the year of the transition. However, as also shown in Figure 3, the confidence intervals are relatively wide, but the estimators are relatively certain that democracy has a positive effect on economic development, as they range from small positive effects at t = 25 to strong positive effects.
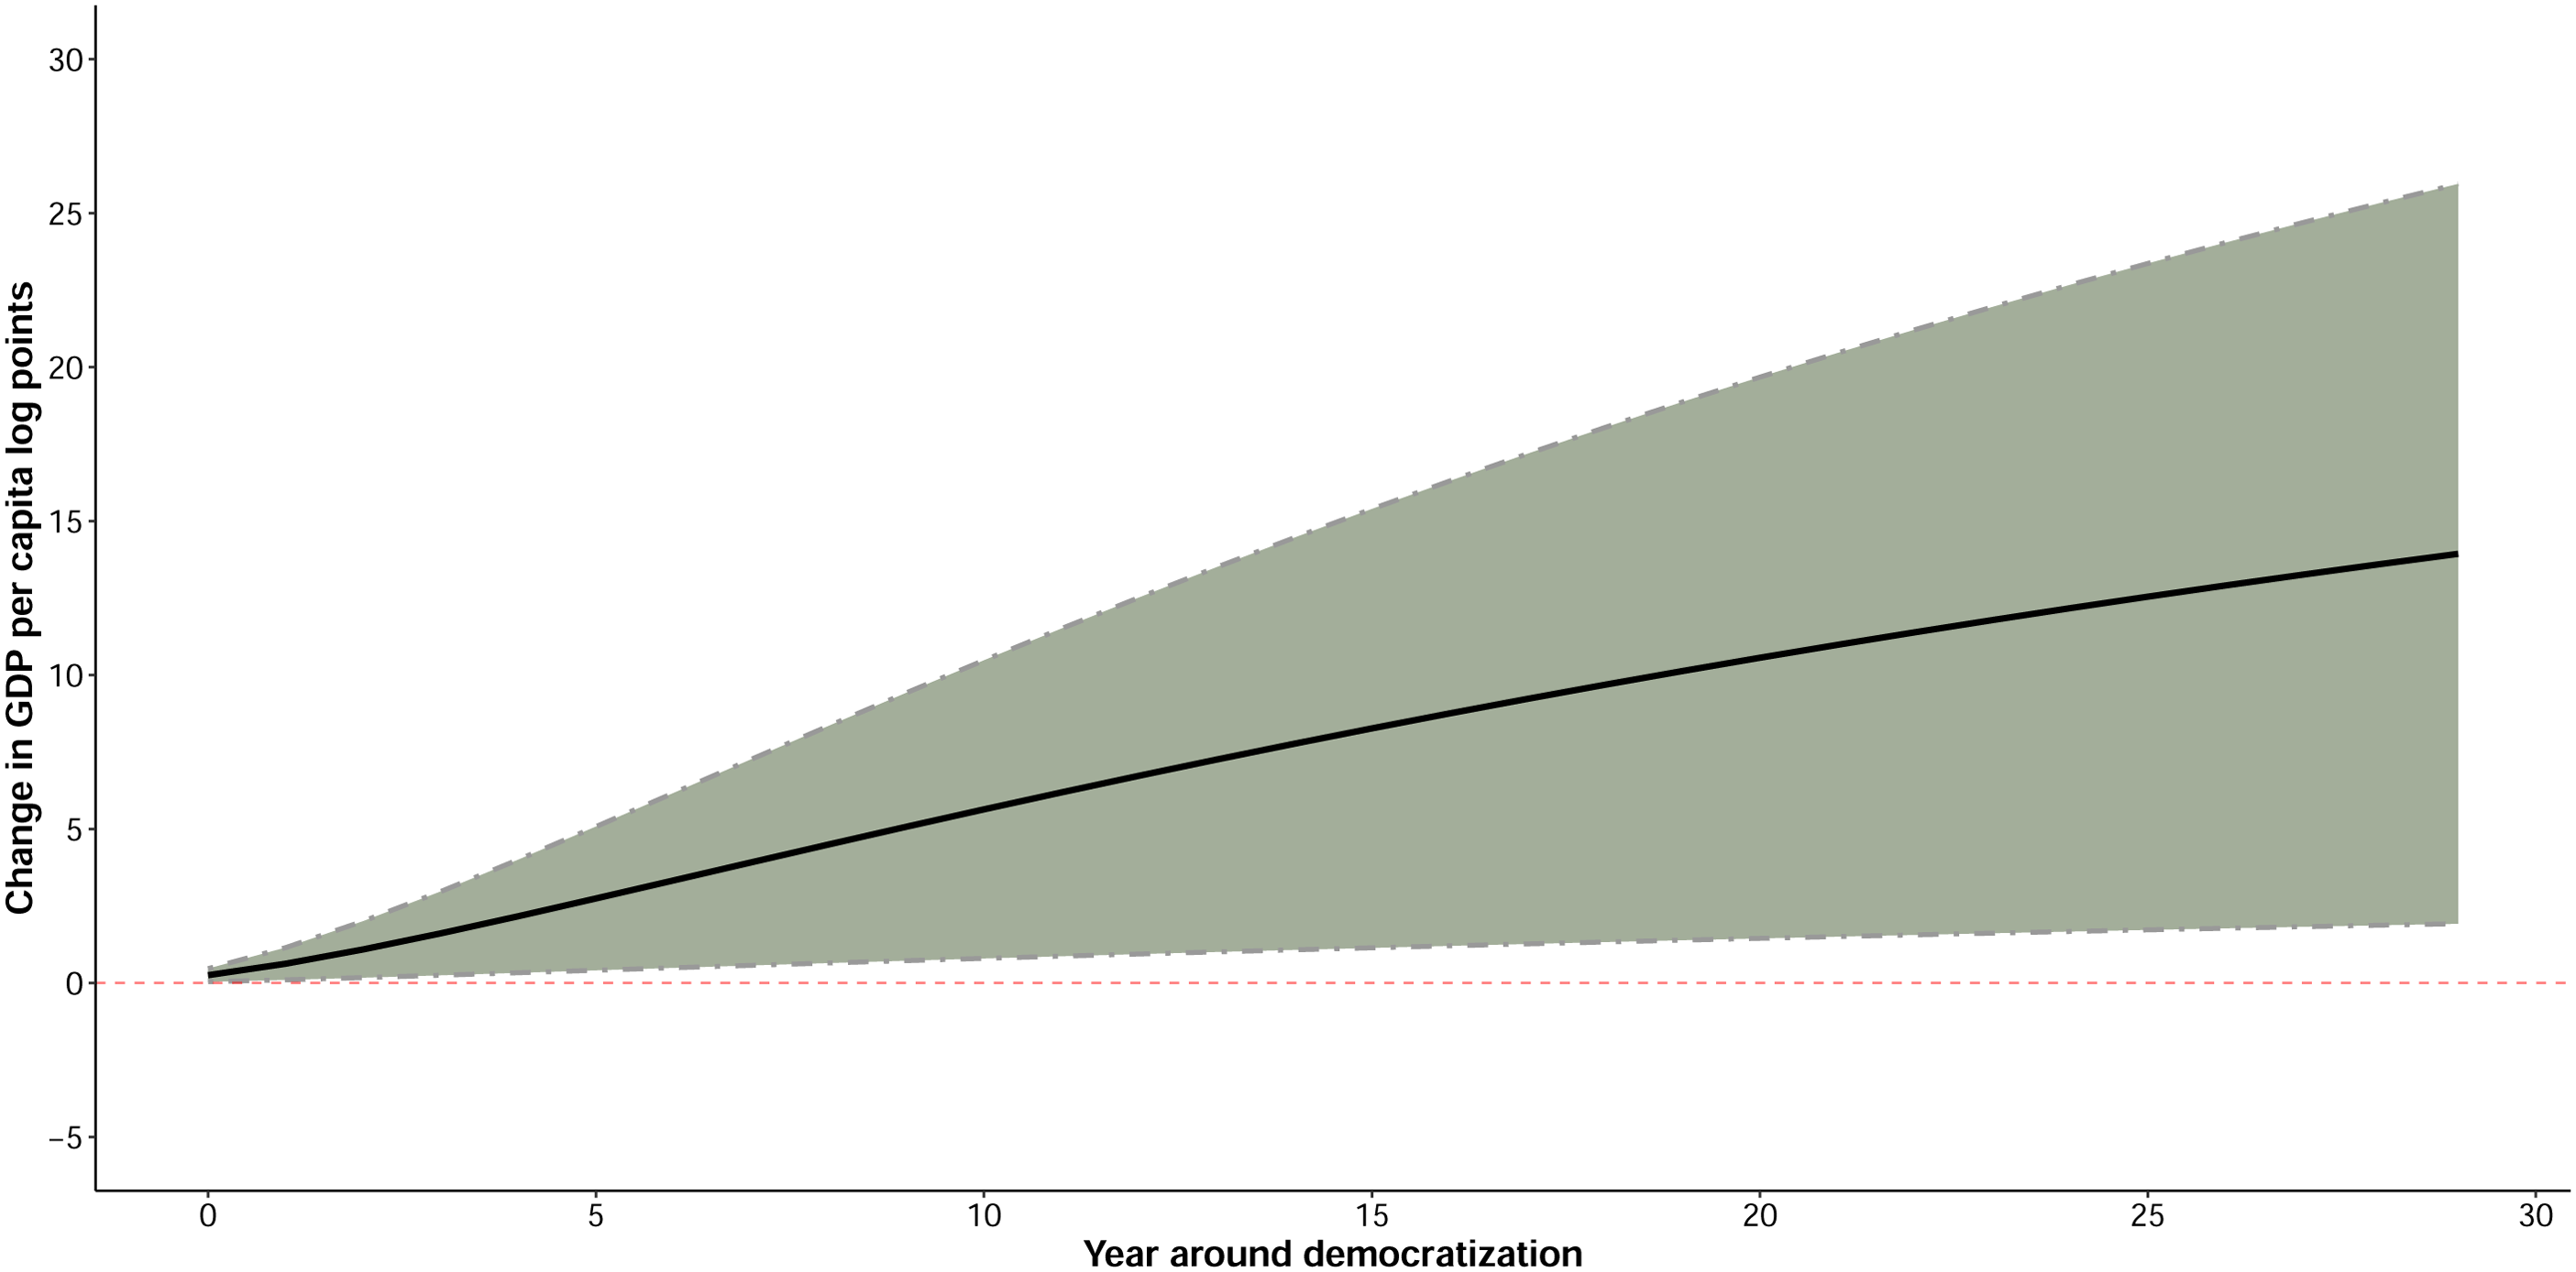
Dynamic panel model estimates of democracy and log gross domestic product (GDP) per capita, 1900–2019. This figure shows the estimated change in the log GDP per capita caused by a transition to democracy. A 95% confidence interval obtained with the delta method is presented in dotted lines.
Democracy dividend, 1789–2019
In the next step, I control for the temporal coverage of the baseline results. A critical threat to inference of the estimates reported in the first step comes from the temporal scope of the study. As indicated above, the long-run effects of a transition after 25 and 30 years are comparable to the ANRR findings. However, the major improvement of the first step comes from the increased year coverage that was used in Step 1: ANRR uses a temporal coverage from 1960 to 2010, while in the first step, this study enlarges the sample to 1900–2019. 6
In this step, I further increase the temporal coverage to 1789–2019. Democracy is defined as countries that have a 0.5 or higher on the EDI, while countries with less than 0.5 on the EDI are defined as non-democracies, as described in the ‘Data and Methods’ section.
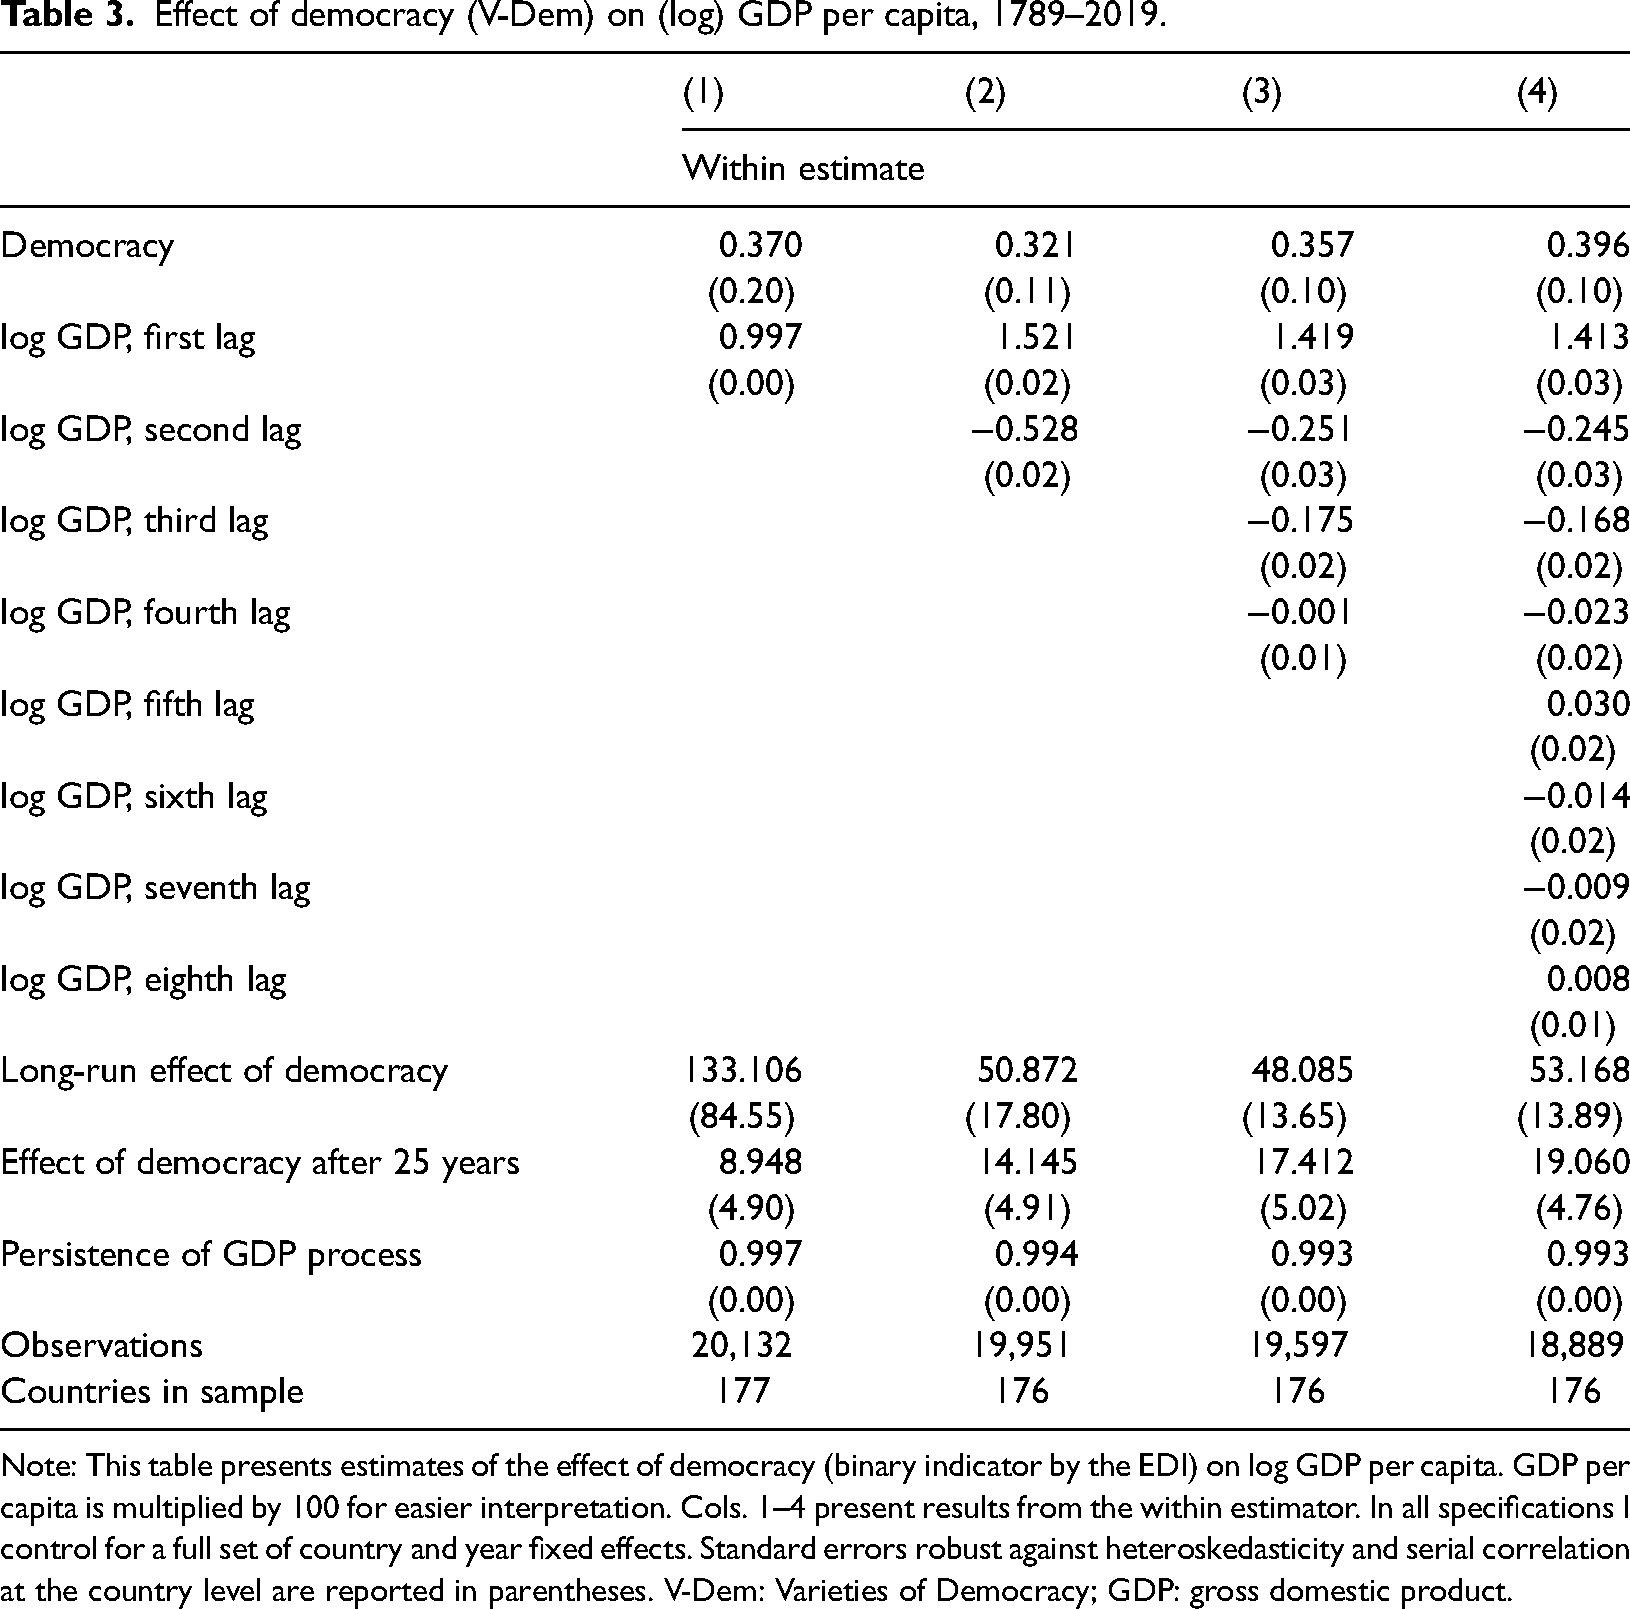
In accordance with Step 1, Table 3 indicates that GDP per capita is relatively persistent with a coefficient on lagged (log) GDP per capita of 0.997–0.993. The within estimate for the short-term effect of democracy is now 0.357 (Model 3 compared to 0.253 in Model 3, Table 2) with a standard error of 0.1. The effect after 25 years since democratic transition presented in Table 3 is slightly increased with an within estimate of 17.412%.
Effect of democracy (V-Dem) on (log) GDP per capita, 1789–2019.
Note: This table presents estimates of the effect of democracy (binary indicator by the EDI) on log GDP per capita. GDP per capita is multiplied by 100 for easier interpretation. Cols. 1–4 present results from the within estimator. In all specifications I control for a full set of country and year fixed effects. Standard errors robust against heteroskedasticity and serial correlation at the country level are reported in parentheses. V-Dem: Varieties of Democracy; GDP: gross domestic product.
Figure 4 shows the effects of a transition on GDP per capita at time 0 and subsequent years after democratization for the 1789–2019 sample, together with 95% confidence intervals (based on Model 3, Table 3). Even when Figure 4 shows that 25 years after a democratic transition GDP per capita is 17.412% higher at mean than at the year of transition, the confidence intervals are wide, but the estimators in all models are relatively certain regarding the positive effect, as they range from positive effects (7.85) at t = 25 to large positive effects (28.17).
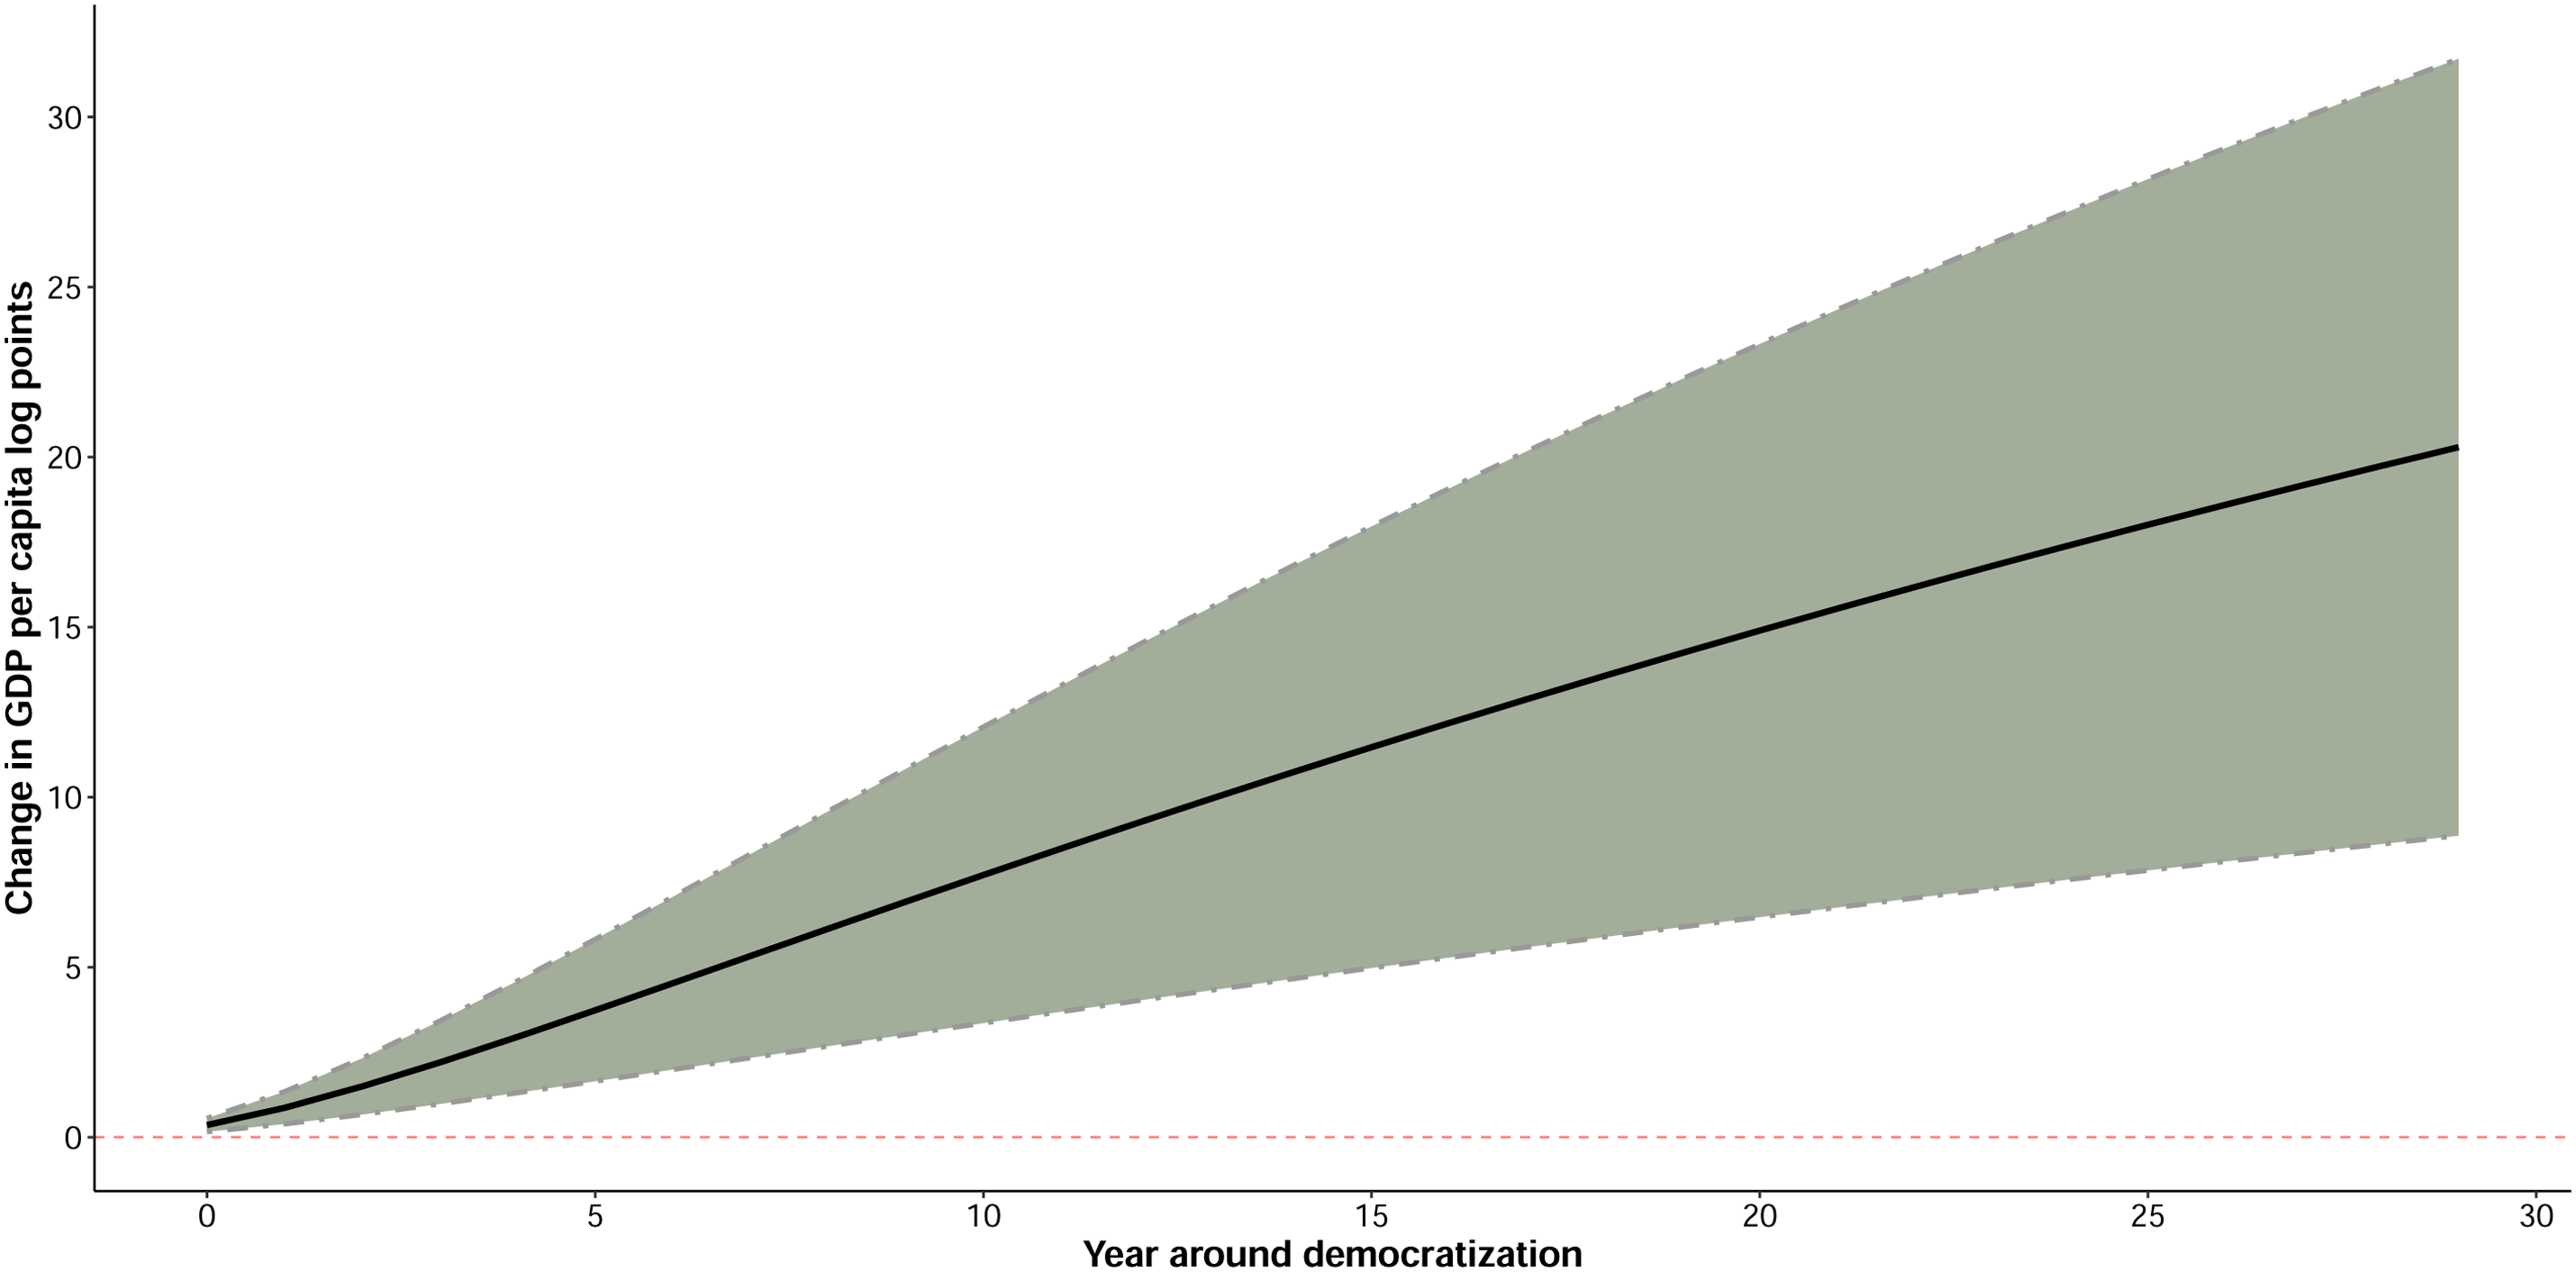
Dynamic panel model estimates of democracy and log gross domestic product (GDP) per capita, 1789–2019. This figure shows the estimated change in the log GDP per capita caused by a transition to democracy. A 95% confidence interval obtained with the delta method is presented in dotted lines.
Liberalization episodes and economic development, 1900–2019
In this section, I use an alternative measure of democratization: As shown in Figure 1, liberalization episodes cover substantial increases in the democratic quality of autocratic and democratic regimes. By using this measure of liberalization events, this section proposes an alternative strategy to estimate the effects of democratization on GDP development as it involves liberalization episodes in autocracies that may lead to a transition from a closed autocracy to an electoral autocracy, as well as a democratic deepening in democracies. Third, it also involves classical transitions from autocracy to democracy. Thus, this conceptualization of liberalization episodes is broader compared to ANRR's concept of transition to democracy.
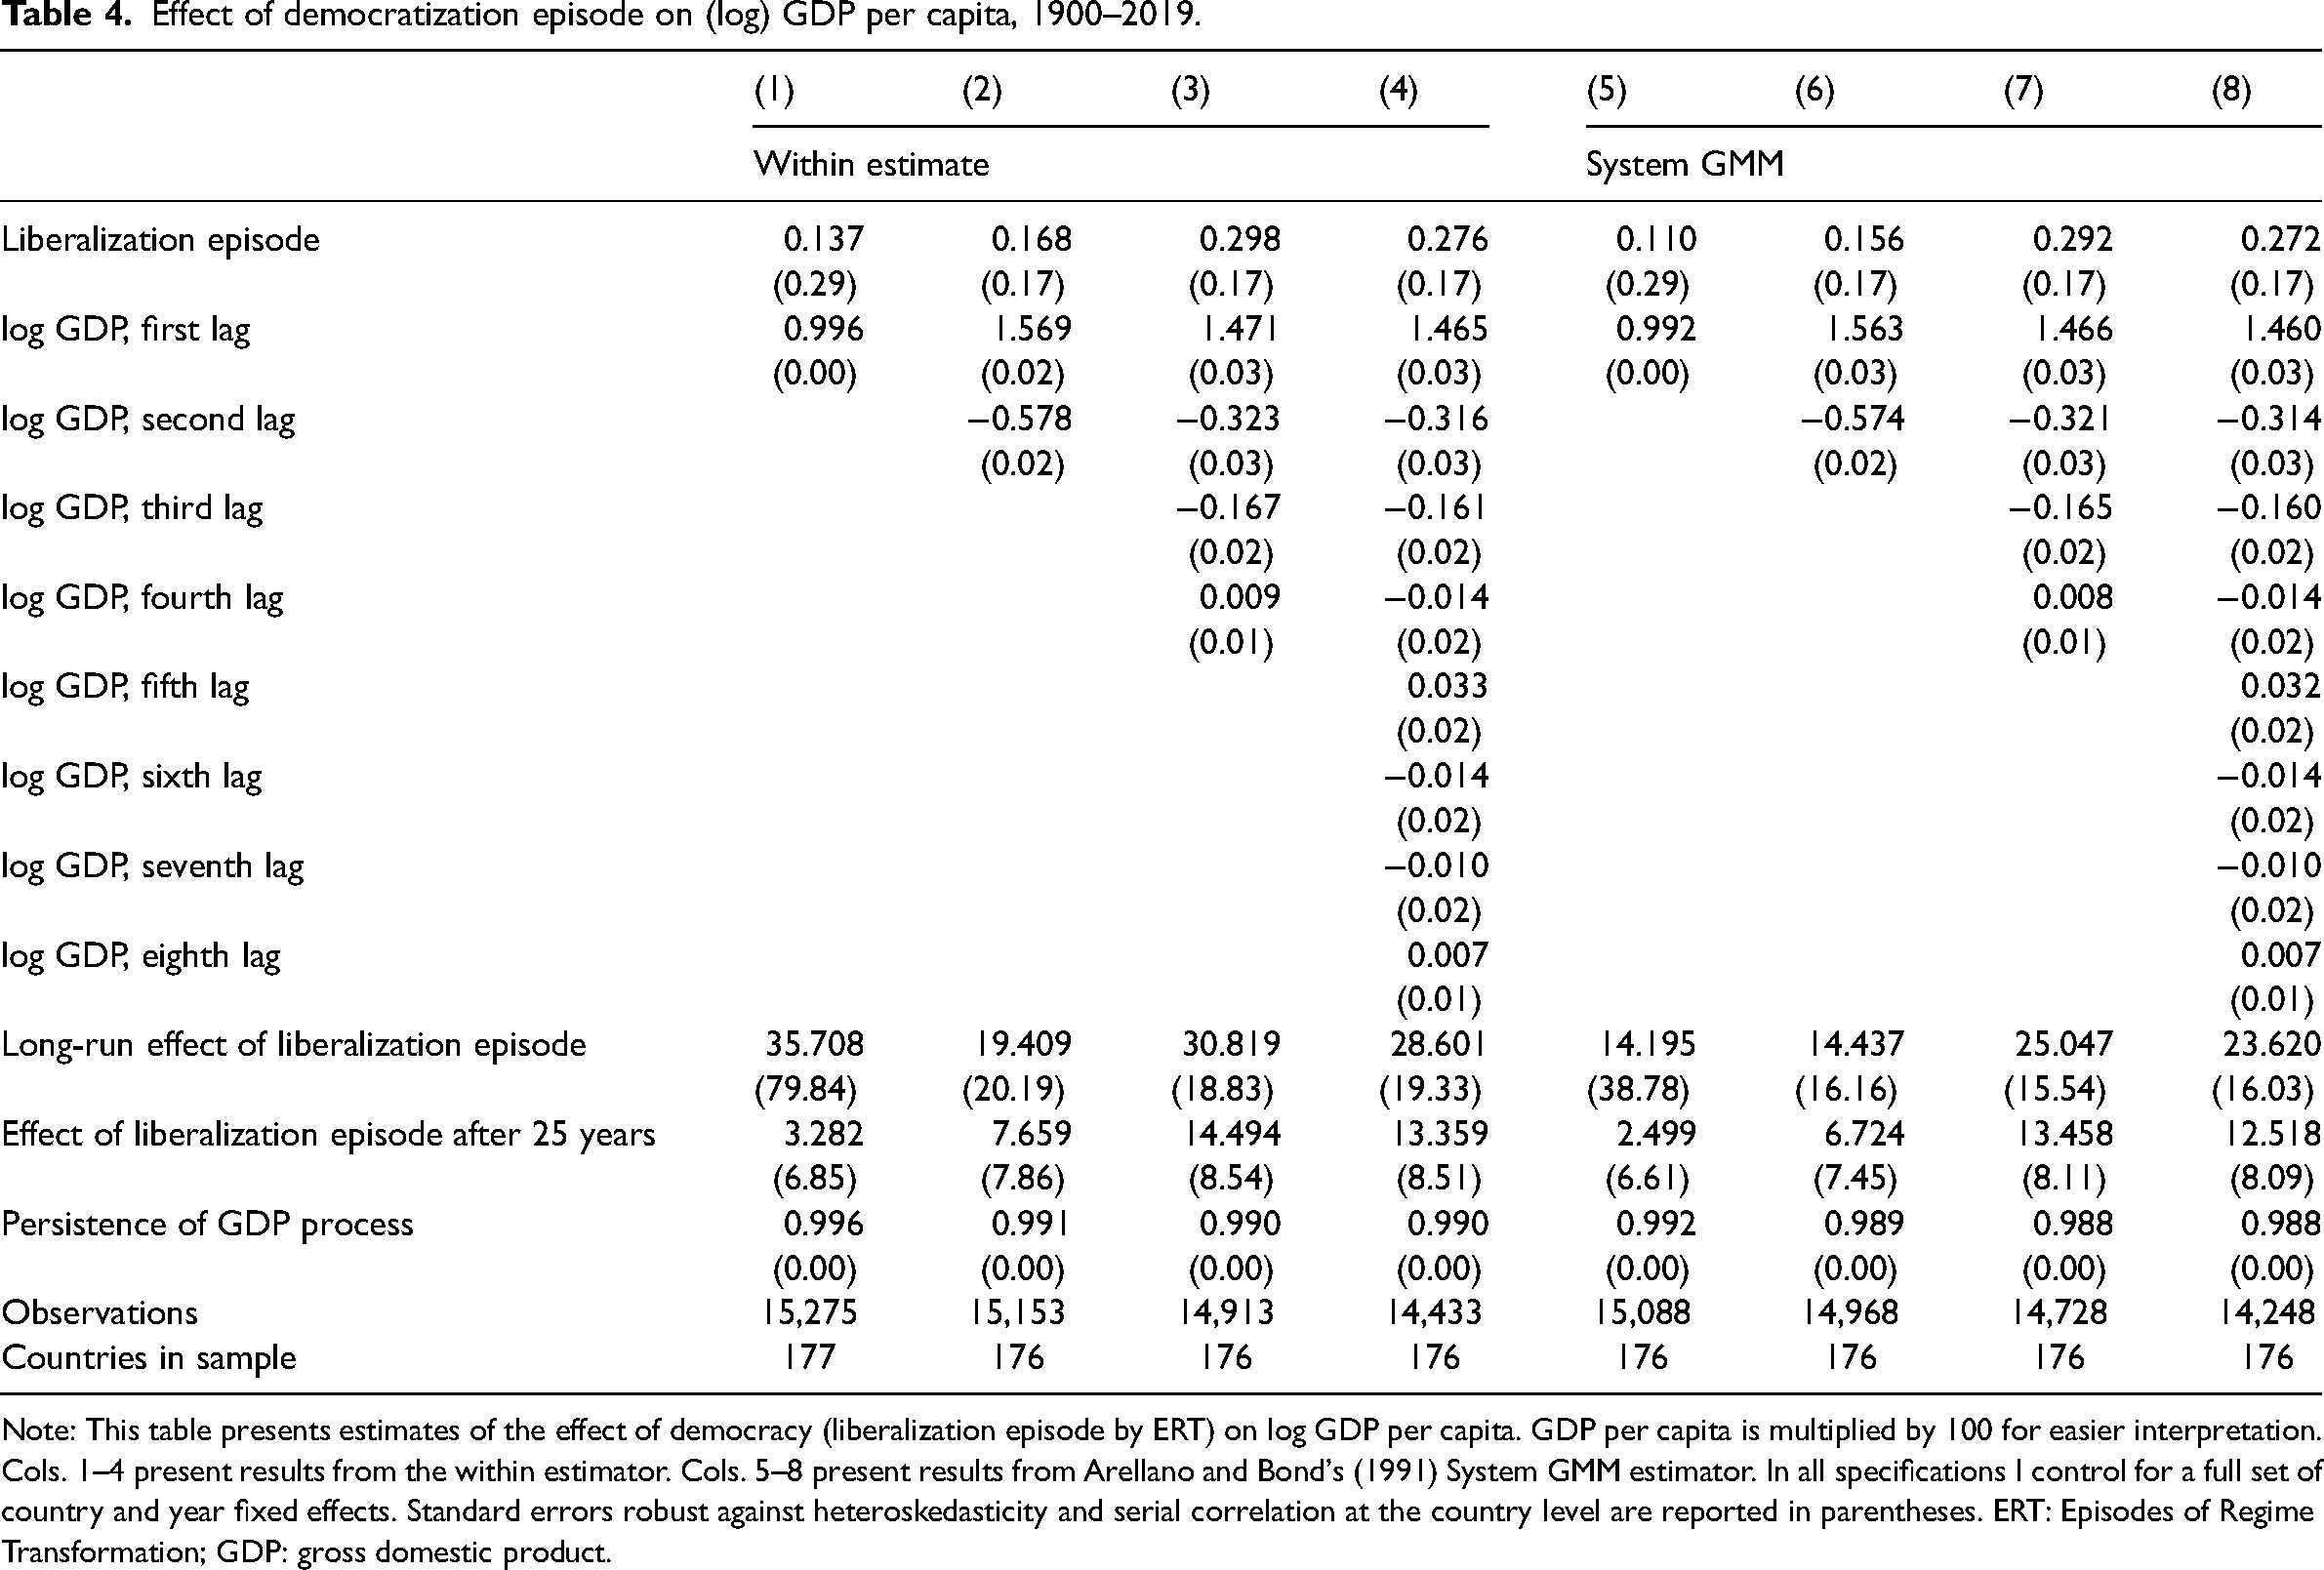
Table 4 shows that the within-estimate for the short-term effect of a liberalization episode is 0.298 (Model 3 compared to 0.253 in Model 3, Table 2) with a standard error of 0.17. The long-run effect after 25 years since a liberalization episode presented in Table 4 is substantial with a within estimate of 14.494% and a standard deviation of 8.54. The estimates presented in Models 4, 7, and 8 are comparable, while in Models 1, 2 as well as Models 5, 6 the estimates for democracy are substantially smaller.
Effect of democratization episode on (log) GDP per capita, 1900–2019.
Note: This table presents estimates of the effect of democracy (liberalization episode by ERT) on log GDP per capita. GDP per capita is multiplied by 100 for easier interpretation. Cols. 1–4 present results from the within estimator. Cols. 5–8 present results from Arellano and Bond's (1991) System GMM estimator. In all specifications I control for a full set of country and year fixed effects. Standard errors robust against heteroskedasticity and serial correlation at the country level are reported in parentheses. ERT: Episodes of Regime Transformation; GDP: gross domestic product.
Figure 5 shows the effects of a liberalization episode on GDP per capita at time 0 and subsequent years after a liberalization episode onset for the 1900–2019 sample, together with 95% confidence intervals (based on Model 3, Table 4). Even when Figure 5 shows that 25 years after a liberalization episode onset GDP per capita is 14.947% higher at mean than at the year of the start date of a liberalization episode, the confidence intervals are wide and the estimators in all models are uncertain, as they range from small negative effects (−2.326) at t = 25 to large positive effects (32.219). The substantive conclusion is, however, that not only democratic transitions cause economic growth but also liberalization episodes in autocracies and democracies foster economic development.
Dynamic panel model estimates of liberalization episodes and log gross domestic product (GDP) per capita, 1900–2019. This figure shows the estimated change in the log GDP per capita caused by liberalization episodes. A 95% confidence interval obtained with the delta method is presented in dotted lines.
Democracy dividend and diff-in-diff matching, 1900–2019
In this section, I provide estimators for the democratic dividend using a difference-in-differences approach with matching methods for TSCS data by Imai et al. (2023). This section, therefore, provides a more flexible strategy that does not rely on the linearity assumption of the dynamic linear regression models implemented in the first three steps. These diff-in-diff estimators are especially useful when the treatment effects are likely to be heterogeneous, selection into treatment is likely to be endogenous and nonparallel treatment effects (see Athey and Imbens, 2018; de Chaisemartin and D’Haultfœuille, 2020; Imai et al., 2023) that are highly likely in the case of democracies’ effect on GDP per capita.
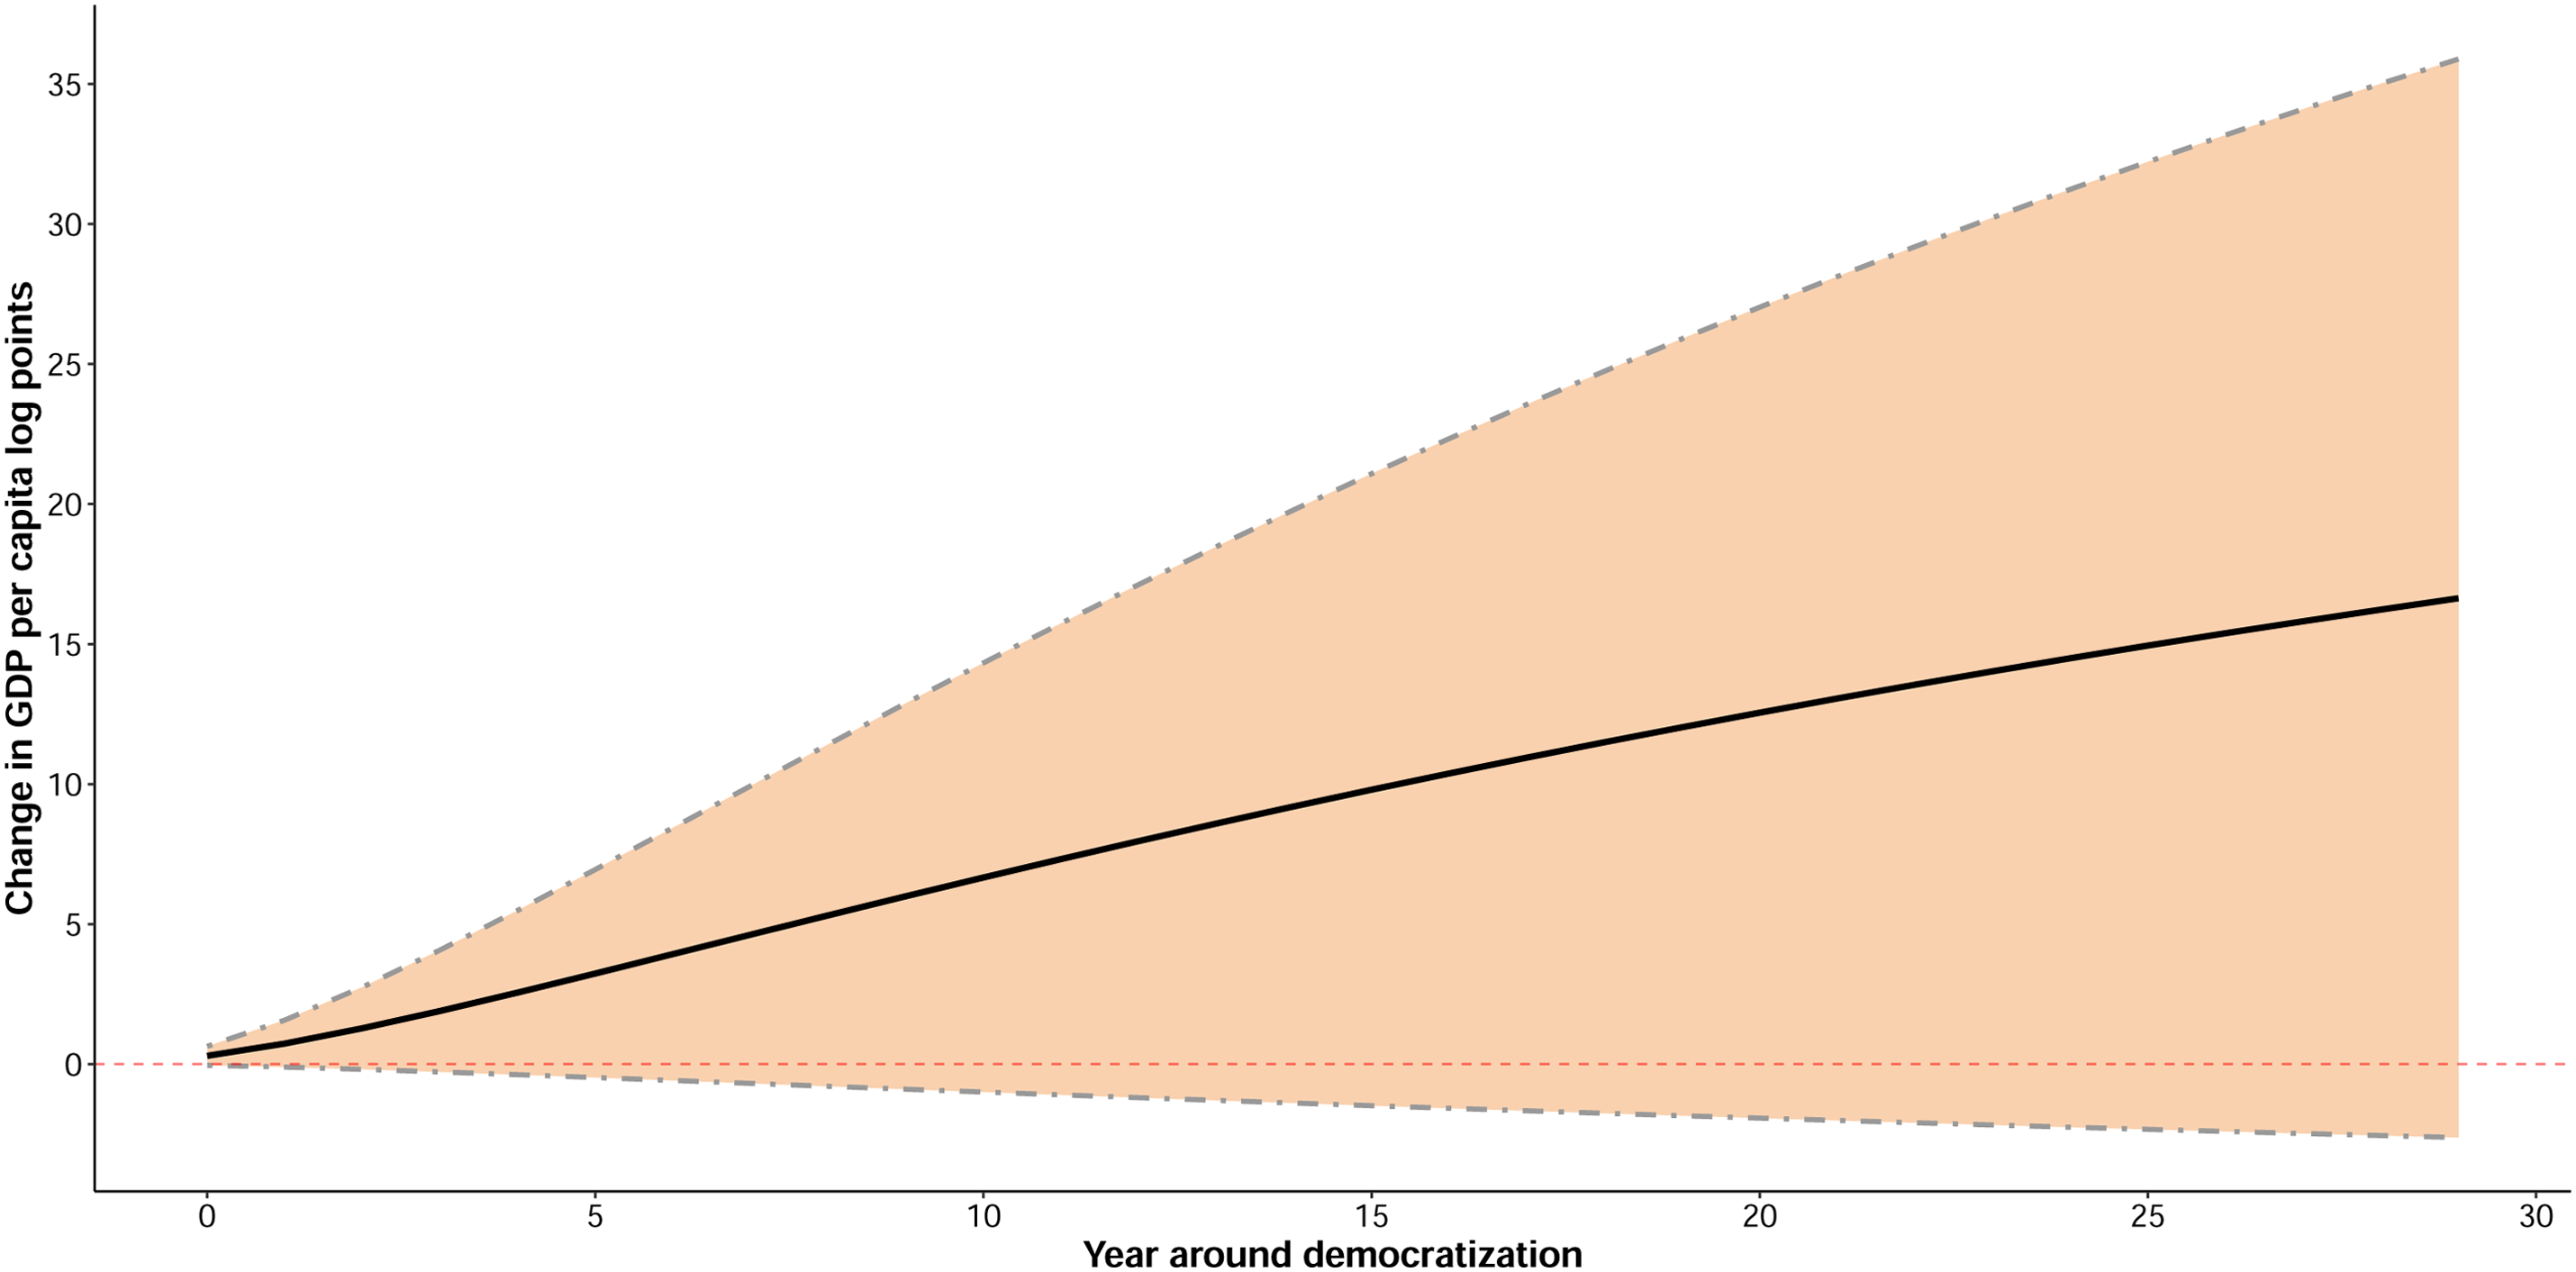
Figures 6 displays the core results based on equation (2) and Mahalanobis matching. To reiterate, I expect democratization as a treatment to increase log GDP per capita. Figure 6 shows the estimates of the effects of democracy on economic development for the period of 20 years after the beginning of democratization. The results generally support the expectations and indicate that democracy has a long-run (20 years) substantial positive effect of 13.067 with a standard error of 6.01. Figure 6 also shows the bootstrap confidence intervals that indicate that the point estimates are relatively certain.
Estimated average effects of democratization on economic development (1900–2019). The estimates for the average effects of democratization are shown for the period of 20 years after the treatment with 95% bootstrap confidence intervals as dotted lines. Mahalanobis Matching as the refinement method was considered.
Figure A1 shows the additional estimates based on different refinement methods, such as propensity score matching and covariate balance propensity score weighting. However, as shown by the improved covariate balance in Figure A2, Mahalanobis matching shows the biggest improvement in the covariate balance. However, all other estimators based on the matching techniques presented in Figure A1 indicate that the economic dividend of democracy is substantial. In sum, my analysis implies that democratization increases GDP per capita as a measure of economic development in the short- to medium-term in the period between 1900 and 2019. Thus, the findings from ANRR are validated by (a) the replication of the original dynamic linear regression models, and (b) by more flexible diff-in-diff estimators based on matching methods for time-series cross-section data.
Diff-in-diff estimator for the democracy dividend, 1789–2019
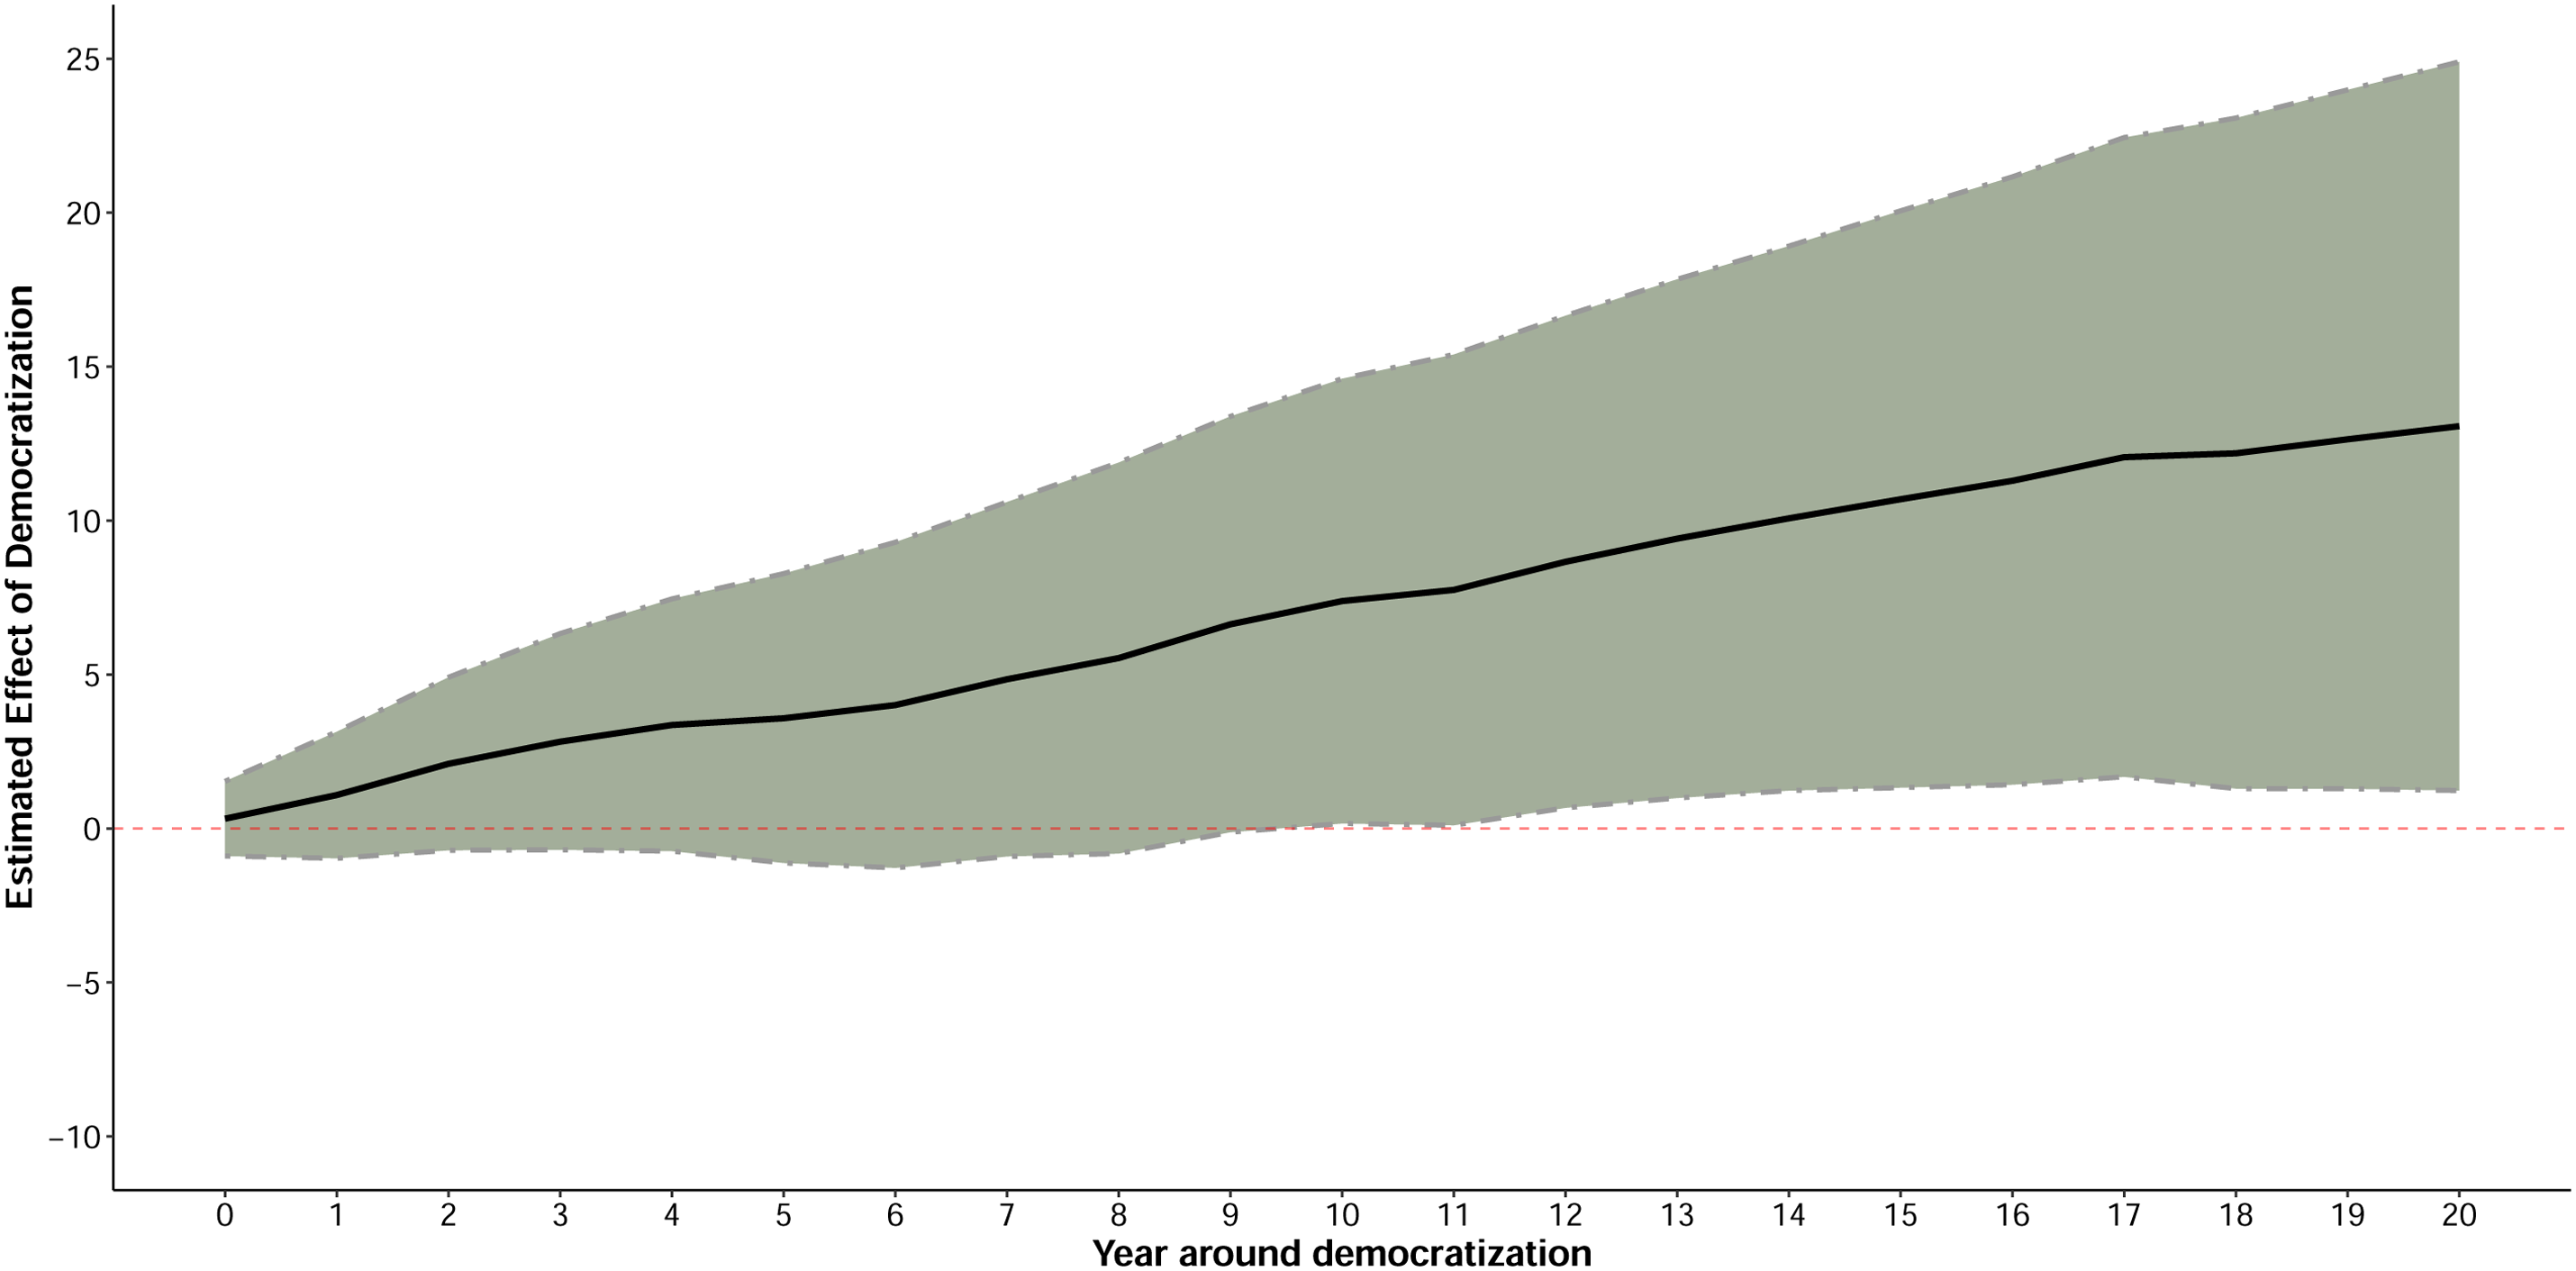
As previously, I control for the temporal scope of the diff-in-diff estimator baseline results. As indicated above, the long-run effects of a transition after 20 years are comparable to the baseline linear regression findings that are implemented in the first step of inquiry. In this step, I increase the temporal coverage from 1789 to 2019.
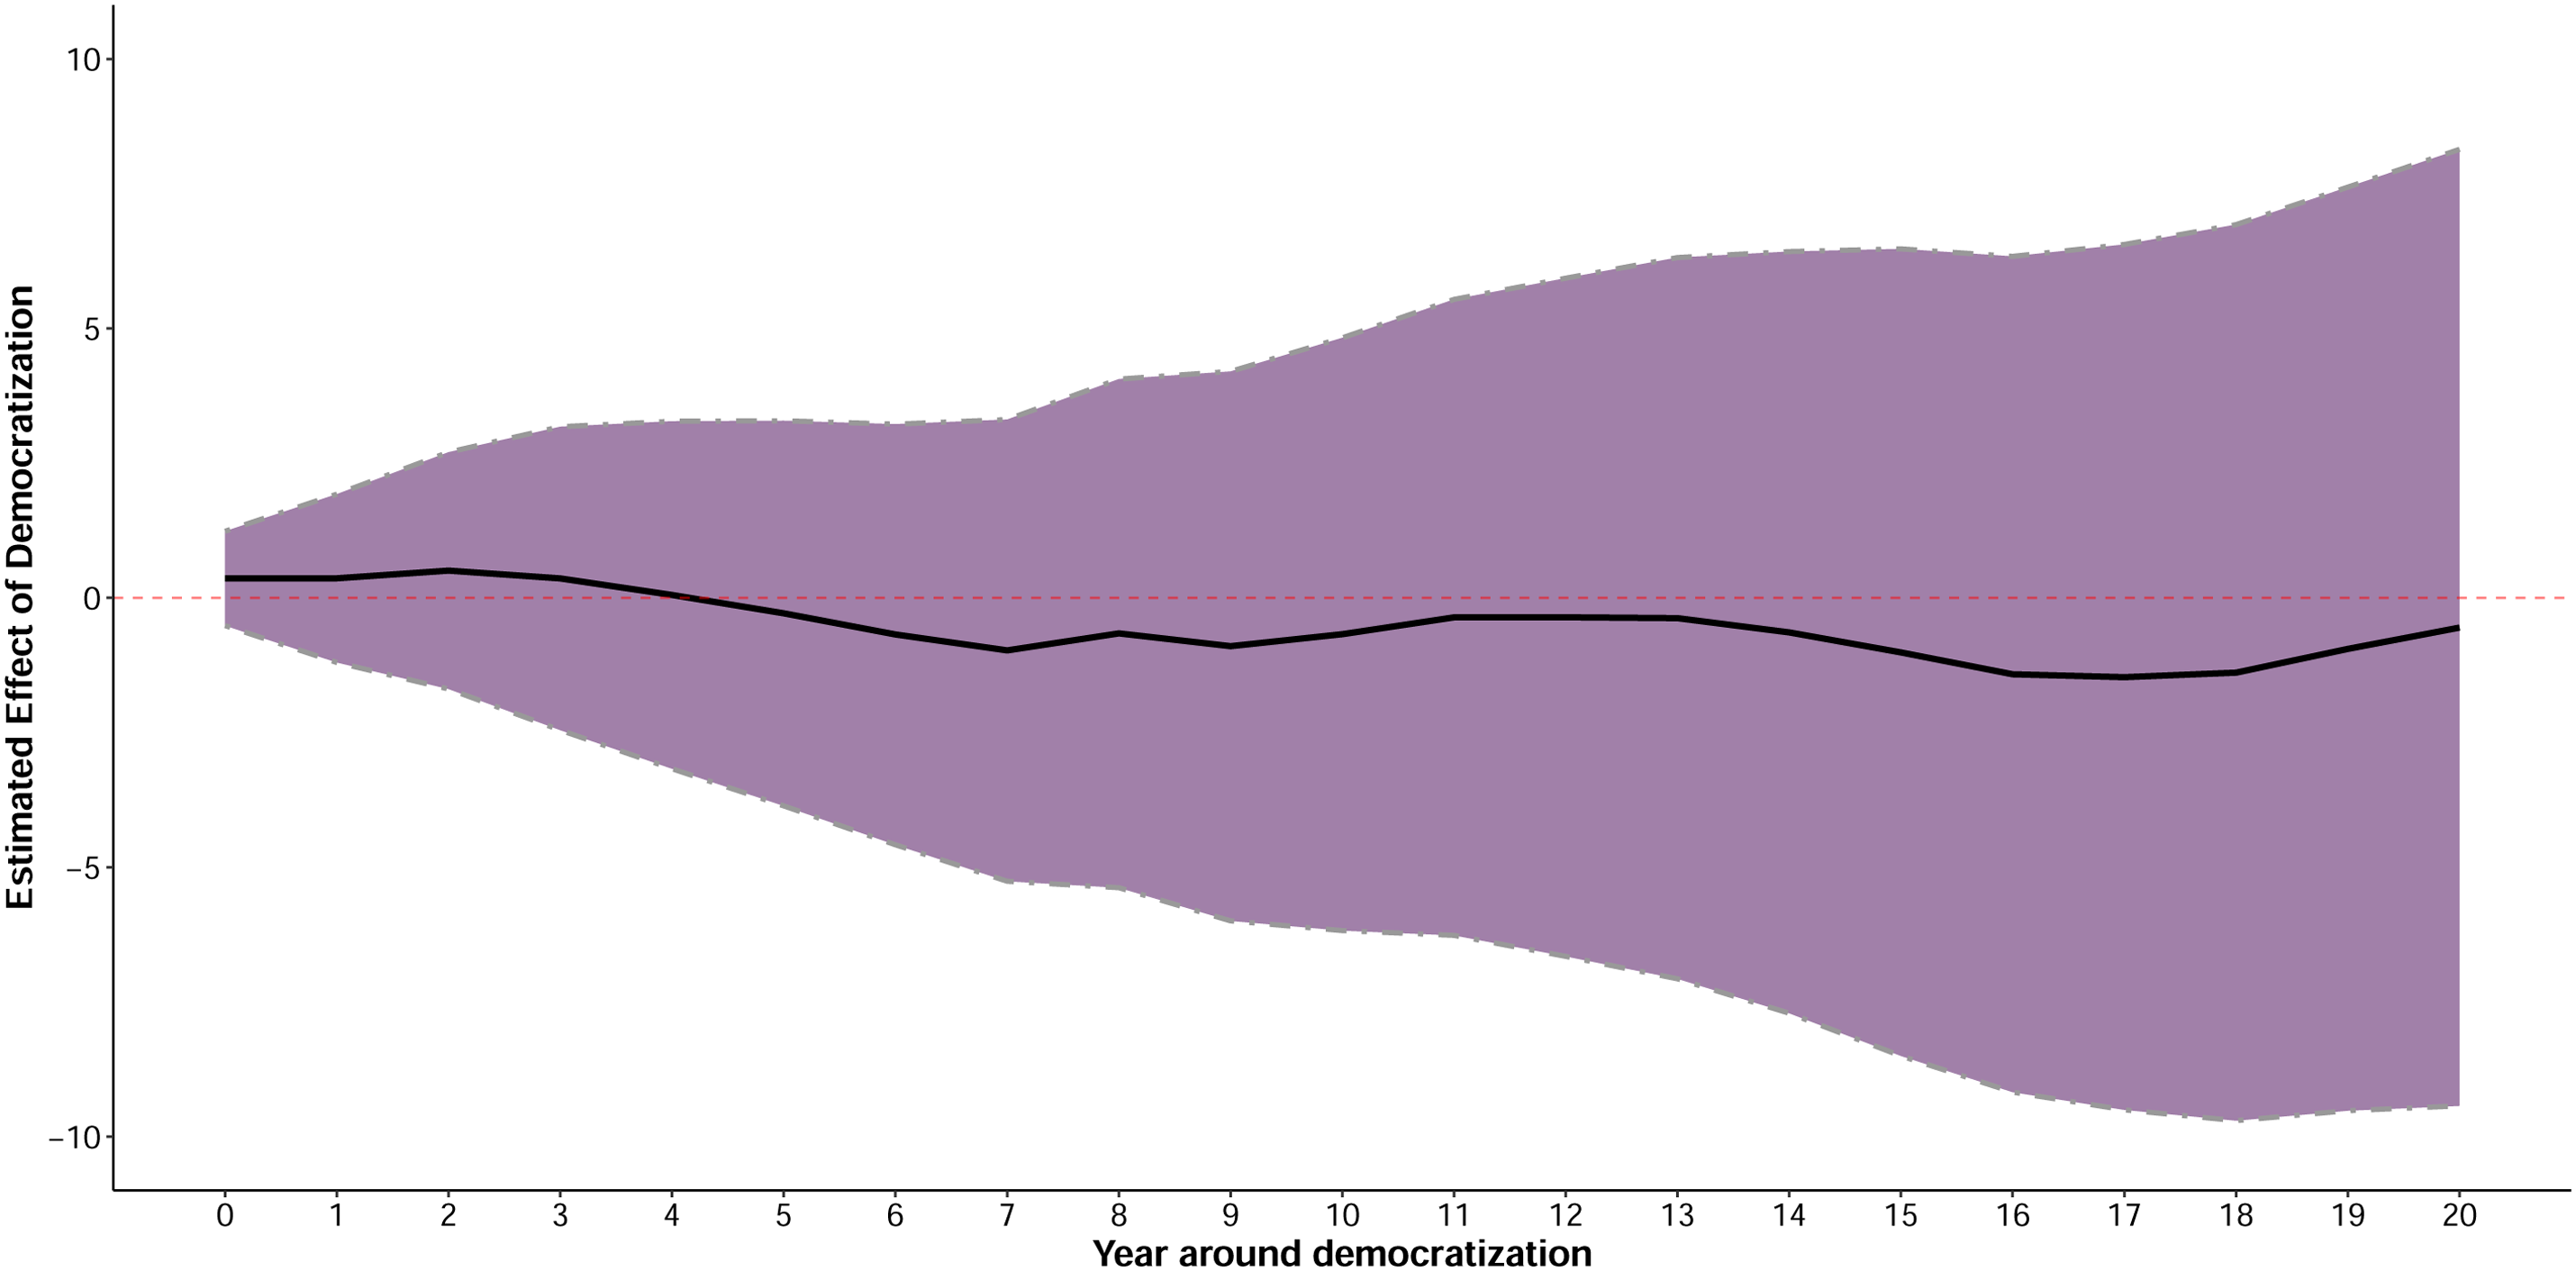
In accordance with the previous step, Figure 7 indicates that the short-term effect of democracy is now 0.795 (compared to 0.318 in Figure 6) with a standard error of 0.568. The long-run effect after 20 years since a democratic transition presented in Figure 6 is slightly increased with an estimate of 15.401% and a standard error of 5.572.
Estimated average effects of democratization on economic development (1789–2019). The estimates for the average effects of democratization are shown for the period of 20 years after the treatment with 95% bootstrap confidence intervals as dotted lines. Mahalanobis Matching as the refinement method was considered.
Again, Figure A3 in the Supplementary Appendix shows additional estimates based on different refinement methods. However, as shown by the improved covariate balance in Figure A4, Mahalanobis matching now does not have the biggest improvement in the covariate balance, while propensity score matching and weighting procedures produce more covariate balance. However, all other estimators based on the matching techniques presented in Figure A3 indicate that the democracy dividend is substantial but more uncertain compared to the baseline results plotted in Figure 7. Nevertheless, the compelling positive effect of democracy on economic development remains relatively stable.
However, in sum, the analysis for the longer time period between 1789 and 2019 implies that democratization increases GDP per capita in the short to long-term. Thus, the findings from ANRR are again validated by (a) the replication of the original dynamic linear regression models, and (b) by more flexible diff-in-diff estimators based on matching methods for time-series cross-section data.
Liberalization episodes and diff-in-diff estimator, 1900–2019
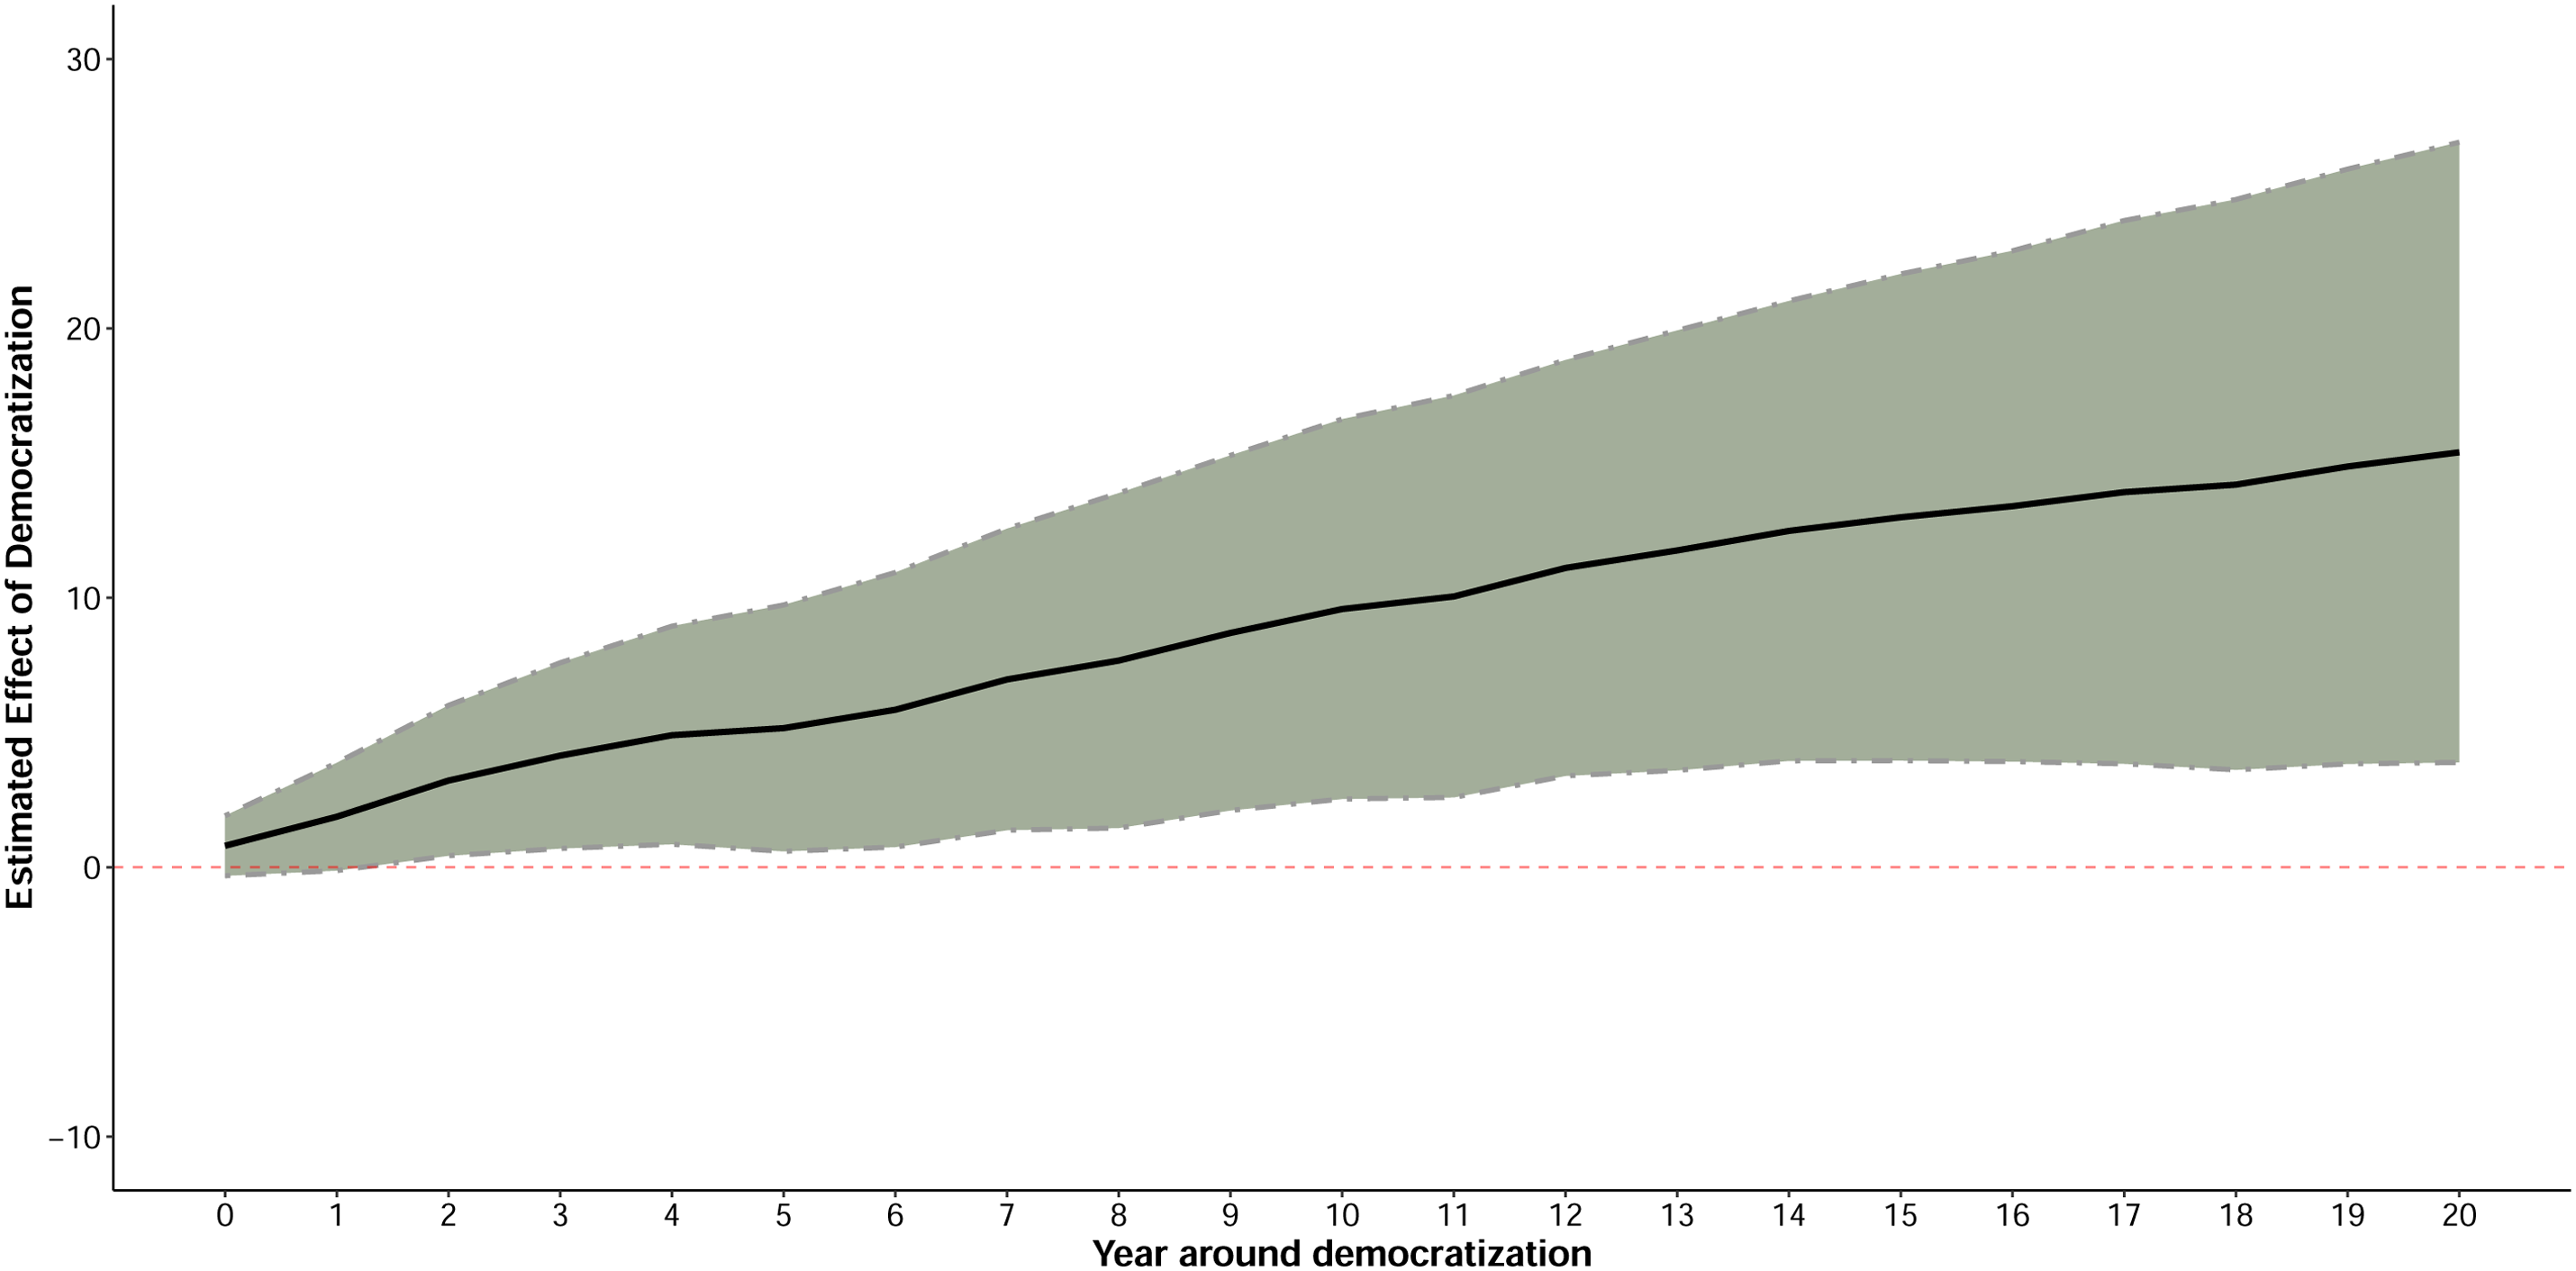
In this section, I measured the treatment variable as a liberalization episode with an increase of at least 0.1 in the EDI. By combining this treatment variable with Imai et al.'s diff-in-diff estimator, this section proposes a rigorous strategy to estimate the effect of liberalization onset on GDP per capita development and contribute to the findings from the third step.
Figure 8 shows the effects of an onset of liberalization episode on GDP per capita at time 0 and subsequent years after a liberalization episode for the 1900–2019 sample, together with 95% confidence intervals based on propensity score weighting and 100 iterations. Figure 8 clearly questions the findings from the third step. With the dynamic linear panel models implemented previously, I find that liberalization episodes have a substantial positive effect on economic development, while Figure 8 shows that liberalization episodes have neither a short-term nor a long-term effect on economic prosperity. This finding is reconfirmed by other estimators based on the different matching techniques presented in Figure A5. Figure A5 indicates that the liberalization episode dividend for economic development is absent.
Estimated average effects of liberalization episode on economic development (1900–2019). The estimates for the average effects of liberalization episode are shown for the period of 20 years after the treatment with 95% bootstrap confidence intervals as dotted lines. Propensity score weighting as the refinement method was considered.
In sum, my analysis shows cautious but conclusive evidence that liberalization episodes are likely to have no statistically significant positive effect on economic development between 1900 and 2019 in the short- and medium-term. Thus, this article indicates that democratic transitions to democracy have a substantive and long-term development effect, while liberalization episodes that include democratic deepening in democracies as well as liberalization episodes in autocracies that do not lead to a democratic transition, have no clear economic developmental advantage for these countries.
Robustness tests
As shown in the article, I tested a large battery of specifications. Briefly summarized, the main findings are robust. However, this section presents additional specifications and tests.
First, “critical threats to the validity of the estimates […] come from the presence of time-varying economic and political factors that simultaneously impact democracy and GDP” (Acemoglu et al., 2019: 65). Therefore, in additional robustness tests as reported in Tables A2, A3, and A5 and Figures A1, A2, and A3 in the Supplemental Appendix, I include the level of electoral democracy, the log population, the bureaucratic quality, the state authority of territory, as well as the average 5-year GDP per capita growth rates prior to democratization as covariates. The findings indicate very similar patterns for the point estimates, whereas the uncertainty of these estimates is larger compared to the baseline specifications. In addition, I test for the effect of the Cold War by using split samples (Supplementary Appendix B4). The findings reveal that the effect of democracy after 25 years is estimated to be between 12.2% and 17% on GDP per capita for the Cold War years, and between 3.2% and 9.5% for the non-Cold War years. However, the interrupted time series may result in imprecise estimates.
In an additional test, I use a split-sample strategy and investigate whether the main results hold for the 18th and 19th century. Table A5 suggests that democracy had no substantial effect on economic development in the 18th and 19th century when measuring democracy in a dichotomous way and for a sample of 68 countries of which only four were classified as an electoral democracy.
Second, I test whether the democratic dividend for economic development holds when using the GDP per capita growth rates instead of the log GDP per capita. Section C of the Supplementary Appendix shows the short and long-run effects of democracy on GDP per capita growth rates and suggests that democracy has a substantial and positive but insignificant effect on growth in all specifications as reported in Tables A6, A7, and A8. However, all specifications also show that GDP per capita growth rates exhibit little persistence.
Another concern is that time-varying but omitted variables simultaneously affect the likelihood of democracy and GDP per capita (Acemoglu et al., 2019: 79). Therefore, I test the main findings by analysing the democracy dividend with an IV strategy. As implemented by ANRR, these IV robustness tests analyse regional democratization waves as exogenous variables that are defined as the percentage of democracies in a region 7 but that leave out the own country-year observations. Thus, the equation is similar to the baseline equation, but in the 2SLS models, I treat democracy as endogenous and instrument it by using four lags of the regional democratization waves.
Section D shows the first-stage and 2SLS estimates. The f-statistics for the excluded instruments suggest that regional democratization waves strongly increase the likelihood of democracy in a region. Panel A of Table A9, Columns 2 and 3 use the preferred lag structure with four lags of GDP per capita and the instrument and show that democracy has a positive and significant effect on GDP per capita around 34% (standard error = 18.55) on GDP per capita for the period between 1789 and 2019. Column 4 shows that democratization episodes have no consistent effect on GDP per capita in the 2SLS specification and thereby confirms our main findings.
Discussion and conclusion
In this paper, I reestimate the main findings from ANRR seminal study on democracy and economic growth by using a sample of countries across the world from 1789 to 2019 and thereby increase the original sample by more than 180 years. In addition, using different rigorous measures of democracy for 20,000 country-years with a mean of more than 80 years per country, this article presents compelling evidence of a democratic dividend for economic development in the long-run, while liberalizations in autocracies as well as democratic deepening in democracies seem to have no such impressive growth advantage.
The triangulation of evidence from (a) dynamic linear panel data models (see Acemoglu et al., 2019), and (b) matching methods for this data (Imai et al., 2023) all leading to similar estimates for the impact of democracy on GDP per capita when considering nonpermanent transitions to democracy, indicates that there is a positive effect of around 15% on economic development. In addition, I cannot find support, neither in the dynamic panel models nor in the matching estimators that liberalization episodes have a significant and substantive positive effect on economic growth. Thus, democratic deepening in democracies as well as liberalization episodes in autocracies that do not lead to a democratic transition are associated with economic development, while the signal-to-noise ratio does not exceed conventional limits of statistical significance. This finding emphasizes the notion that democracy is a stock that matures over time as argued by Gerring et al. (2005). In addition, the findings implicate that a short democratic episode may not engender economic growth and prosperity. This may be the result of not enough democratic stock that has been accumulated (Gerring et al., 2005), weak institutionalization of the democratic game, or a short time span, in which human capital that parallels with democracy had time to develop. These are important areas of future work.
In sum, this article contributes to the debate on how and why democratization affects economic prosperity (e.g. Acemoglu et al., 2019; Doucouliagos and Ulubaşoğlu, 2008) by providing compelling evidence for a democratic dividend, including a large sample of countries between 1789 and 2019 with all three democratization waves and a vast battery of covariates. However, the exploration of spillover effects is an important area of future inquiry (e.g. Abramson and Montero, 2020), as well as dealing with measurement uncertainty of the point estimates from Fariss et al.'s GDP measures (2022) by using the raw measurement outputs.
Supplemental Material
sj-pdf-1-ias-10.1177_22338659231194945 - Supplemental material for Reanalysing the link between democracy and economic development
Supplemental material, sj-pdf-1-ias-10.1177_22338659231194945 for Reanalysing the link between democracy and economic development by Lars Pelke in International Area Studies Review
Footnotes
Data availability
Declaration of conflicting interests
The author declared no potential conflicts of interest with respect to the research, authorship, and/or publication of this article.
Ethical approval
This article does not contain any studies with human participants performed by any of the authors.
Funding
The author received no financial support for the research, authorship, and/or publication of this article.
Supplemental material
Supplemental material for this article is available online.
Notes
References
Supplementary Material
Please find the following supplemental material available below.
For Open Access articles published under a Creative Commons License, all supplemental material carries the same license as the article it is associated with.
For non-Open Access articles published, all supplemental material carries a non-exclusive license, and permission requests for re-use of supplemental material or any part of supplemental material shall be sent directly to the copyright owner as specified in the copyright notice associated with the article.