
Abstract
The intermittent work in soccer demands rapid changes in velocity and direction due to the unpredictable events that occur during match play. Hence, the players’ ability to accelerate and decelerate are important indicators for physical performance and load. It is common for elite teams to use inertial measurement units (IMU) to monitor the external training load, of which accelerations and decelerations are considered important variables. Accelerations and decelerations have traditionally been determined relative to a fixed threshold (e.g., >2.0 m·s−2). The aim of this study was to examine accelerations and decelerations in several zones (graded from low to high) in two different levels of sensitivity and in three different thresholds for determination of accelerations and decelerations. Thirty-five semi-professional soccer players were monitored with a foot-mounted IMU (Playermaker) during 60 official matches, where number- and meters of accelerations and decelerations were distributed from low to high in sensitivity level 1 (6 zones), sensitivity level 2 (3 zones), and three different thresholds for determination of accelerations and decelerations. Sensitivity and threshold are shown to influence positional differences when acceleration and deceleration values are relatively low but appear to be absent when the values are relatively high. High sensitivity leads to positional differences that are not present for low sensitivity, whereas low sensitivity polarizes differences between zones. For thresholds, the use of acceleration meters leads to greater positional differences compared to number of accelerations. These findings should be considered in the interpretation of the data output and in decisions regarding training load management.
Highlights
Sensitivity and threshold influence positions when acceleration and deceleration values are low, but not for higher values.
Low sensitivity polarizes differences between zones.
Measures of acceleration and deceleration distance leads to greater positional differences compared to the use of counts.
Introduction
Competitive soccer match-play demands execution of a great amount of high-speed running and explosive changes of direction. The intermittent nature of the game makes it physiologically demanding, due to the time spent at different speed intervals and a large amount of both repeated and discrete high-intensity actions, such as accelerations (Djaoui et al., 2022; Stølen et al., 2005). In addition to the more traditional measures of total running distance and running distances in different velocities, accelerations are important variables for evaluation of external training load in soccer (Dalen et al., 2016; Delves et al., 2021). Acceleration is defined as the rate of change in velocity over time. In the context of athletic performance, an increase in velocity is typically categorized as acceleration, whereas a decrease in velocity is described as deceleration. Both the ability to rapidly accelerate and decelerate are considered important components of physical performance in soccer (Delves et al., 2021; Silva et al., 2023a), with the latter being a key element in the ability to change direction (Akenhead et al., 2013; Chaouachi et al., 2012). The ability to accelerate and decelerate are considered important components of physical performance in soccer (Delves et al., 2021; Silva et al., 2023a). Team sports researchers and practitioners monitor accelerations and decelerations during both training and matches to quantify training load, injury prevention, and performance enhancement, and the capacity to change direction quickly and efficiently, through accelerations and decelerations, is associated with physical performance in soccer (Delves et al., 2021; Ellens et al., 2022).
Match analyses conducted by Rampinini et al. (2007) suggest that the frequent accelerations inherent to soccer may contribute substantially to the physiological load observed during match play, relative to the mean running intensity reported (Rampinini et al., 2007). Even when the initial velocity is relatively low, it has been reported that a high mechanical load is imposed when a player is increasing their speed (Osgnach et al., 2010). The initial velocity of the players’ influences accelerations and decelerations, where low initial velocity will lead to greater accelerations among the players, compared to when the initial velocity is higher (Sonderegger et al., 2016). Previous studies have reported that players perform on average ∼1 acceleration per minute of play during 90 min of play, with twice as many in the most intense periods of the match (Dalen et al., 2019; Dalen et al., 2021). Earlier studies have reported that accelerations and decelerations contribute to a significant share of the total workload during a match and should therefore be considered important variables (Dalen et al., 2016, 2021). More accelerations occur in the spectrum of low to moderate intensities than decelerations (Harper et al., 2019). This distribution may be influenced by the physiological capacity for force production; specifically, muscles can generate higher force during eccentric contractions compared to concentric contractions, allowing for high-intensity decelerations to occur more abruptly than accelerations. Furthermore, this difference is a feature of match play, where acceleration to higher running speeds often occurs gradually, without necessarily crossing a defined high-intensity threshold. On the other hand, a larger part of the decelerations will be more intense, and thus force faster speed reductions within limited time and space (Damian James and John, 2018). Therefore, acceleration and deceleration will impose distinctive and different internal physiological and mechanical load requirements on players (Harper et al., 2019; Vanrenterghem et al., 2017). Accelerations will, for example, have a higher metabolic cost, whereas decelerations will have a higher mechanical load (Dalen et al., 2016; Hader et al., 2016; Harper et al., 2019). Rapid changes of velocity demand anaerobic contribution from the alactic system, where both concentric and eccentric muscle contractions lead to an increased risk of muscle damage and physiological stress among the players (Buchheit et al., 2010; Van Winckel, 2014).
To capture these dynamics, quantification of accelerations and decelerations is typically being collected by using sport tracking devices, aiming to better understand the physical game demands (Carling et al., 2008; Randers et al., 2010). The external loads from accelerations and decelerations have been investigated using various tracking systems, where GPS (global positioning system), LPS (local positioning system), and IMU (inertial measurement unit) devices are the most used in such studies (Ingebrigtsen et al., 2015). A deeper understanding of the physical demands provides better prerequisites to individualize the planning of training sessions based on objective measurements and positional differences, knowing that a drop in the frequency of accelerations and decelerations is an indicator of fatigue, while the total number of these actions reflects the mechanical load players are exposed to (Akenhead et al., 2013; Arruda et al., 2015). Vigh-Larsen et al. (2018) investigated the position-specific acceleration and deceleration profiles in elite youth and senior soccer players and reported that players in wide positions perform more accelerations and decelerations compared to players in central positions, with central defenders performing the lowest number of all positions. Similar positional characteristics on acceleration and deceleration profiles are reported from studies conducted by Dalen et al. (2016) and Ingebrigtsen et al. (2015).
Fitness coaches in high-level clubs consider accelerations as the most used variable in player monitoring (Akenhead and Nassis, 2016). Relatively small changes in speed can make a great impact on the total load among the players (Osgnach et al., 2010), and therefore there is a need for a more comprehensive investigation of the physical and mechanical load that actually occurs as a result of accelerations and decelerations. In training load management, it is important to have the methodological knowledge of how accelerations and decelerations are registered, knowing that the data collection does not comprise a continuous time series, but rather depends on fixed values for zones, ranging from low to high (Ellens et al., 2022; Harper et al., 2019). The existing literature is quantifying accelerations and decelerations by counts and/or meters (Dalen et al., 2016; Djaoui et al., 2022), which makes the threshold for determination and the minimum effort duration (MED) of accelerations and decelerations essential in the analysis. MED establishes the minimum duration (e.g., 0.5 s) a change in velocity must exceed to be counted as an acceleration or a deceleration (Delves et al., 2021; Varley et al., 2017). Silva et al. (2023b) reported that soccer players reach their peak accelerations between 0.5–1.3 s and peak decelerations between 0.1–0.3 s. Previous studies (Dalen et al., 2021; Ingebrigtsen et al., 2015; Mara et al., 2017; Sandmæl and Dalen, 2023; Vigh-Larsen et al., 2018) have typically used fixed thresholds to identify and quantify accelerations and decelerations (e.g., >2 m·s−2). To assess the mechanical load, there is a need for a more accurate description of how changes in speed are distributed from low to high, and not only if the changes in speed are over or under a fixed threshold. This distribution is typically achieved by categorizing efforts into various zones, which represent specific intensity brackets of speed change. In this manuscript, sensitivity refers to the level of detail in this categorization. High sensitivity involves a finer division of the intensity spectrum into more zones (e.g., 6 zones), providing a more nuanced view of the player's profile. In contrast, low sensitivity uses fewer and broader zones (e.g., 3 zones) to categorize the same underlying acceleration data. Understanding how the number of zones and their thresholds influence data interpretation is crucial for consistent training load management.
The aim of this study was to examine accelerations and decelerations in several zones (graded from low to high) in two different levels of sensitivity and with three different thresholds for determination of accelerations and decelerations. The objective was to explore both if higher sensitivity provides a better view on the distribution of accelerations and decelerations for the players and how changes in fixed thresholds for determination of accelerations and decelerations affects positional acceleration and deceleration profiles. Insight into both number- and meters of accelerations and decelerations is provided, which may aid in achieving a more holistic understanding. It was hypothesized that a higher level of sensitivity and higher threshold levels would evoke greater differences between playing positions.
Methods
Design
To investigate the physical load among the players, velocity-based metrics were analyzed in official competitive matches during two consecutive seasons in a semi-professional soccer team. A descriptive, comparative design was used, and for measuring accelerations and decelerations during matches, the players wore a foot-mounted IMU. Each player had one unit attached to each of their shoes, which was held by a tight custom silicon strap, where the sensor was located on the lateral aspect of the calcanei (Waldron et al., 2021). The IMU system (Playermaker, Tel Aviv, Israel) measures at 1000 Hz and the sensor consists of a tri-axial accelerometer and a tri-axial gyroscope (MPU-9150, InvenSense, California, USA). These sensors measure linear acceleration and angular velocity, from which velocity and changes in velocity are subsequently derived for each foot while in motion.
Participants
The data set includes 60 official league matches from a Norwegian first division (2nd level) team. The players’ accelerations and decelerations were measured and only players playing ≥ 45 min in a match were included in the study (total number of observations=566). All matches were played on artificial surface. A total of 35 male soccer players participated in the study (mean ± standard deviation (SD) age 24.9 ± 3.5 years, body mass 76.0 ± 3.9 kg, body height 180.8 ± 5.2 cm), consisting of 5 central defenders (CD, n = 102), 6 fullbacks (FB, n = 107), 8 central midfielders (CM, n = 152), 8 wide forwards (WF, n = 113), and 4 center forwards (CF, n = 66). Informed consent was obtained from all participants involved in the study. The study was conducted according to the Declaration of Helsinki and approval was granted by the Norwegian Agency for Shared Services in Education and Research (ref: 518013).
Procedures
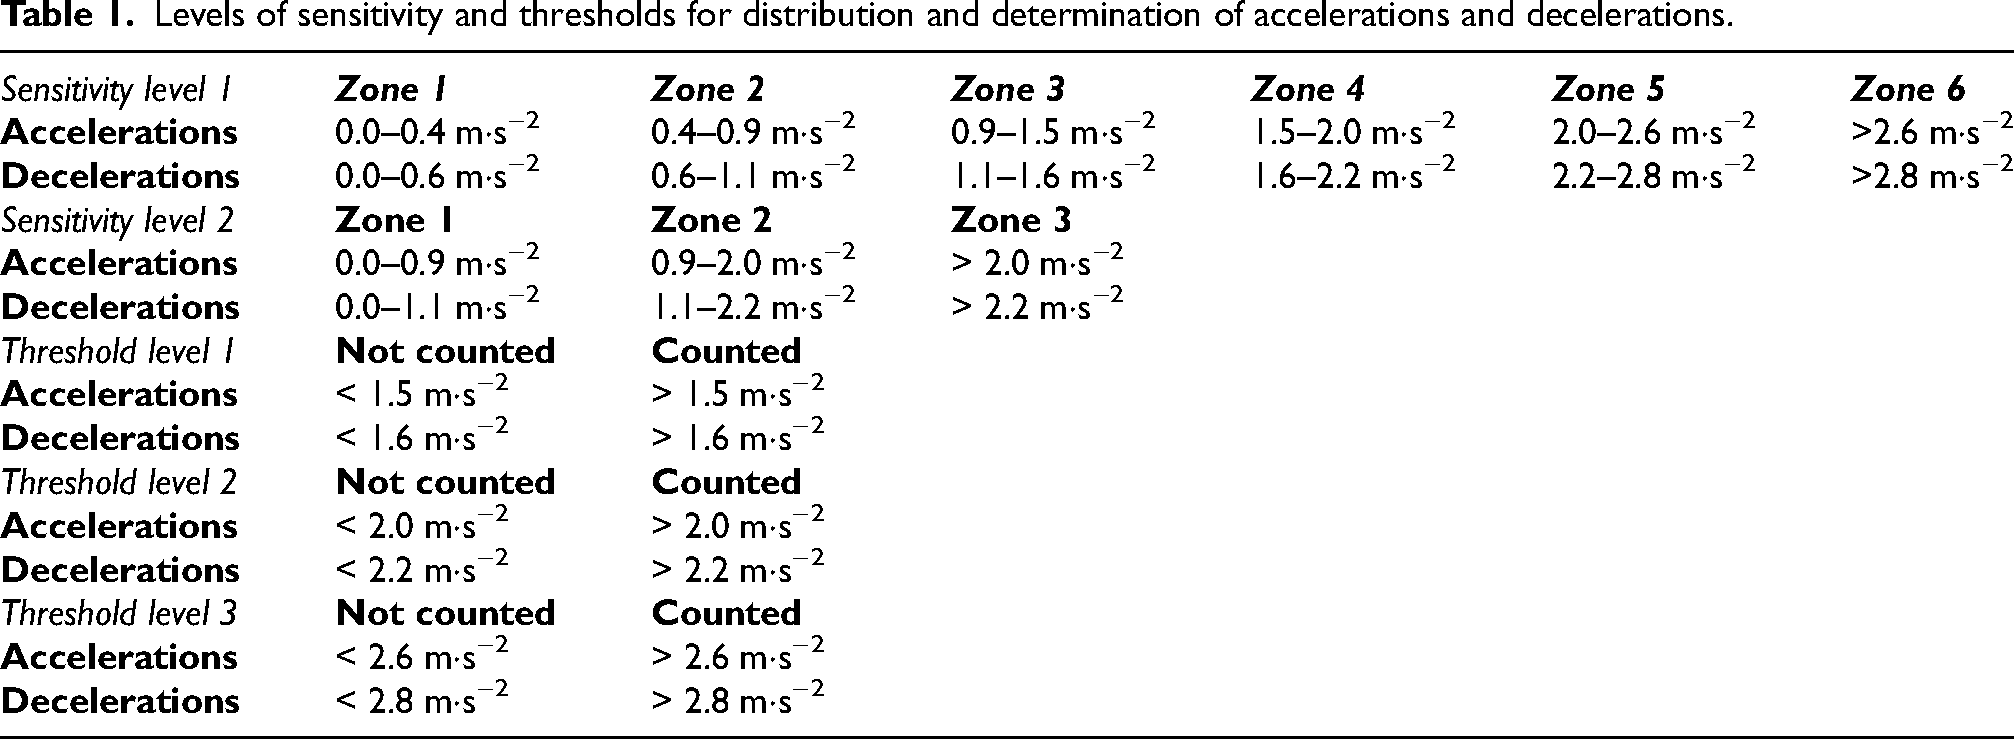
The IMU system calculates velocity-based metrics by utilization of a combination of gait tracking and foot-based event detection algorithms. The processor receives accelerometer and gyroscope data from which orientation, velocity, and position vectors are determined utilizing a Kalman filter. Accelerations and decelerations were determined using a MED of 0.3 s, which corresponds to Varley et al. (2017). The F-IMU system has shown good validity for instantaneous velocity during rapid changes of direction (Myhill et al., 2023), which serves as the basis for calculating acceleration and deceleration metrics. The data output was produced as quantity and distance in the different zones. Number of accelerations (Acc#), meters of accelerations (Accm), number of decelerations (Dec#), and meters of decelerations (Decm) were measured and categorized in zones graded from low to high in two different levels of sensitivity and three different thresholds (Table 1). The specific acceleration and deceleration thresholds were selected based on the default settings of the manufacturer's software and the established monitoring protocols of the participating club. This choice was made to ensure the findings carry high ecological validity for practitioners who utilize these standard reporting zones in daily training load management. The acceleration and deceleration values were divided by the players’ playing time, meaning that the results are expressed as counts per minute and meters per minute, respectively. For practical purposes, all accelerations and decelerations are expressed as absolute values throughout the paper.
Levels of sensitivity and thresholds for distribution and determination of accelerations and decelerations.
Statistics
To determine the effect of zones and playing position on accelerations and decelerations, linear mixed models with random intercept terms were fitted separately for the dependent variables (Accm, Decm, Acc#, Dec#) for each of the different levels of sensitivity (6 zones, 3 zones) as well as for the comparison between different thresholds, using maximum likelihood estimation. Zones and position were entered as fixed factors, whereas game number was entered as a random factor to control for the longitudinal effect of the likely correlation between successive games. Since the order of opponent and location (home/away) was inherently random (dictated by league schedules), between-team confounding was not deemed an issue. To model the potential temporal dependence of successive games due to e.g., fatigue, learning, or fitness changes, a first order autoregressive covariance structure was chosen (assumes an exponentially decaying correlation). A Wald test was used to test the need to account for temporal dependence, which was supported in all but 2 models, as indicated by the significant outcomes (Table 2). Due to the sample size, normality of residuals (Cheng et al., 2010) was assessed visually with histograms and Q-Q plots. The data for sensitivity level 1 and 2 showed signs of being leptokurtic. However, the tails only comprised a very small relative number of values and the main body of the data was centered in the middle around the expected values. Since linear mixed models have demonstrated strong robustness against violations of distributional assumptions (Schielzeth et al., 2020) and the sample size was very large, this was not deemed severe enough to threaten the robustness of the models and preclude interpretation of the results. In extension, non-integer acceleration and deceleration counts per minute were analyzed with linear mixed models rather than a Poisson distribution model, due to the latter's high sensitivity to violations of assumptions (Knief and Forstmeier, 2021), in an effort to obtain less biased outcomes.
Estimates of the temporal dependence of game with 95% confidence interval (CI) as well as overall adjusted intraclass correlation coefficient (ICC) for all linear mixed models (combinations of dependent variable and zone threshold division) with a first order autoregressive covariance structure.

SL1 = sensitivity level 1 (6 zones), SL2 = sensitivity level 2 (3 zones), TL = threshold level. Acc = acceleration, Dec = deceleration. # = counts; m = meters.
Rho represents the correlation between adjacent measurements.
If a significant interaction effect between zones and position was present, simple effects analysis was conducted (effect of position per zone), with a Bonferroni correction for multiple comparisons. For each model, effect size (Cohen's d) was calculated as the difference in estimated marginal means between two positions at a given zone, divided by the SD derived from the standard error (SE · √n). Effect sizes were interpreted according to Cohen (1988) as trivial <0.2, small ≥0.2, moderate ≥0.5, and large ≥0.8. All statistical analyses were performed in SPSS version 29.0.1.1 (IBM Corporation, Armonk, NY, USA). The level of statistical significance was set at α = .05.
Although model comparison with the intent of finding the best model was not of interest, as a formality, the fit of unconditional models (intercept only) compared with full models was assessed with chi-square tests using Schwarz's Bayesian Criterion (BIC). All full models showed a highly significant improvement on their respective null models (mean ± SD χ2 change = 7486.2 ± 3394.7, range = 4407.2–14014.4, critical value range at p < .001 = 39.3–61.1).
Results
Despite great similarity in pattern across zones for all positions (Figure 1), statistically significant interactions between position and zone were observed for all variables and both sensitivity levels and thresholds (all p < 0.001). Hence, simple effects analysis was conducted. A complete overview of the results is shown in Appendix Tables A1–A4.

Interaction between positions and zones in two different levels of sensitivity and three threshold levels.
For Acc# in sensitivity level 1 (6 zones), CF measured higher in zone 1 than all other positions, while FB measured higher than WF. CD and FB both measured higher in zone 2 compared to WF, and FB and CM measured higher in zone 3 compared to WF. No differences between positions were observed for zones 4–6 (Figure 2A). Acc# in sensitivity level 2 (3 zones) showed that CD and FB measured higher in zone 1 than WF, while CF measured higher compared to CM and WF. FB and CM measured higher in zone 2 than WF. No differences between positions were observed in zone 3 (Figure 2C). Finally, no differences between positions were observed for threshold levels 1–3 (Figure 4A).

Distribution of accelerations in two different levels of sensitivity.
For Accm in sensitivity level 1, CD measured lower than any other positions in zone 1, while CM, WF, and CF measured higher compared to FB. CD measured lower in zone 2 than all other positions, while CM measured higher compared to FB and WF. Also, CD measured lower in zone 3 compared to all other positions. In zones 4 and 5, no differences between positions were identified, while in zone six, WF measured higher than CM (Figure 2B). Accm in sensitivity level 2 showed that CD measured lower in zone 1 than all other positions, while CM, WF, and CF measured higher than FB. CM and WF measured higher in zone 2 compared to CD. No differences between positions were observed in zone 3 (Figure 2D). In threshold level 1, WF and CF measured higher Accm than CD and CM, while WF and CF measured higher compared to CM in threshold level 2. No differences between positions were observed in threshold level 3 (Figure 4B).
For Dec# in sensitivity level 1, CD, FB, and CF measured higher in zone 1 than CM and WF, while CD measured higher in zone 2 compared to FB, CM and WF. No differences between positions were observed for zones 3–6 (Figure 3A). Dec# in sensitivity level 2 showed that CD, FB, and CF measured higher in zone 1 than CM and WF. No differences between positions were observed for zones 2 and 3 (Figure 3C). In threshold level 1, FB measured higher Dec# compared to CD and WF. No differences between positions were observed in threshold level 2 and 3 (Figure 4C).

Distribution of decelerations in two different levels of sensitivity.

Determination of accelerations and decelerations with three different thresholds.
For Decm in sensitivity level 1, CD measured lower in zone 1 than all other positions, while CM, WF, and CF measured higher than FB, and CM higher than CF. CM measured higher in zone 2 than CD and FB. No differences between positions were observed for zones 3–6 (Figure 3B). Decm in sensitivity level 2 showed that CM, WF, and CF measured higher in zone 1 compared to CD and FB. No differences between positions were observed for zones 2 and 3 (Figure 3D). In threshold level 1, FB, CM, WF and CF measured higher Decm than CD. WF and CF also measured higher than CM (Figure 4D). In threshold level 2, WF and CF measured higher than CD. No differences between positions were observed in threshold level 3 (Figure 4D).
Discussion
The aim of this study was to examine accelerations and decelerations in several zones (graded from low to high) in two different levels of sensitivity and with three different thresholds for determination of accelerations and decelerations. In general, sensitivity and threshold influence positional differences when acceleration and deceleration values are relatively low, but the effect appears to be absent when the values are relatively high. High sensitivity (6 zones) leads to positional differences that are not present for low sensitivity (3 zones), whereas low sensitivity polarizes differences between zones. For thresholds, the use of distance leads to greater positional differences compared to counts.
For Acc#, the findings imply that higher levels of sensitivity are not necessary to nuance positional differences when the acceleration exceeds 2.0 m·s−2. Positional differences in zone 3 in sensitivity level 1 (0.9–1.5 m·s−2) is identical with zone 2 in sensitivity level 2 (0.9–2.0 m·s−2) and occurs because of positional differences in the lower half, based on no observed differences in zone 3 in sensitivity level 1 (1.5–2.0 m·s−2). CF were significantly higher compared to all other positions in zone 1 in sensitivity level 1 (0.0–0.4 m·s−2), but showed no differences compared to other positions in zone 2 (0.4–0.9 m·s−2). On the other hand, CF showed no differences compared to CD and FB in zone 1 for sensitivity level 2 (0.0–0.9 m·s−2). This may indicate that lower sensitivity is leveling out differences between some positions within the zones, but at the same time emphasizes the differences between the zones.
Furthermore, the findings showed no positional differences in any of the thresholds for determination, which is conflicting with previous studies reporting positional differences when number of accelerations were determined with a threshold above 2 m·s−2 (Dalen et al., 2021; Vigh-Larsen et al., 2018). A possible cause may be differences in measuring devices, and with that differences in MED. The current study used a MED of 0.3 s, whereas other studies have used 0.5 s (Dalen et al., 2019; Vigh-Larsen et al., 2018). This study may therefore potentially count more accelerations compared to some previous studies, and thus not differentiate between positions. Another reason may be differences in the positional demands, where some positions facilitate accelerations and decelerations that are sustained over a longer time window. Also, the positional features may provide different conditions for the initial velocity, which influences the size of the accelerations performed (Sonderegger et al., 2016).
For Accm, the findings imply that higher levels of sensitivity are not necessary to nuance positional differences when accelerations exceed 2.0 m·s−2. CD were significantly lower than all other positions in zone 1 (0.0–0.4 m·s−2), 2 (0.4–0.9 m·s−2), and 3 (0.9–1.5 m·s−2) in sensitivity level 1, while no positional differences were observed in higher zones. Also, CM were higher than all other positions in zone 2. Observed effect sizes (Appendix Table A1) imply that effect of position seems to decrease when accelerations increase, which is based on mostly large effect sizes in zone 1 (0.43–1.01), moderate in zone 2 (0.23–0.69), and small in zone 3 (0.25–0.32). CD were significantly lower than all other positions when accelerations were below 0.9 m·s−2 regardless of sensitivity level, while zone 1 (0.0–0.9 m·s−2) in sensitivity level 2 seems to level out differences between CM and both WF and CF. Zone 2 (0.9–2.0 m·s−2) in sensitivity level 2 showed no differences between CD, FB, and CF, hence sensitivity level 2 seems to level out differences between positions from sensitivity level 1. Sensitivity level 2 seems to polarize the effect of position, which is based on large effect sizes observed in zone 1, where only trivial effects sizes (0.19–0.20) were observed in zone 2. Therefore, positional demands and/or individual capacities do not seem to be decisive in differentiating between positions in the highest zones. As a solution, the zones used in the current study could have been heightened or supplemented with higher zones, so that the players’ physical capacities would be an increasingly decisive factor and potentially provoke positional differences. Other studies have previously used 3.0 m·s−2 as a cut-off value for accelerations and decelerations (Djaoui et al., 2022; Osgnach et al., 2010), which could have been beneficial in this study.
Additionally, the findings showed that WF and CF measured greater values of meters of accelerations compared to other positions for thresholds for determination above 1.5 m·s−2 and 2.0 m·s−2, contrary to the findings of number of accelerations, where no differences between positions were found. A likely explanation might be that number of accelerations are measured at a nominal level (counted/not counted) while meters are measured at interval level, meaning that accelerations above the threshold potentially differentiate more when measuring distance of meters compared to when only measuring the number of times above the threshold. However, no differences between positions were observed for determination above 2.6 m·s−2. The lack of differences in the highest zones and threshold could mean that > 2.6 m·s−2 is not sufficiently high to provoke positional differences among the players, despite higher levels of sensitivity. The lack of differences may imply that the thresholds do not distinguish players based on their capacity, but rather is reachable for any players to enter. This assumption is supported by a previous study from Djaoui et al. (2022), where positional differences in meters covered in accelerations above 3.0 m·s−2 were observed.
For Dec#, the findings imply that higher levels of sensitivity are not necessary to nuance positional differences when decelerations exceed 1.1 m·s−2. Positional differences in Zone 1 in sensitivity level 2 (0.0–1.1 m·s−2) are identical with zone 1 in sensitivity level 1 (0.0–0.6 m·s−2), with differences between CD and all other positions from zone 2 in sensitivity level 1 seemingly having been leveled out. A higher level of sensitivity will therefore identify that CD is significantly higher than all other positions for decelerations between 0.6–1.1 m·s−2. Furthermore, FB measured a higher number of decelerations compared to CD and WF for thresholds for determination above 1.6 m·s−2, while no positional differences were found for thresholds for determination above 2.2 m·s−2 or 2.8 m·s−2. The findings are contrary to Vigh-Larsen et al. (2018), who observed positional differences for decelerations above 2 m·s−2. However, differences in measuring devices, MED, and applied thresholds between the studies should be taken into consideration as a possible explanation.
For Decm, the findings imply that higher levels of sensitivity are not necessary to nuance positional differences when decelerations exceed 1.1 m·s−2. Zone 1 in sensitivity level 2 (0.0–1.1 m·s−2) is leveling out differences between CD and FB, and CM and CF from zone 1 in sensitivity level 1 (0.0–0.6 m·s−2). The effect of positions seems to decrease when decelerations increase. This assumption is based on mostly moderate to large effect sizes (0.23–0.74) observed for positional differences in zone 1 in sensitivity level 1 and small effect sizes (0.26–0.28) observed for positional differences in zone 2 (Appendix Table A1). Additionally, WF and CF measured greater values of meters of decelerations compared to CD and CM for threshold for determination above 1.6 m·s−2, while WF and CF measured higher than CM for threshold for determination above 2.2 m·s−2. Like accelerations, decelerations provide more positional differences when the unit of measure is in meters compared to counts, and it is plausible that also in this case, measuring distance at interval level will highlight greater differences compared to measuring number of decelerations at a nominal level. Meters of decelerations did not show any positional differences for the highest threshold of 2.8 m·s−2, which is consistent with findings throughout this study for all variables. The finding contrasts with Djaoui et al. (2022) who observed positional differences in meters covered in decelerations above 3.0 m·s−2. It should therefore be considered whether also meters of decelerations should have increased thresholds or been supplemented with higher thresholds to provoke positional differences.
Practical applications
Coaches in high level clubs consider accelerations as the most used variable in training load management (Akenhead and Nassis, 2016) and, as previously explained, accelerations and decelerations have traditionally often been determined relative to a fixed threshold (e.g., > 2.0 m·s−2). The zones and thresholds in this study are commonly used in the field and were adopted to provide findings that were practice-oriented and familiar for coaches involved in training load management. The values used for determination of accelerations in this study are also similar to those used in previous studies on this topic (Dalen et al., 2019; Vigh-Larsen et al., 2018).
High sensitivity does not nuance positional differences for high acceleration and deceleration values, and hence argue in favor of lowering the sensitivity level, knowing that the coaches will receive the same information as a higher sensitivity level will provide, but at the same time the data analysis will be simplified and more time-efficient in their daily training load management. On the other hand, high sensitivity provides nuanced information for the lower acceleration and deceleration values, and coaches should consider whether it should be included. However, it could be questioned whether measuring accelerations and decelerations in the lowest zone is relevant in training load management. Naturally, the lowest zones provide the highest counts and meters of accelerations and decelerations, and Osgnach et al. (2010) have reported a certain amount of energy cost also in the lowest zones, which argues in favor of including the whole range of accelerations and decelerations in training load management. The quantity and time spent in the lowest zones will in sum be sizeable and should therefore be considered. Findings from this study therefore suggests that there might be a benefit in differentiating sensitivity levels between the high and low zones. As a practical consequence, coaches should consider retaining high level of sensitivity where positional differences were found in the lower zones and merge higher zones with no positional differences. Ultimately, selecting the most appropriate configuration depends on the practitioner's objective. For daily load monitoring, a simplified approach (low sensitivity) in the higher zones may be efficient, as it captures the necessary intensity without unnecessary complexity. Conversely, for performance assessment, a high level of sensitivity in the higher zones can be more suitable.
To ensure these findings are robust enough for practical implementation, it is worth noting the diversity of the data source. While the data originates from a single club, the study included a relatively large sample of 35 players and spanned a period with significant squad turnover and changes in coaching leadership. The inclusion of multiple head coaches and a diverse group of players over two seasons helps to buffer against the influence of a single tactical philosophy, although the findings should still be interpreted within the context of this specific semi-professional level.
Limitations and future research
The lack of differences in the highest zones and thresholds could mean that >2.6 m·s−2 for accelerations and >2.8 m·s−2 for decelerations are not sufficiently high to distinguish players based on their capacity and hence provoke positional differences among the players, but rather that they are reachable for any player to enter. Future research should include higher zones to see if positional differences become apparent. Additionally, the presence of individual differences in capacity along with different positional demands questions whether acceleration and deceleration thresholds should be individualized, as previously proposed by Sonderegger et al. (2016). High initial velocity is typically leading to low values of accelerations and high values of decelerations, hence conditions for accelerations and decelerations will differ between players.
Conclusion
Sensitivity and threshold influence positional acceleration and deceleration profiles when the values are relatively low, but not when the values are relatively high. Further, high sensitivity indicates positional differences that are not visible when sensitivity is low, whereas low sensitivity polarizes differences between zones. For thresholds, the use of distance leads to greater positional differences compared to the use of counts, which should be taken into consideration when evaluating positional data. Coaches are recommended to be aware of the effects of sensitivity and threshold values, together with different levels of measurement, when making decisions on training load
Footnotes
Ethics approval statement
The study was conducted according to the Declaration of Helsinki and approval was granted by the Norwegian Agency for Shared Services in Education and Research (ref: 518013).
Informed consent statement
Informed consent was obtained from all subjects involved in the study.
Funding
The authors received no financial support for the research, authorship, and/or publication of this article.
Declaration of conflicting interests
The authors declared no potential conflicts of interest with respect to the research, authorship, and/or publication of this article.
Data availability statement
The datasets generated and analyzed for this study can be requested by correspondence author at simen.r.sandmal@nord.no
Appendix
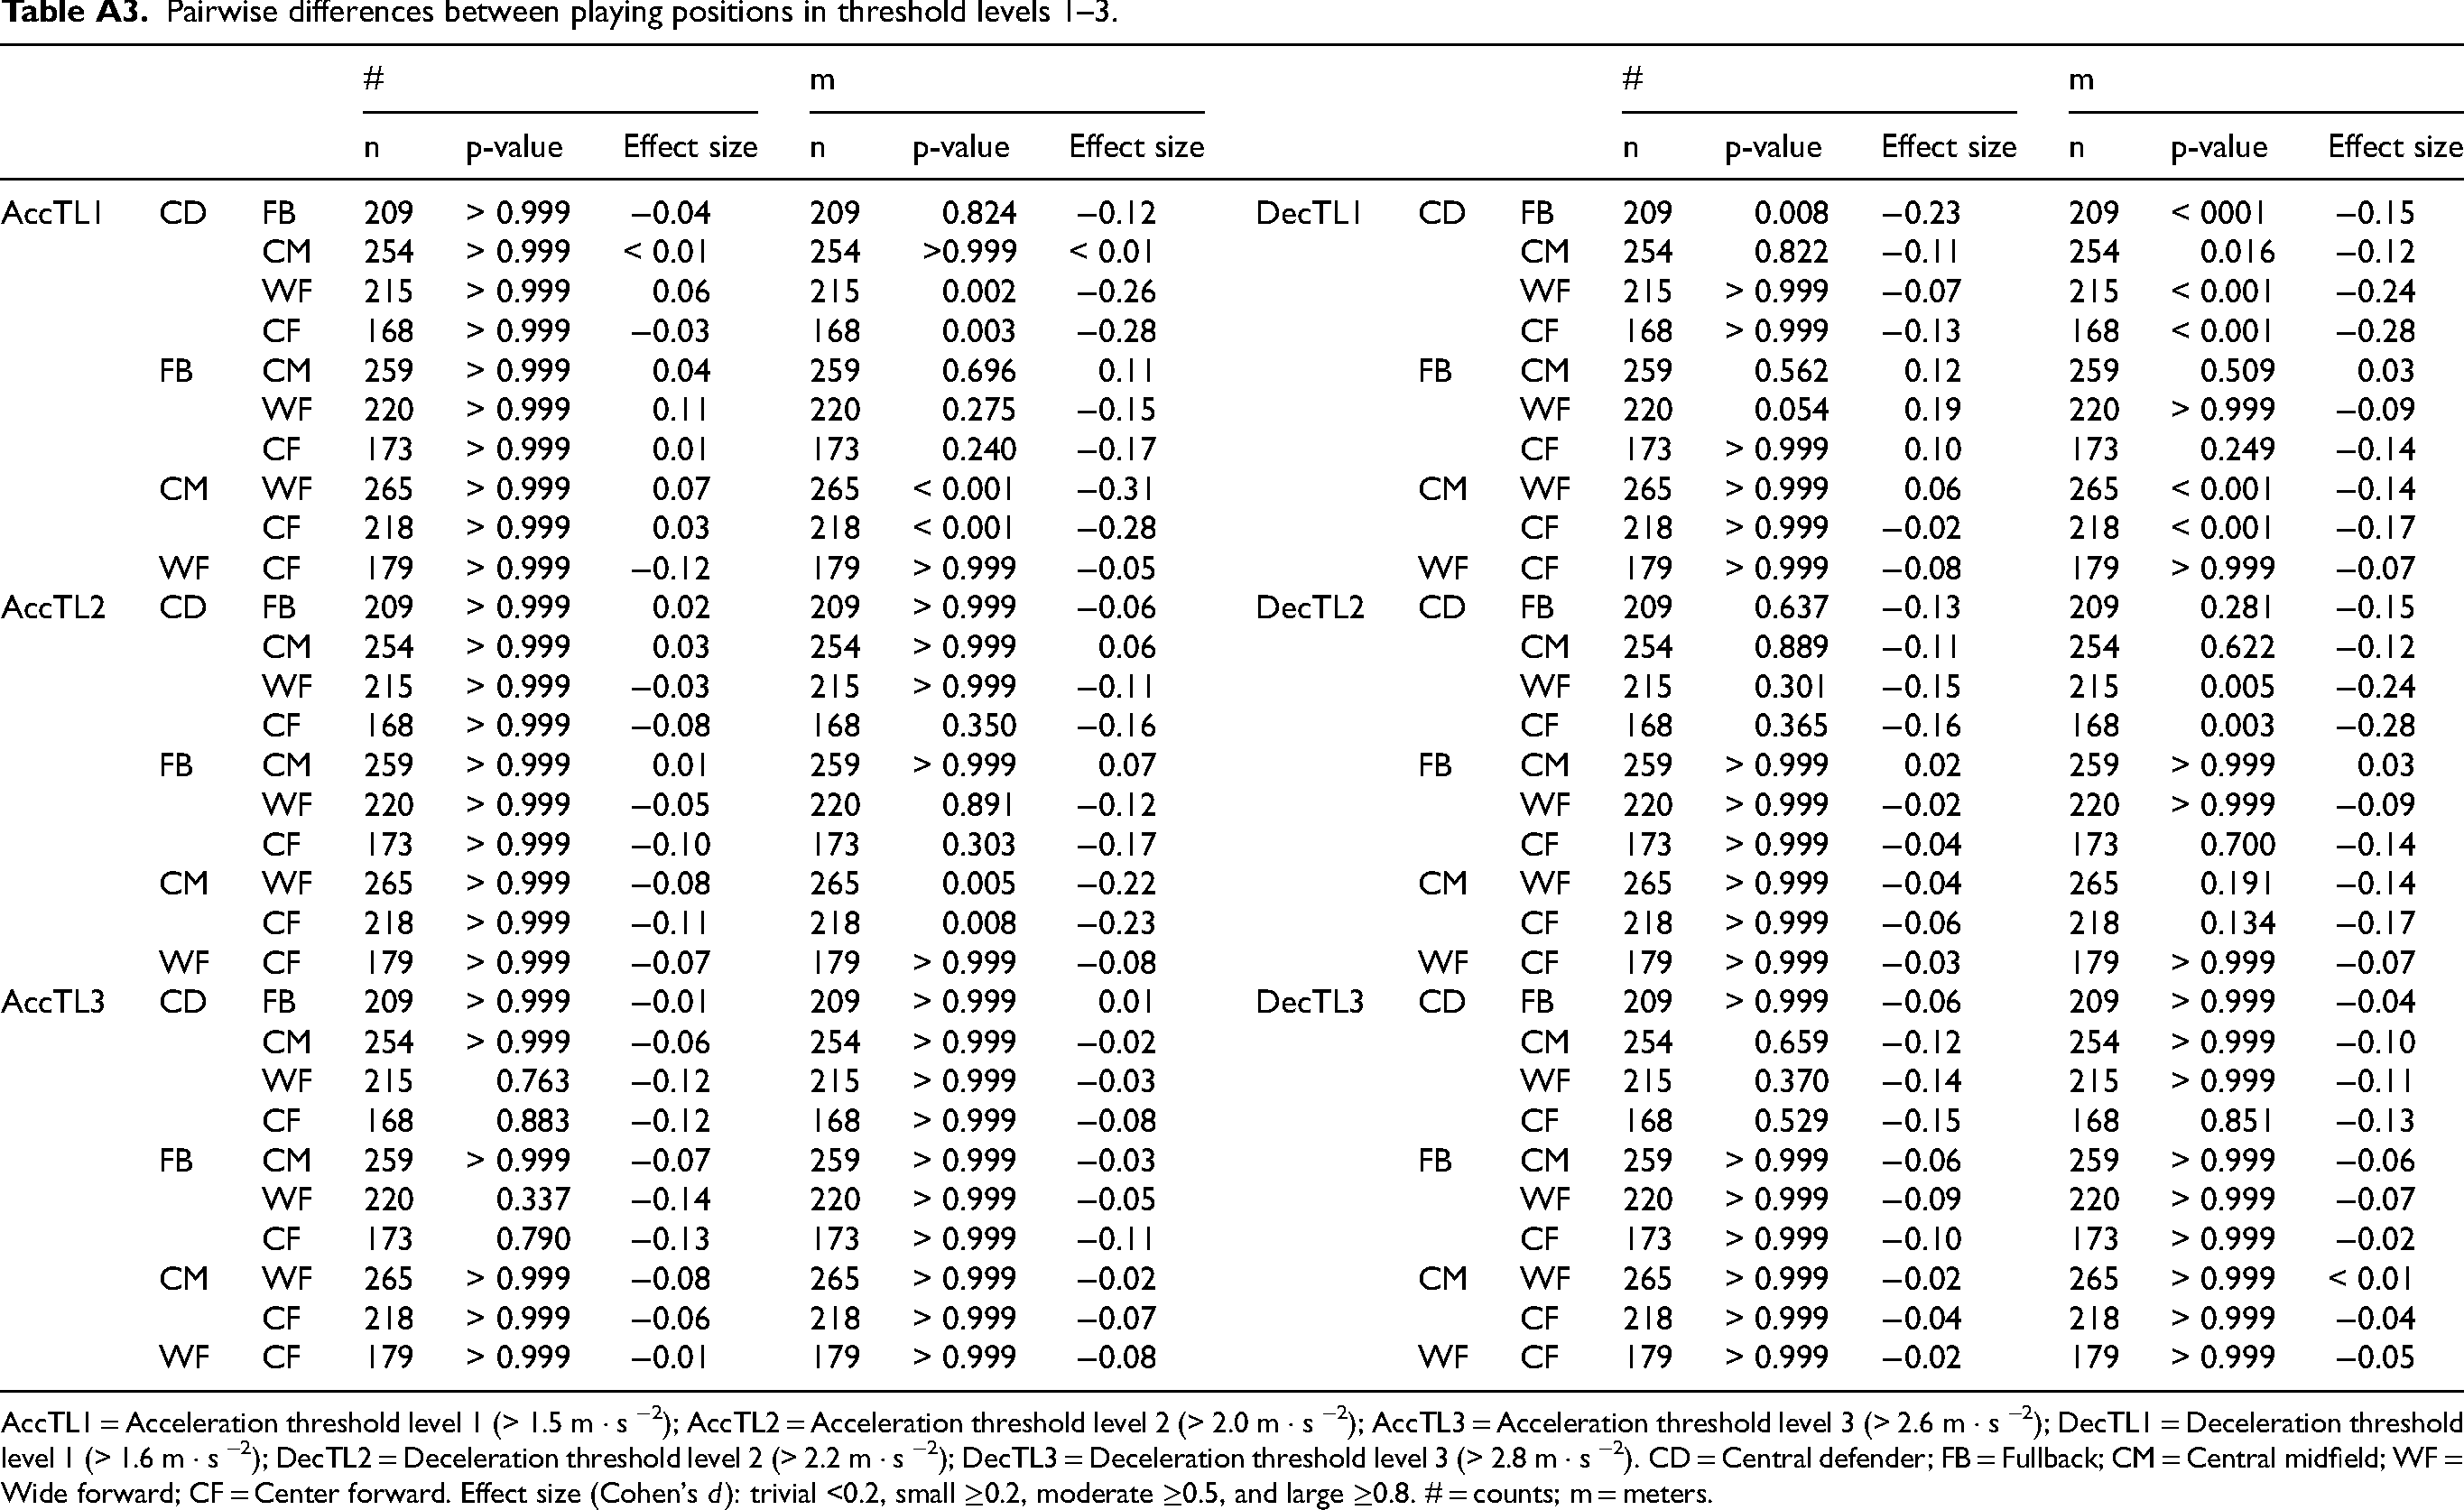
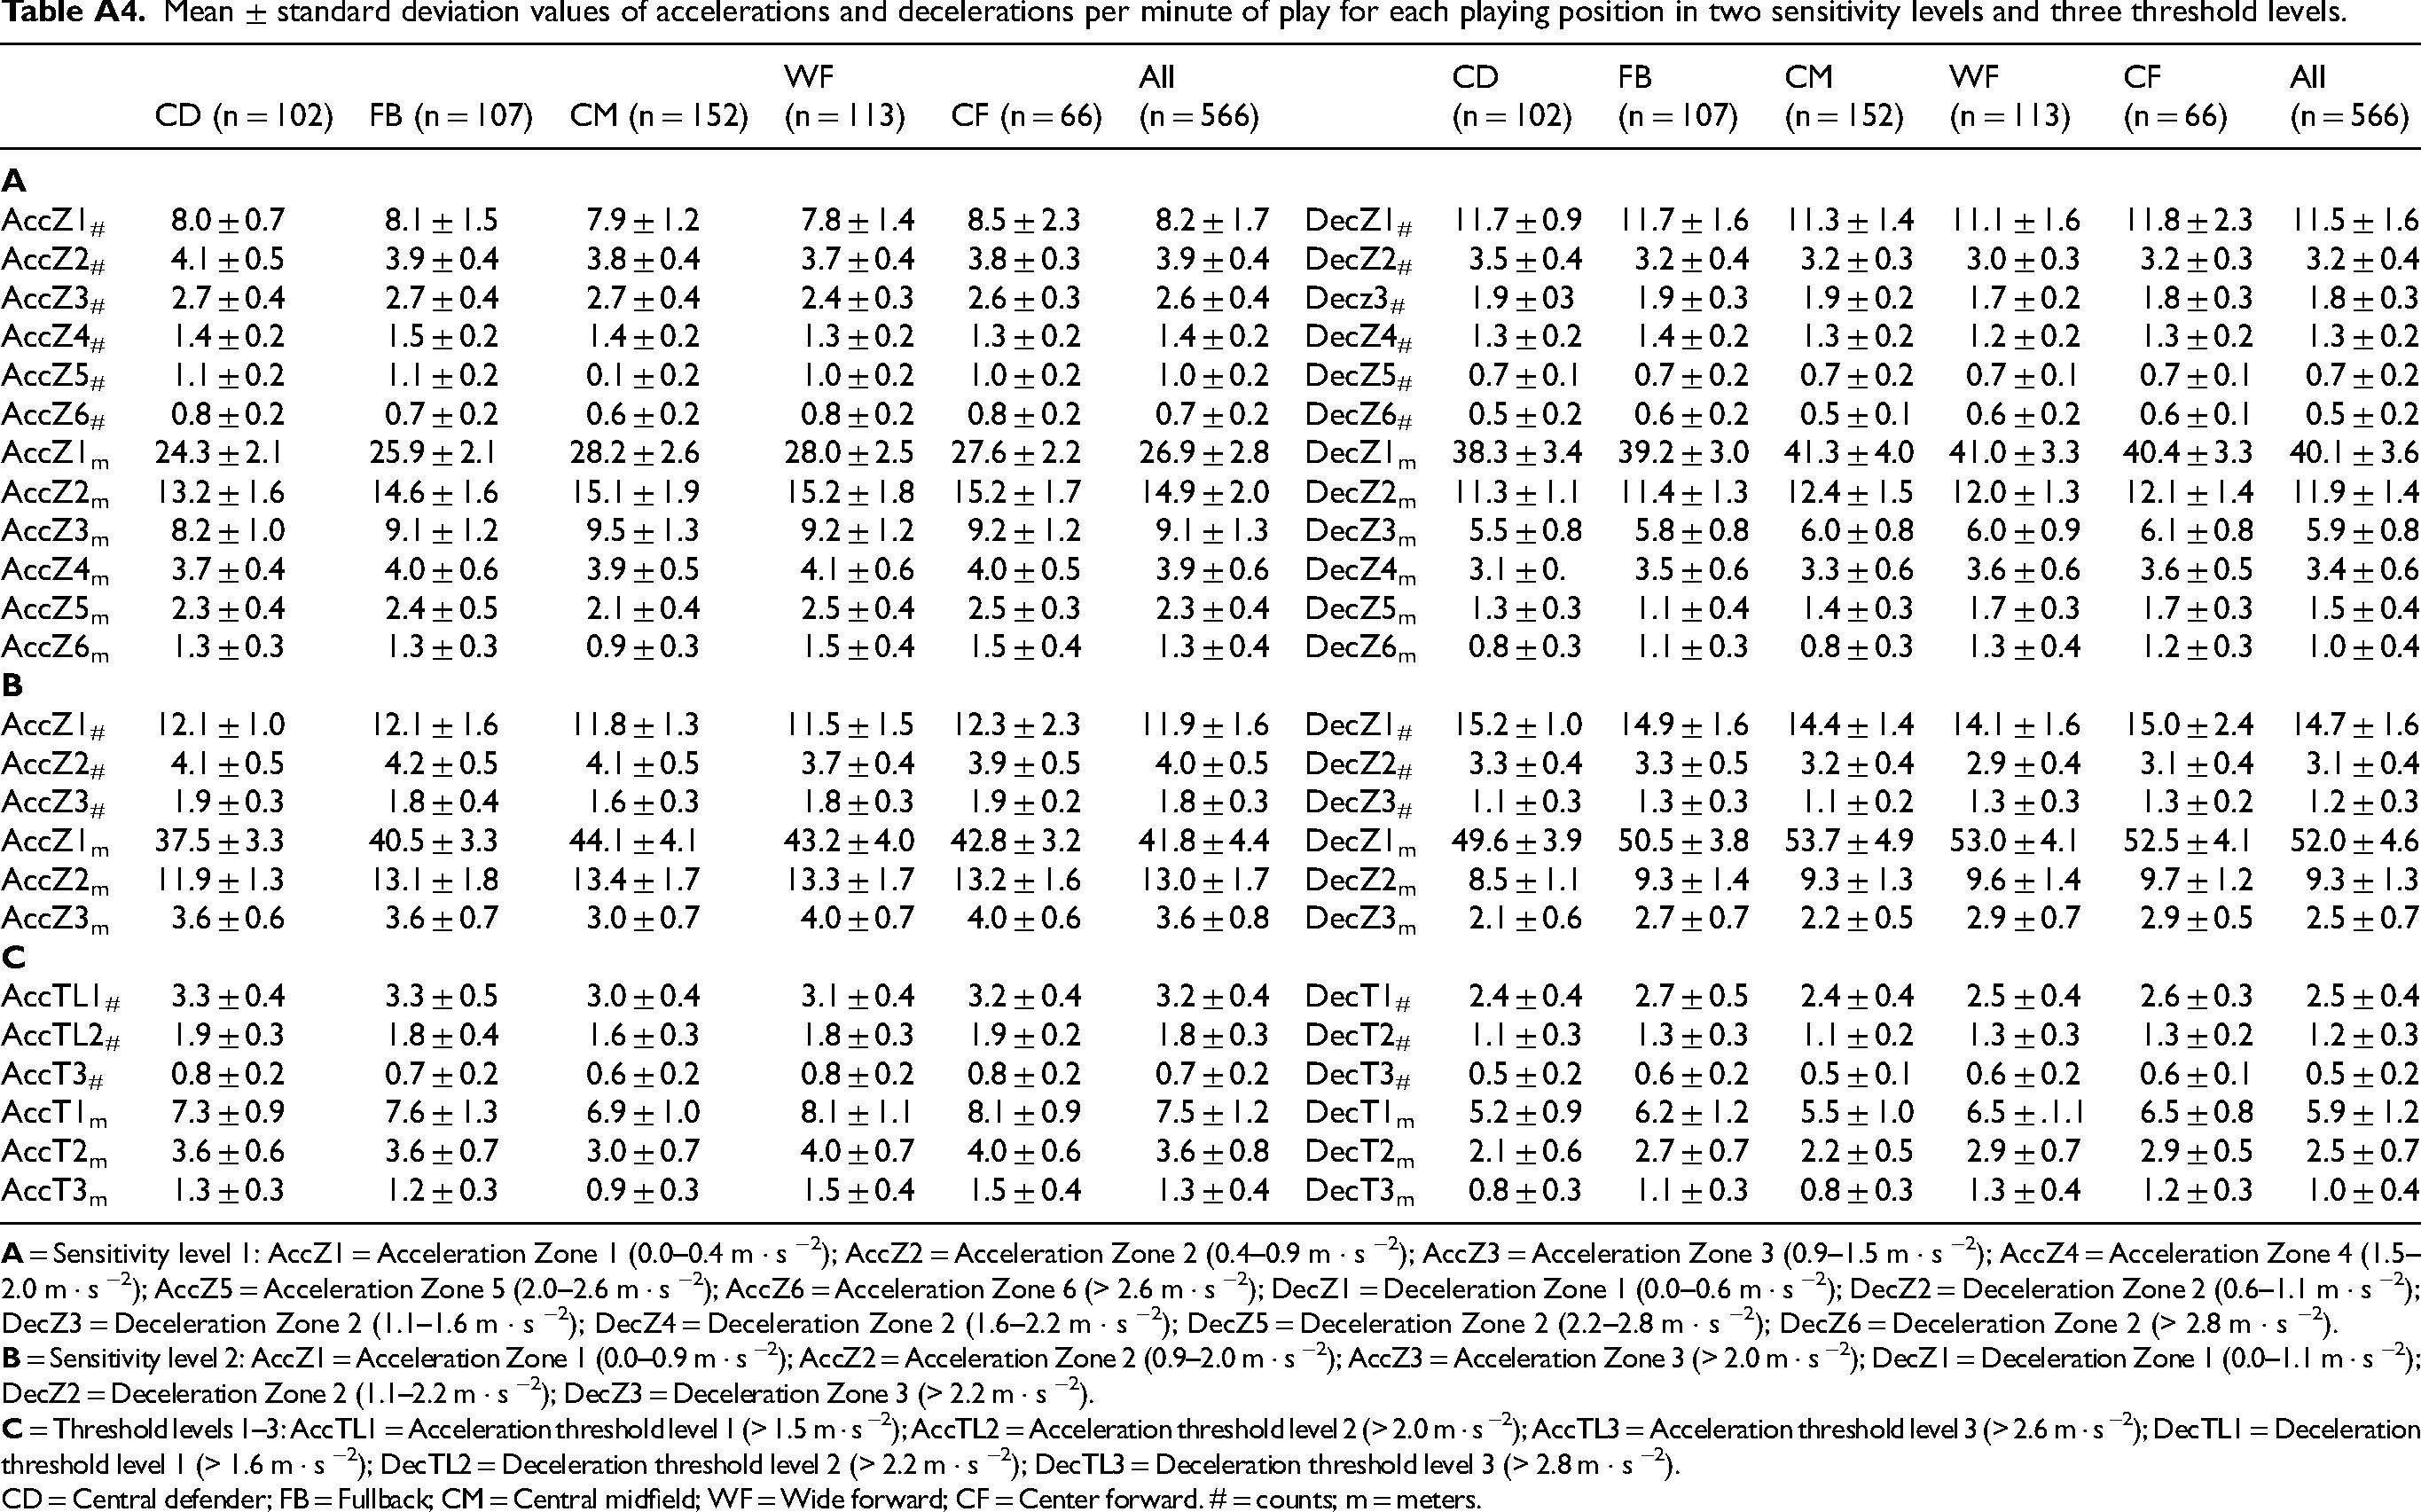
Pairwise differences between playing positions in sensitivity level 1. AccZ1 = Acceleration Zone 1 (0.0–0.4 m · s −2); AccZ2 = Acceleration Zone 2 (0.4–0.9 m · s −2); AccZ3 = Acceleration Zone 3 (0.9–1.5 m · s −2); AccZ4 = Acceleration Zone 4 (1.5–2.0 m · s −2); AccZ5 = Acceleration Zone 5 (2.0–2.6 m · s −2); AccZ6 = Acceleration Zone 6 (> 2.6 m · s −2); DecZ1 = Deceleration Zone 1 (0.0–0.6 m · s −2); DecZ2 = Deceleration Zone 2 (0.6–1.1 m · s −2); DecZ3 = Deceleration Zone 3 (1.1–1.6 m · s −2); DecZ4 = Deceleration Zone 4 (1.6–2.2 m · s −2); DecZ5 = Deceleration Zone 5 (2.2–2.8 m · s −2); DecZ6 = Deceleration Zone 6 (> 2.8 m · s −2). CD = Central defender; FB = Fullback; CM = Central midfield; WF = Wide forward; CF = Center forward. Effect size (Cohen's d): trivial <0.2, small ≥0.2, moderate ≥0.5, and large ≥0.8. # = counts; m = meters. Pairwise differences between playing positions in sensitivity level 2. AccZ1 = Acceleration Zone 1 (0.0–0.9 m · s −2); AccZ2 = Acceleration Zone 2 (0.9–2.0 m · s −2); AccZ3 = Acceleration Zone 3 (> 2.0 m · s −2); DecZ1 = Deceleration Zone 1 (0.0–1.1 m · s −2); DecZ2 = Deceleration Zone 2 (1.1–2.2 m · s −2); DecZ3 = Deceleration Zone 3 (> 2.2 m · s −2). CD = Central defender; FB = Fullback; CM = Central midfield; WF = Wide forward; CF = Center forward. Effect size (Cohen's d): trivial <0.2, small ≥0.2, moderate ≥0.5, and large ≥0.8. # = counts; m = meters. Pairwise differences between playing positions in threshold levels 1–3. AccTL1 = Acceleration threshold level 1 (> 1.5 m · s −2); AccTL2 = Acceleration threshold level 2 (> 2.0 m · s −2); AccTL3 = Acceleration threshold level 3 (> 2.6 m · s −2); DecTL1 = Deceleration threshold level 1 (> 1.6 m · s −2); DecTL2 = Deceleration threshold level 2 (> 2.2 m · s −2); DecTL3 = Deceleration threshold level 3 (> 2.8 m · s −2). CD = Central defender; FB = Fullback; CM = Central midfield; WF = Wide forward; CF = Center forward. Effect size (Cohen's d): trivial <0.2, small ≥0.2, moderate ≥0.5, and large ≥0.8. # = counts; m = meters. Mean ± standard deviation values of accelerations and decelerations per minute of play for each playing position in two sensitivity levels and three threshold levels. CD = Central defender; FB = Fullback; CM = Central midfield; WF = Wide forward; CF = Center forward. # = counts; m = meters.
#
m
#
m
n
p-value
Effect size
n
p-value
Effect size
n
p-value
Effect size
n
p-value
Effect size
AccZ1
CD
FB
209
> 0.999
−0.08
209
< 0.001
−0.40
DecZ1
CD
FB
209
> 0.999
0.02
209
0.006
−0.24
CM
254
> 0.999
0.05
254
< 0.001
−0.87
CM
254
< 0.001
0.32
254
< 0.001
−0.73
WF
215
> 0.999
0.11
215
< 0.001
−0.91
WF
215
< 0.001
0.45
215
< 0.001
−0.70
CF
168
< 0.001
−0,37
168
< 0.001
−0.77
CF
168
> 0.999
−0.07
168
< 0.001
−0.52
FB
CM
259
0.461
0.12
259
< 0.001
−0.50
FB
CM
259
< 0.001
0.30
259
< 0.001
−0.51
WF
220
0.051
0.19
220
< 0.001
−0.54
WF
220
< 0.001
0.43
220
< 0.001
−0.47
CF
173
0.001
−0.29
173
< 0.001
−0.40
CF
173
> 0.999
−0.10
173
0.002
−0.29
CM
WF
265
> 0.999
0.06
265
> 0.999
0.02
CM
WF
265
0.597
0.12
265
> 0.999
0.09
CF
218
< 0.001
−0.39
218
> 0.999
0.11
CF
218
< 0.001
−0.37
218
0.019
0.21
WF
CF
179
< 0.001
−0.48
179
> 0.999
0.11
WF
CF
179
< 0.001
−0.51
179
0.318
0.16
AccZ2
CD
FB
209
> 0.999
0.09
209
< 0.001
−0.36
DecZ2
CD
FB
209
0.004
0.25
209
> 0.999
−0.03
CM
254
0.170
0.15
254
< 0.001
−0.63
CM
254
0.007
0.22
254
< 0.001
−0.27
WF
215
< 0.001
0.27
215
< 0.001
−0.50
WF
215
< 0.001
0.34
215
0.081
−0.18
CF
168
0.478
0.15
168
< 0.001
−0.46
CF
168
0.052
0.22
168
0.071
−0.21
FB
CM
259
> 0.999
0.07
259
< 0.001
−0.29
FB
CM
259
> 0.999
−0.02
259
< 0.001
−0.25
WF
220
0.048
0.19
220
0.436
−0.14
WF
220
> 0.999
0.09
220
0.211
−0.16
CF
173
> 0.999
0.07
173
> 0.999
−0.12
CF
173
> 0.999
−0.02
173
0.174
−0.18
CM
WF
265
0.552
0.12
265
0.011
0.20
CM
WF
265
0.642
0.11
265
0.599
0.12
CF
218
> 0.999
< 0.01
218
0.128
0.17
CF
218
> 0.999
< 0.01
218
> 0.999
0.06
WF
CF
179
> 0.999
−0.10
179
> 0.999
0.01
WF
CF
179
> 0.999
−0.11
179
> 0.999
−0.04
AccZ3
CD
FB
209
> 0.999
−0.05
209
0.003
−0.25
DecZ3
CD
FB
209
> 0.999
0.06
209
> 0.999
−0.10
CM
254
> 0.999
−0.03
254
< 0.001
−0.29
CM
254
> 0.999
0.06
254
0.208
−0.15
WF
215
0.090
0.18
215
0.001
−0.26
WF
215
0.201
0.16
215
0.240
−0.15
CF
168
> 0.999
0.03
168
0.032
−0.23
CF
168
> 0.999
0.07
168
0.259
−0.17
FB
CM
259
> 0.999
< 0.01
259
> 0.999
−0.05
FB
CM
259
> 0.999
< 0.01
259
> 0.999
−0.05
WF
220
0.008
0.23
220
> 0.999
−0.01
WF
220
> 0.999
0.10
220
> 0.999
−0.05
CF
173
> 0.999
0.08
173
> 0.999
0.01
CF
173
> 0.999
0.01
173
> 0.999
−0,07
CM
WF
265
0.006
0.21
265
> 0.999
0.05
CM
WF
265
> 0.999
0.10
265
> 0.999
< 0.01
CF
218
> 0.999
0.06
218
> 0.999
0.06
CF
218
> 0.999
0.01
218
> 0.999
−0.03
WF
CF
179
0.581
−0.14
179
> 0.999
0.02
WF
CF
179
> 0.999
−0.08
179
> 0.999
−0,03
AccZ4
CD
FB
209
> 0.999
−0.05
209
> 0.999
−0.09
DecZ4
CD
FB
209
> 0.999
−0.08
209
0.579
−0.13
CM
254
> 0.999
−0.03
254
> 0.999
−0.02
CM
254
> 0.999
−0.01
254
> 0.999
−0.07
WF
215
> 0.999
0.07
215
> 0.999
−0.09
WF
215
> 0.999
0.05
215
0.399
−0.14
CF
168
> 0.999
0.02
168
> 0.999
−0.06
CF
168
> 0.999
0.01
168
0.494
−0.15
FB
CM
259
> 0.999
0.01
259
> 0.999
0.07
FB
CM
259
> 0.999
0.07
259
> 0.999
0.05
WF
220
0.947
0.11
220
> 0.999
< 0.01
WF
220
0.445
0.14
220
> 0.999
−0.01
CF
173
> 0.999
0.06
173
> 0.999
0.02
CF
173
> 0.999
0.09
173
> 0.999
−0.02
CM
WF
265
> 0.999
0.10
265
> 0.999
−0.10
CM
WF
265
> 0.999
0.06
265
> 0.999
−0.07
CF
218
> 0.999
0.04
218
> 0.999
−0.05
CF
218
> 0.999
0.02
218
> 0.999
−0.07
WF
CF
179
> 0.999
−0.05
179
> 0.999
0.03
WF
CF
179
> 0.999
−0.04
179
> 0.999
−0.02
AccZ5
CD
FB
209
> 0.999
0.02
209
> 0.999
−0.03
DecZ5
CD
FB
209
> 0.999
−0.06
209
> 0.999
−0.09
CM
254
> 0.999
0.06
254
> 0.999
0.07
CM
254
> 0.999
< 0.01
254
> 0.999
−0.03
WF
215
> 0.999
0.07
215
> 0.999
−0.05
WF
215
> 0.999
< 0.01
215
> 0.999
−0.10
CF
168
> 0.999
0.01
168
> 0.999
−0.04
CF
168
> 0.999
−0.04
168
> 0.999
−0.12
FB
CM
259
> 0.999
0.04
259
0.884
0.11
FB
CM
259
> 0.999
0.06
259
> 0.999
0.06
WF
220
> 0.999
0.05
220
> 0.999
−0.02
WF
220
> 0.999
0.05
220
> 0.999
−0.01
CF
173
> 0.999
−0.01
173
> 0.999
−0.01
CF
173
> 0.999
0.02
173
> 0.999
−0.03
CM
WF
265
> 0.999
0.01
265
0.177
−0.15
CM
WF
265
> 0.999
−0.01
265
> 0.999
−0.07
CF
218
> 0.999
−0.04
218
0.937
−0.11
CF
218
> 0.999
−0.04
218
> 0.999
−0.08
WF
CF
179
> 0.999
−0.06
179
> 0.999
0.01
WF
CF
179
> 0.999
−0.04
179
> 0.999
−0.02
AccZ6
CD
FB
209
> 0.999
0.04
209
> 0.999
−0.01
DecZ6
CD
FB
209
> 0.999
−0.09
209
> 0.999
−0.08
CM
254
0.879
0.11
254
> 0.999
0.10
CM
254
> 0.999
−0.02
254
> 0.999
−0.03
WF
215
> 0.999
−0.03
215
> 0.999
−0.05
WF
215
0.996
−0.11
215
0.555
−0.13
CF
168
> 0.999
−0.06
168
> 0.999
−0.05
CF
168
> 0.999
−0.13
168
> 0.999
−0.11
FB
CM
259
> 0.999
0.07
259
0.766
0.11
FB
CM
259
> 0.999
0.06
259
> 0.999
0.05
WF
220
> 0.999
−0.07
220
> 0.999
−0.04
WF
220
> 0.999
−0.02
220
> 0.999
−0.05
CF
173
> 0.999
−0.10
173
> 0.999
−0.04
CF
173
> 0.999
−0.04
173
> 0.999
−0.03
CM
WF
265
0.167
−0.15
265
0.041
−0.18
CM
WF
265
> 0.999
−0.09
265
0.762
−0.11
CF
218
0.200
−0.16
218
0.313
−0.15
CF
218
> 0.999
−0.10
218
> 0.999
−0.08
WF
CF
179
> 0.999
−0.03
179
> 0.999
< 0.01
WF
CF
179
> 0.999
−0.02
179
> 0.999
0.02

#
m
#
m
n
p-value
Effect size
n
p-value
Effect size
n
p-value
Effect size
n
p-value
Effect size
AccZ1
CD
FB
209
> 0.999
0.01
209
< 0.001
−0.43
DecZ1
CD
FB
209
0.061
0.19
209
0.311
−0.15
CM
254
0.489
0.13
254
< 0.001
−0.86
CM
254
< 0.001
0.39
254
< 0.001
−0.58
WF
215
0.005
0.24
215
< 0.001
−0.81
WF
215
< 0.001
0.57
215
< 0.001
−0.51
CF
168
0.782
−0.14
168
< 0.001
−0.71
CF
168
> 0.999
0.12
168
< 0.001
−0.42
FB
CM
259
0.538
0.12
259
< 0.001
−0.43
FB
CM
259
0.011
0.21
259
< 0.001
−0.44
WF
220
0.004
0.24
220
< 0.001
−0.39
WF
220
< 0.001
0.38
220
< 0.001
−0.37
CF
173
0.613
−0.14
173
< 0.001
−0.30
CF
173
> 0.999
−0.07
173
0.003
−0.28
CM
WF
265
0.664
0.11
265
0.330
0.13
CM
WF
265
0.085
0.16
265
0.496
0.12
CF
218
0.004
−0.25
218
0.221
0.16
CF
218
0.002
−0.26
218
0.181
0.16
WF
CF
179
< 0.001
−0.39
179
> 0.999
0.06
WF
CF
179
< 0.001
−0.43
179
> 0.999
0.07
AccZ2
CD
FB
209
> 0.999
−0.05
209
0.070
−0.19
DecZ2
CD
FB
209
> 0.999
−0.01
209
0.691
−0.13
CM
254
> 0.999
−0.03
254
0.036
−0.18
CM
254
> 0.999
0.05
254
0.425
−0.13
WF
215
0.252
0.15
215
0.028
−0.21
WF
215
0.214
0.16
215
0.133
−0.17
CF
168
> 0.999
0.03
168
0.210
−0.18
CF
168
> 0.999
0.08
168
0.159
−0.19
FB
CM
259
> 0.999
0.02
259
> 0.999
< 0.01
FB
CM
259
> 0.999
0.06
259
> 0.999
−0.01
WF
220
0.018
0.21
220
> 0.999
−0.01
WF
220
0.129
0.17
220
> 0.999
−0.04
CF
173
> 0.999
0.09
173
> 0.999
< 0.01
CF
173
> 0.999
0.09
173
> 0.999
−0.05
CM
WF
265
0.022
0.19
265
> 0.999
−0.01
CM
WF
265
0.822
0.11
265
> 0.999
−0.04
CF
218
> 0.999
0.06
218
> 0.999
0.01
CF
218
> 0.999
0.03
218
> 0.999
−0.05
WF
CF
179
> 0.999
−0.12
179
> 0.999
0.02
WF
CF
179
> 0.999
−0.07
179
> 0.999
−0.03
AccZ3
CD
FB
209
> 0.999
0.03
209
> 0.999
−0.02
DecZ3
CD
FB
209
> 0.999
−0.10
209
> 0.999
−0.09
CM
254
0.947
0.11
254
> 0.999
0.09
CM
254
> 0.999
−0.01
254
> 0.999
−0.04
WF
215
> 0.999
0.03
215
> 0.999
−0.06
WF
215
> 0.999
−0.08
215
0.429
−0.14
CF
168
> 0.999
−0.03
168
> 0.999
−0.06
CF
168
> 0.999
−0.10
168
0.980
−0.13
FB
CM
259
> 0.999
0.08
259
0.897
0.11
FB
CM
259
> 0.999
0.09
259
> 0.999
0.05
WF
220
> 0.999
< 0.01
220
> 0.999
−0.04
WF
220
> 0.999
0.02
220
> 0.999
−0.05
CF
173
> 0.999
−0.06
173
> 0.999
−0.04
CF
173
> 0.999
0.01
173
> 0.999
−0.04
CM
WF
265
> 0.999
−0.09
265
0.058
−0.18
CM
WF
265
> 0.999
−0.07
265
0.863
−0.11
CF
218
0.556
−0.13
218
0.336
−0.14
CF
218
> 0.999
−0.08
218
> 0.999
−0.09
WF
CF
179
> 0.999
−0.06
179
> 0.999
−0.01
WF
CF
179
> 0.999
−0.02
179
> 0.999
< 0.01
#
m
#
m
n
p-value
Effect size
n
p-value
Effect size
n
p-value
Effect size
n
p-value
Effect size
AccTL1
CD
FB
209
> 0.999
−0.04
209
0.824
−0.12
DecTL1
CD
FB
209
0.008
−0.23
209
< 0001
−0.15
CM
254
> 0.999
< 0.01
254
>0.999
< 0.01
CM
254
0.822
−0.11
254
0.016
−0.12
WF
215
> 0.999
0.06
215
0.002
−0.26
WF
215
> 0.999
−0.07
215
< 0.001
−0.24
CF
168
> 0.999
−0.03
168
0.003
−0.28
CF
168
> 0.999
−0.13
168
< 0.001
−0.28
FB
CM
259
> 0.999
0.04
259
0.696
0.11
FB
CM
259
0.562
0.12
259
0.509
0.03
WF
220
> 0.999
0.11
220
0.275
−0.15
WF
220
0.054
0.19
220
> 0.999
−0.09
CF
173
> 0.999
0.01
173
0.240
−0.17
CF
173
> 0.999
0.10
173
0.249
−0.14
CM
WF
265
> 0.999
0.07
265
< 0.001
−0.31
CM
WF
265
> 0.999
0.06
265
< 0.001
−0.14
CF
218
> 0.999
0.03
218
< 0.001
−0.28
CF
218
> 0.999
−0.02
218
< 0.001
−0.17
WF
CF
179
> 0.999
−0.12
179
> 0.999
−0.05
WF
CF
179
> 0.999
−0.08
179
> 0.999
−0.07
AccTL2
CD
FB
209
> 0.999
0.02
209
> 0.999
−0.06
DecTL2
CD
FB
209
0.637
−0.13
209
0.281
−0.15
CM
254
> 0.999
0.03
254
> 0.999
0.06
CM
254
0.889
−0.11
254
0.622
−0.12
WF
215
> 0.999
−0.03
215
> 0.999
−0.11
WF
215
0.301
−0.15
215
0.005
−0.24
CF
168
> 0.999
−0.08
168
0.350
−0.16
CF
168
0.365
−0.16
168
0.003
−0.28
FB
CM
259
> 0.999
0.01
259
> 0.999
0.07
FB
CM
259
> 0.999
0.02
259
> 0.999
0.03
WF
220
> 0.999
−0.05
220
0.891
−0.12
WF
220
> 0.999
−0.02
220
> 0.999
−0.09
CF
173
> 0.999
−0.10
173
0.303
−0.17
CF
173
> 0.999
−0.04
173
0.700
−0.14
CM
WF
265
> 0.999
−0.08
265
0.005
−0.22
CM
WF
265
> 0.999
−0.04
265
0.191
−0.14
CF
218
> 0.999
−0.11
218
0.008
−0.23
CF
218
> 0.999
−0.06
218
0.134
−0.17
WF
CF
179
> 0.999
−0.07
179
> 0.999
−0.08
WF
CF
179
> 0.999
−0.03
179
> 0.999
−0.07
AccTL3
CD
FB
209
> 0.999
−0.01
209
> 0.999
0.01
DecTL3
CD
FB
209
> 0.999
−0.06
209
> 0.999
−0.04
CM
254
> 0.999
−0.06
254
> 0.999
−0.02
CM
254
0.659
−0.12
254
> 0.999
−0.10
WF
215
0.763
−0.12
215
> 0.999
−0.03
WF
215
0.370
−0.14
215
> 0.999
−0.11
CF
168
0.883
−0.12
168
> 0.999
−0.08
CF
168
0.529
−0.15
168
0.851
−0.13
FB
CM
259
> 0.999
−0.07
259
> 0.999
−0.03
FB
CM
259
> 0.999
−0.06
259
> 0.999
−0.06
WF
220
0.337
−0.14
220
> 0.999
−0.05
WF
220
> 0.999
−0.09
220
> 0.999
−0.07
CF
173
0.790
−0.13
173
> 0.999
−0.11
CF
173
> 0.999
−0.10
173
> 0.999
−0.02
CM
WF
265
> 0.999
−0.08
265
> 0.999
−0.02
CM
WF
265
> 0.999
−0.02
265
> 0.999
< 0.01
CF
218
> 0.999
−0.06
218
> 0.999
−0.07
CF
218
> 0.999
−0.04
218
> 0.999
−0.04
WF
CF
179
> 0.999
−0.01
179
> 0.999
−0.08
WF
CF
179
> 0.999
−0.02
179
> 0.999
−0.05
CD (n = 102)
FB (n = 107)
CM (n = 152)
WF
(n = 113)
CF (n = 66)
All
(n = 566)
CD
(n = 102)
FB
(n = 107)
CM
(n = 152)
WF
(n = 113)
CF
(n = 66)
All
(n = 566)
AccZ1#
8.0 ± 0.7
8.1 ± 1.5
7.9 ± 1.2
7.8 ± 1.4
8.5 ± 2.3
8.2 ± 1.7
DecZ1#
11.7 ± 0.9
11.7 ± 1.6
11.3 ± 1.4
11.1 ± 1.6
11.8 ± 2.3
11.5 ± 1.6
AccZ2#
4.1 ± 0.5
3.9 ± 0.4
3.8 ± 0.4
3.7 ± 0.4
3.8 ± 0.3
3.9 ± 0.4
DecZ2#
3.5 ± 0.4
3.2 ± 0.4
3.2 ± 0.3
3.0 ± 0.3
3.2 ± 0.3
3.2 ± 0.4
AccZ3#
2.7 ± 0.4
2.7 ± 0.4
2.7 ± 0.4
2.4 ± 0.3
2.6 ± 0.3
2.6 ± 0.4
Decz3#
1.9 ± 03
1.9 ± 0.3
1.9 ± 0.2
1.7 ± 0.2
1.8 ± 0.3
1.8 ± 0.3
AccZ4#
1.4 ± 0.2
1.5 ± 0.2
1.4 ± 0.2
1.3 ± 0.2
1.3 ± 0.2
1.4 ± 0.2
DecZ4#
1.3 ± 0.2
1.4 ± 0.2
1.3 ± 0.2
1.2 ± 0.2
1.3 ± 0.2
1.3 ± 0.2
AccZ5#
1.1 ± 0.2
1.1 ± 0.2
0.1 ± 0.2
1.0 ± 0.2
1.0 ± 0.2
1.0 ± 0.2
DecZ5#
0.7 ± 0.1
0.7 ± 0.2
0.7 ± 0.2
0.7 ± 0.1
0.7 ± 0.1
0.7 ± 0.2
AccZ6#
0.8 ± 0.2
0.7 ± 0.2
0.6 ± 0.2
0.8 ± 0.2
0.8 ± 0.2
0.7 ± 0.2
DecZ6#
0.5 ± 0.2
0.6 ± 0.2
0.5 ± 0.1
0.6 ± 0.2
0.6 ± 0.1
0.5 ± 0.2
AccZ1m
24.3 ± 2.1
25.9 ± 2.1
28.2 ± 2.6
28.0 ± 2.5
27.6 ± 2.2
26.9 ± 2.8
DecZ1m
38.3 ± 3.4
39.2 ± 3.0
41.3 ± 4.0
41.0 ± 3.3
40.4 ± 3.3
40.1 ± 3.6
AccZ2m
13.2 ± 1.6
14.6 ± 1.6
15.1 ± 1.9
15.2 ± 1.8
15.2 ± 1.7
14.9 ± 2.0
DecZ2m
11.3 ± 1.1
11.4 ± 1.3
12.4 ± 1.5
12.0 ± 1.3
12.1 ± 1.4
11.9 ± 1.4
AccZ3m
8.2 ± 1.0
9.1 ± 1.2
9.5 ± 1.3
9.2 ± 1.2
9.2 ± 1.2
9.1 ± 1.3
DecZ3m
5.5 ± 0.8
5.8 ± 0.8
6.0 ± 0.8
6.0 ± 0.9
6.1 ± 0.8
5.9 ± 0.8
AccZ4m
3.7 ± 0.4
4.0 ± 0.6
3.9 ± 0.5
4.1 ± 0.6
4.0 ± 0.5
3.9 ± 0.6
DecZ4m
3.1 ± 0.
3.5 ± 0.6
3.3 ± 0.6
3.6 ± 0.6
3.6 ± 0.5
3.4 ± 0.6
AccZ5m
2.3 ± 0.4
2.4 ± 0.5
2.1 ± 0.4
2.5 ± 0.4
2.5 ± 0.3
2.3 ± 0.4
DecZ5m
1.3 ± 0.3
1.1 ± 0.4
1.4 ± 0.3
1.7 ± 0.3
1.7 ± 0.3
1.5 ± 0.4
AccZ6m
1.3 ± 0.3
1.3 ± 0.3
0.9 ± 0.3
1.5 ± 0.4
1.5 ± 0.4
1.3 ± 0.4
DecZ6m
0.8 ± 0.3
1.1 ± 0.3
0.8 ± 0.3
1.3 ± 0.4
1.2 ± 0.3
1.0 ± 0.4
AccZ1#
12.1 ± 1.0
12.1 ± 1.6
11.8 ± 1.3
11.5 ± 1.5
12.3 ± 2.3
11.9 ± 1.6
DecZ1#
15.2 ± 1.0
14.9 ± 1.6
14.4 ± 1.4
14.1 ± 1.6
15.0 ± 2.4
14.7 ± 1.6
AccZ2#
4.1 ± 0.5
4.2 ± 0.5
4.1 ± 0.5
3.7 ± 0.4
3.9 ± 0.5
4.0 ± 0.5
DecZ2#
3.3 ± 0.4
3.3 ± 0.5
3.2 ± 0.4
2.9 ± 0.4
3.1 ± 0.4
3.1 ± 0.4
AccZ3#
1.9 ± 0.3
1.8 ± 0.4
1.6 ± 0.3
1.8 ± 0.3
1.9 ± 0.2
1.8 ± 0.3
DecZ3#
1.1 ± 0.3
1.3 ± 0.3
1.1 ± 0.2
1.3 ± 0.3
1.3 ± 0.2
1.2 ± 0.3
AccZ1m
37.5 ± 3.3
40.5 ± 3.3
44.1 ± 4.1
43.2 ± 4.0
42.8 ± 3.2
41.8 ± 4.4
DecZ1m
49.6 ± 3.9
50.5 ± 3.8
53.7 ± 4.9
53.0 ± 4.1
52.5 ± 4.1
52.0 ± 4.6
AccZ2m
11.9 ± 1.3
13.1 ± 1.8
13.4 ± 1.7
13.3 ± 1.7
13.2 ± 1.6
13.0 ± 1.7
DecZ2m
8.5 ± 1.1
9.3 ± 1.4
9.3 ± 1.3
9.6 ± 1.4
9.7 ± 1.2
9.3 ± 1.3
AccZ3m
3.6 ± 0.6
3.6 ± 0.7
3.0 ± 0.7
4.0 ± 0.7
4.0 ± 0.6
3.6 ± 0.8
DecZ3m
2.1 ± 0.6
2.7 ± 0.7
2.2 ± 0.5
2.9 ± 0.7
2.9 ± 0.5
2.5 ± 0.7
AccTL1#
3.3 ± 0.4
3.3 ± 0.5
3.0 ± 0.4
3.1 ± 0.4
3.2 ± 0.4
3.2 ± 0.4
DecT1#
2.4 ± 0.4
2.7 ± 0.5
2.4 ± 0.4
2.5 ± 0.4
2.6 ± 0.3
2.5 ± 0.4
AccTL2#
1.9 ± 0.3
1.8 ± 0.4
1.6 ± 0.3
1.8 ± 0.3
1.9 ± 0.2
1.8 ± 0.3
DecT2#
1.1 ± 0.3
1.3 ± 0.3
1.1 ± 0.2
1.3 ± 0.3
1.3 ± 0.2
1.2 ± 0.3
AccT3#
0.8 ± 0.2
0.7 ± 0.2
0.6 ± 0.2
0.8 ± 0.2
0.8 ± 0.2
0.7 ± 0.2
DecT3#
0.5 ± 0.2
0.6 ± 0.2
0.5 ± 0.1
0.6 ± 0.2
0.6 ± 0.1
0.5 ± 0.2
AccT1m
7.3 ± 0.9
7.6 ± 1.3
6.9 ± 1.0
8.1 ± 1.1
8.1 ± 0.9
7.5 ± 1.2
DecT1m
5.2 ± 0.9
6.2 ± 1.2
5.5 ± 1.0
6.5 ± .1.1
6.5 ± 0.8
5.9 ± 1.2
AccT2m
3.6 ± 0.6
3.6 ± 0.7
3.0 ± 0.7
4.0 ± 0.7
4.0 ± 0.6
3.6 ± 0.8
DecT2m
2.1 ± 0.6
2.7 ± 0.7
2.2 ± 0.5
2.9 ± 0.7
2.9 ± 0.5
2.5 ± 0.7
AccT3m
1.3 ± 0.3
1.2 ± 0.3
0.9 ± 0.3
1.5 ± 0.4
1.5 ± 0.4
1.3 ± 0.4
DecT3m
0.8 ± 0.3
1.1 ± 0.3
0.8 ± 0.3
1.3 ± 0.4
1.2 ± 0.3
1.0 ± 0.4