
Abstract
The accuracy and consistency with which home plate umpires call pitches can play a significant role in the outcomes of Major League Baseball (MLB) games. Here, we investigate trends in called pitch accuracy (percentage of pitches called correctly) and within-game consistency for all regular season Major League Baseball games from 2008–2023, and we map the locations of these pitches to quantify how well the geometry of the strike zone established by the decisions made by umpires (called strike zone, CSZ) aligns with that of the rule-book strike zone (RBSZ) in each season. Our results show that there was steady improvement in both accuracy (from less than 86% to almost 92%) and within-game consistency of the CSZ, although the rate of improvement slowed in the last few years of the time period. By 2023 the CSZ's geometry aligned with that of the RBSZ in every respect except its size, which was still about 10% too large. The implications of these levels and trends in umpire performance metrics for the forthcoming implementation of an automated system for calling balls and strikes in MLB are discussed.
Introduction
In 2008, Major League Baseball began to use technology for tracking the path of every pitch in every game and made this data available to teams and the general public. Later, additional technology was implemented for tracking the locations of batted balls and players. These data are a veritable “gold mine” to sabermetricians and others interested in analyzing baseball statistically and have been used for many purposes. Uses have included devising and assessing game strategies, evaluating the mechanics and talent of players, and evaluating the performance of home plate umpires at calling balls and strikes (Healey, 2017). For the latter purpose in particular, the location of a pitch as it crosses home plate is of primary importance, as this datum may be compared to the set of points comprising the rule-book strike zone (henceforth RBSZ) and then used, together with the umpire's call of the pitch, to determine whether the umpire called the pitch correctly. Numerous studies of umpire performance and factors that may affect it have been conducted; see, for example, Walsh (2010), Parsons et al. (2011), Juarez (2012), Green and Daniels (2014), Marchi and Albert (2014), Kim and King (2014), Mills (2014, 2016, 2017), Tainsky et al. (2015), Zimmerman et al. (2019), Huang and Hsu (2020), Fesselmeyer (2021), Flannagan et al. (2024), and Post and Zimmerman (2024).
Of the aforementioned studies, three have focused on how umpire performance has evolved since the inception of pitch-tracking technology. Mills (2017) found that umpire accuracy (the percentage of called pitches called correctly) increased steadily from 2008–2014 and attributed it to immediate and detailed performance feedback provided to umpires, which was made possible by the newly available pitch tracking data. Zimmerman et al. (2019) corroborated this finding and extended it to a slightly longer timeframe (2008–2016). Zimmerman et al. (2019) also studied how the geometry (centroid, dimensions, and shape) of the strike zone as called by umpires (henceforth the called strike zone, CSZ) changed over that time period. They showed in particular that the CSZ became significantly taller, narrower, larger, more rectangular, and more well-centered over home plate from 2008–2016. Furthermore, it became significantly more like the RBSZ in every respect except its size. Flannagan et al. (2024) considered slightly different metrics over the period 2008–2015, with similar conclusions.
Considerable time has elapsed since the last season considered by the previous works on this topic, and it is currently of interest to discover if umpire performance has continued to improve, stagnated, or possibly even deteriorated since then. Furthermore, Hunter (2018) introduced some additional metrics of umpire performance related to within-game consistency not considered in previous studies, for which the time-evolution dating back to 2008 is also of interest. The purpose of this article is to document how the accuracy, within-game consistency, and geometry of the CSZ evolved from 2008 to 2023, and especially after 2016. One motivation for our work is the fact that as this paper is being written, Major League Baseball is considering the use of automated ball-strike technology (“robo-umps”) to supplement or replace calls made by human umpires. The technology has been tested in minor league baseball since 2019 and might be implemented in the major leagues as early as the 2026 season (Rogers, 2024). In particular, the use of a hybrid system, involving human umpires supplemented by a challenge system in which robo-ump calls can override a very limited number of umpire-called pitches (two or three for each team per game, not accounting for retention if the challenge is successful), appears more likely than a completely automated system. The current level of human umpire performance should play a role in what type of system is implemented and the timing of its implementation. At one extreme, if umpires are nearly perfect at calling balls and strikes, then there is little need for an automated system. At the other extreme, if umpire performance is currently too poor, then a challenge system is unlikely to work well, as there will be too many successful challenges and thus too many disruptions to the flow of the game, making a fully automated system preferable. Another consideration that might have a bearing on the timing of implementation is the amount by which umpires can be expected to improve in the near future. We believe that the results on current levels and trends in umpire performance presented herein shed light on which type of automated system is likely to be successful and when might be a good time to implement it.
Data
Statistical analyses of Major League Baseball benefit from many years of comprehensive data collection that has improved incrementally over nearly two decades. In 2006, the league introduced the PITCHf/x system during the postseason and started the modern era of data collection within the sport (Fast, 2010). A league-wide roll out was completed during the 2007 season. Consisting of two permanently mounted cameras in each MLB stadium, PITCHf/x tracked pitches at 60 Hz from the pitcher's hand along its path to home plate. From these images, the position of the baseball at about 20 time points was calculated to within half an inch in real-time using a proprietary software package provided by Sportsvision (Nathan, 2012a). This system allowed for the collection of various pitch-related variables including velocity, trajectory, and break. The StatCast system was introduced in 2015 to further improve data collection in Major League Baseball. StatCast uses optical cameras to record game-related occurrences not already collected by PITCHf/x. These include player position, results of individual plays, and ground ball speed among many others (Lage et al. 2016). Beginning in 2017, PITCHf/x was replaced with an updated technology, known colloquially as “Trackman,” which uses phased-array Doppler radar to track pitches via a single sensor mounted above home plate. The implementation of Doppler technology improves the estimation of variables associated with the flight of the baseball, both from the pitcher's hand to home plate as well as in flight after being struck by the batter. The combination of Trackman data (i.e., variables associated with the movement of the baseball) and StatCast data (i.e., all other game variables not associated with ball flight) are packaged and provided to the public following each game. This data packet is referred to colloquially as “StatCast” (Lage et al. 2016).
In this study we analyze the evolution of the MLB called strike zone during the modern pitch tracking era (2008–2023). The data we utilize for the determination of pitch location at the moment it crosses home plate is a combination of PITCHf/x (2008–2016) and Trackman (2017–2023), both representing the data officially accepted by MLB.
For the computation of one of our performance metrics (namely accuracy, to be described in the next section), the location of each called pitch must be compared to the boundaries of the RBSZ to determine whether the pitch was truly a ball or a strike. For this purpose we defined a horizontal line through the front edge of home plate and a vertical line through the center of that front edge as the horizontal and vertical axes, respectively, of a Cartesian coordinate system. The horizontal coordinates of the RBSZ's right and left boundaries may then be computed trivially as half the width of home plate plus the average radius of a baseball in each direction from the origin, i.e.,
Assigning values to the vertical extents of the RBSZ is more problematic. The PITCHf/x and Trackman systems obtain numerical values for these extents as the batter crouches in the batter's box to receive the pitch, which are determined in the former case by the camera operator (a human) and in the latter case by the radar itself. We used these atbat-specific values. An alternative would be to use their averages over all plate appearances by the same batter in the dataset. Using the at-bat-specific values has the advantage of accounting for the heights, amount of crouching, etc. of the batter in each of their at-bats, but it also has some potential disadvantages. These include the possibility that camera operators are more error-prone than the radar at making these determinations, which could yield a spurious jump in umpire accuracy when the system transitioned from PITCHf/x to Trackman. It is also possible that either the camera operators or the radar improved over time at making these determinations, which could also bias our assessment of improvement in umpire performance. As it turned out, we found that the choice of one or the other of these methods for determining vertical extents had very little effect on our accuracy metrics (less than 0.02% in all cases).
At the suggestion of a referee, we excluded from our analyses of accuracy all pitchouts and “pitches in the dirt” (pitches which bounce in front of home plate, for which the vertical coordinate in the dataset is recorded as a negative number). These types of pitches require no judgment on the part of the umpire, so it seems reasonable to omit them for the purpose of measuring umpire performance. The resulting dataset contained 5,083,585 called pitches, from 36,527 games.
Methods
In this section, we describe the metrics we use to measure umpire accuracy, within-game consistency, and the geometry of the called strike zone.
Accuracy
To measure umpire accuracy in a given year, we use simply the proportion of called pitches in that year that are called correctly. To reveal any possible difference in the accuracies of called balls and called strikes, we also calculate, for each year, the proportions of: (1) called balls that are called correctly (2) called strikes that are called correctly; (3) actual (RBSZ) balls that are called correctly; and (4) actual strikes that are called correctly.
Zimmerman et al. (2019) showed that batter handedness (right-handed or left-handed) and ball-strike count (0–0, 0–1, 0–2, 1–0, …, 3–2) strongly affect the geometry of the CSZ, and that pitcher handedness and the home/away status of the pitcher have some, but much weaker, effects. Accordingly, it is of interest to consider how the accuracy of the CSZ may be affected by these four factors. To reveal any such effects, we calculate the four accuracy metrics listed above for each level of these four factors. To evaluate whether a perceived monotonic trend in accuracy is statistically significant, either “on the whole” or parsed by the levels of a factor, we use nonparametric Mann-Kendall tests (Mann, 1945). Such tests are used to assess trends in this study's other performance metrics as well.
Within-game consistency
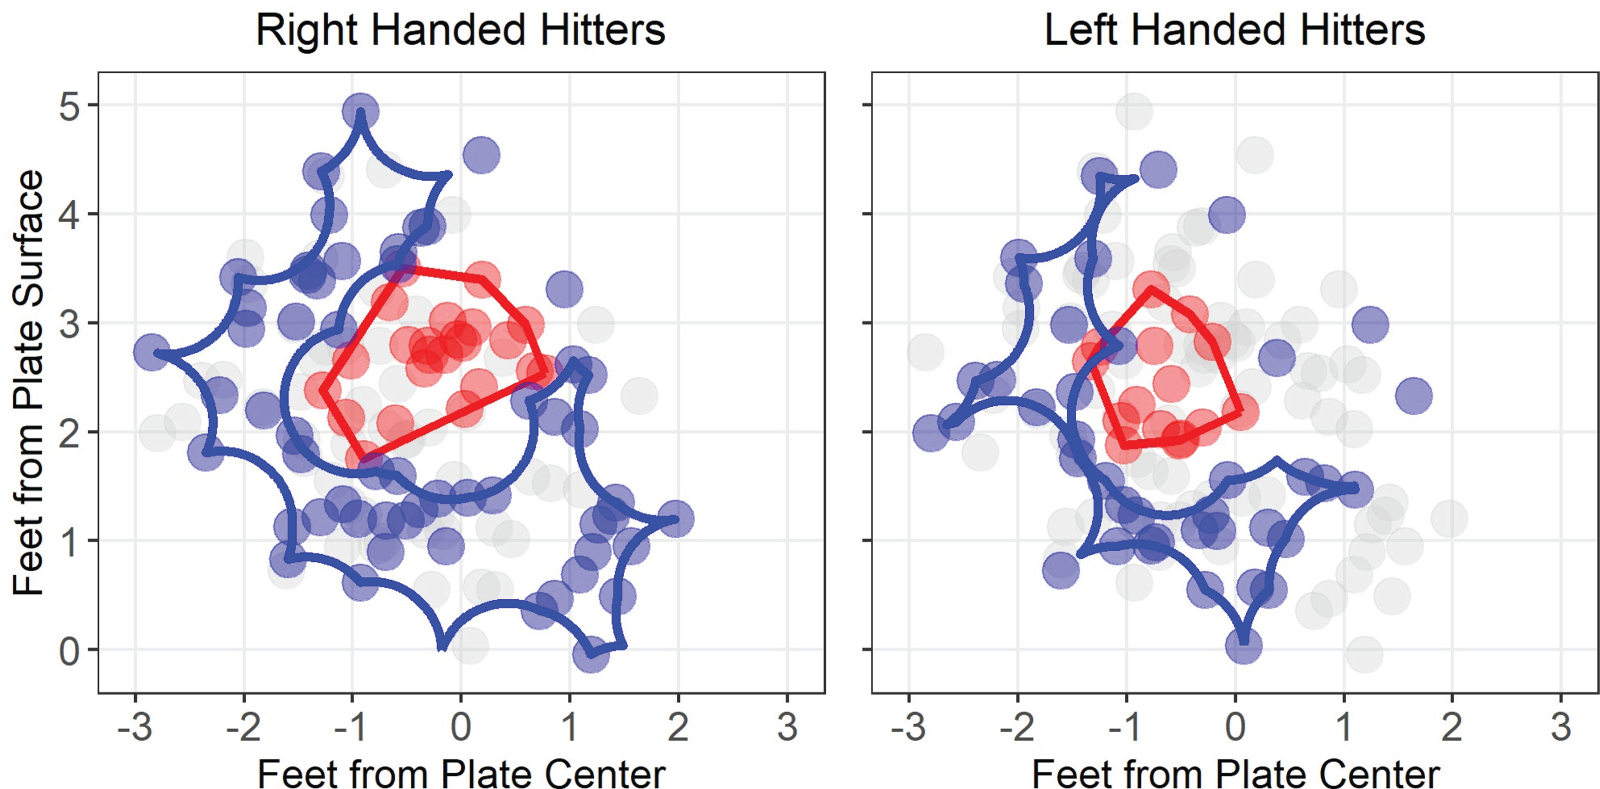
Accuracy is not the only metric by which an umpire may be judged. Indeed, baseball players, managers, and fans will tolerate some degree of inaccuracy in an umpire's calls if those calls are consistent within a game. With that in mind, Hunter (2018) introduced some metrics for within-game consistency of an umpire's called strike zone. One such metric, expressed to measure consistency and denoted here by CCH, is one minus the proportion of called balls that lie within the convex hull of called strikes for the game (Hunter's original metric was for inconsistency and was equal to 1 − CCH). Hunter suggested computing such a metric over all batters in the game and then again separately for right-handed and left-handed batters; we follow this suggestion. To illustrate, Figure 1 shows convex hulls of the called strikes, and the called balls that lie within it, for a game played on 7/16/2012 between the Los Angeles Angels and Detroit Tigers. The home plate umpire for the game was Sam Holbrook and the perspective in these plots, as in all plots of called pitches and strike zones in this article, is that of the umpire as he faces the pitcher. Two called balls lie within the convex hull of all called strikes in this game, but when broken down by batter handedness, the called-strike convex hull for right-handers contained no called balls, and its counterpart for left-handers only contained one called ball. Thus, in this game, Hunter's CCH consistency metrics for all batters, right-handed batters only, and left-handed batters only were 1 − (2/102) = 0.980, 1 − (0/58) = 1.000, and 1 − (1/44) = 0.977, respectively.
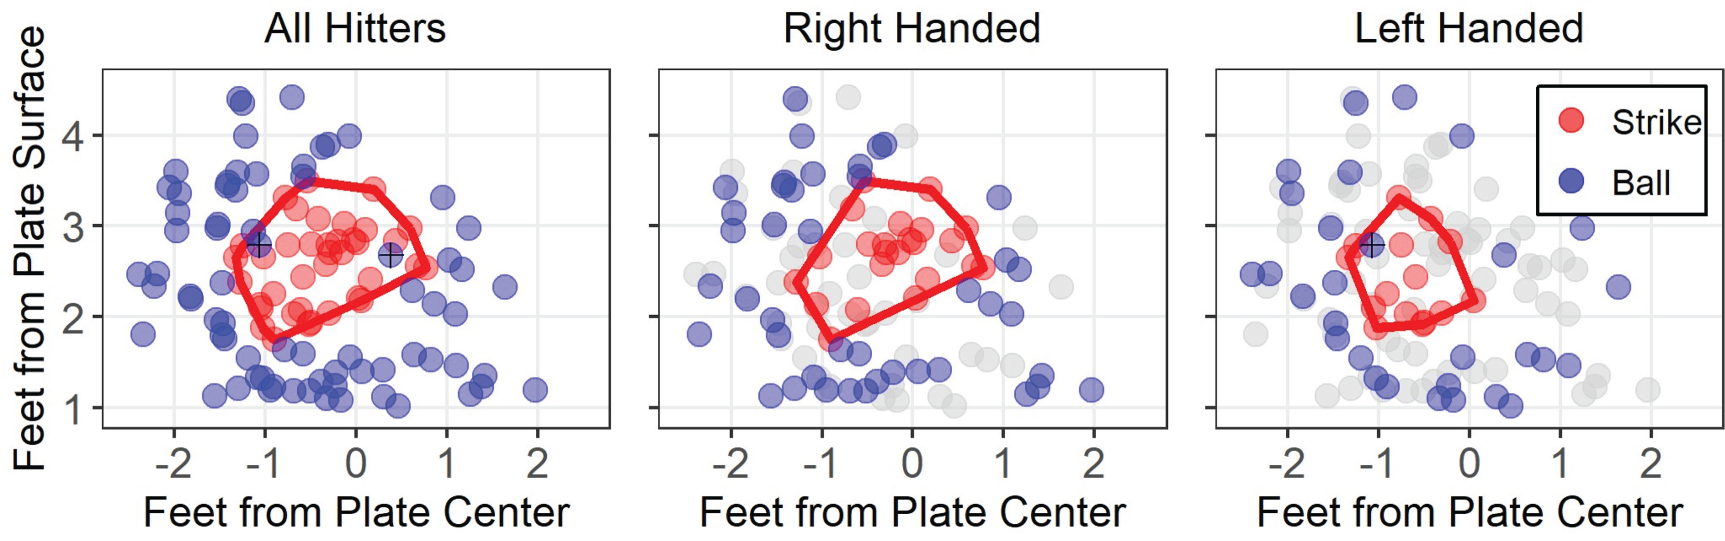
Convex hulls of called strikes and the called balls that lie within, for one particular game (see text for more details).
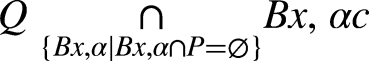
While simply determining the convex hull created by the strike zone for each individual game does provide a means for approximating the consistency of called pitches, it may not do so with required nuance. As outlined in Hunter (2018) and depicted in Figure 1, the overall consistency, CCH, does not utilize the established strike zone based on batter handedness. Further, it is possible, indeed common, for a vertex of the convex hull to lie within a cluster of called balls without actually enclosing any. This suggests that the vertex itself may represent an inconsistent pitch that the metric will not account for. Unfortunately, defining a convex hull for a region of called balls is fundamentally different than doing so for called strikes. The nature of baseball dictates that the region formed by called balls need not be convex nor simply connected, meaning that a standard convex hull is unlikely to adequately capture its nature. To resolve this, Hunter (2018) defined the set Q ⊆ R2 formed by called balls from a single game, given some radius α > 0, as
Convex hulls of called strikes and α-convex hull of balls where α = 0.65, for one particular game (see text for more details).
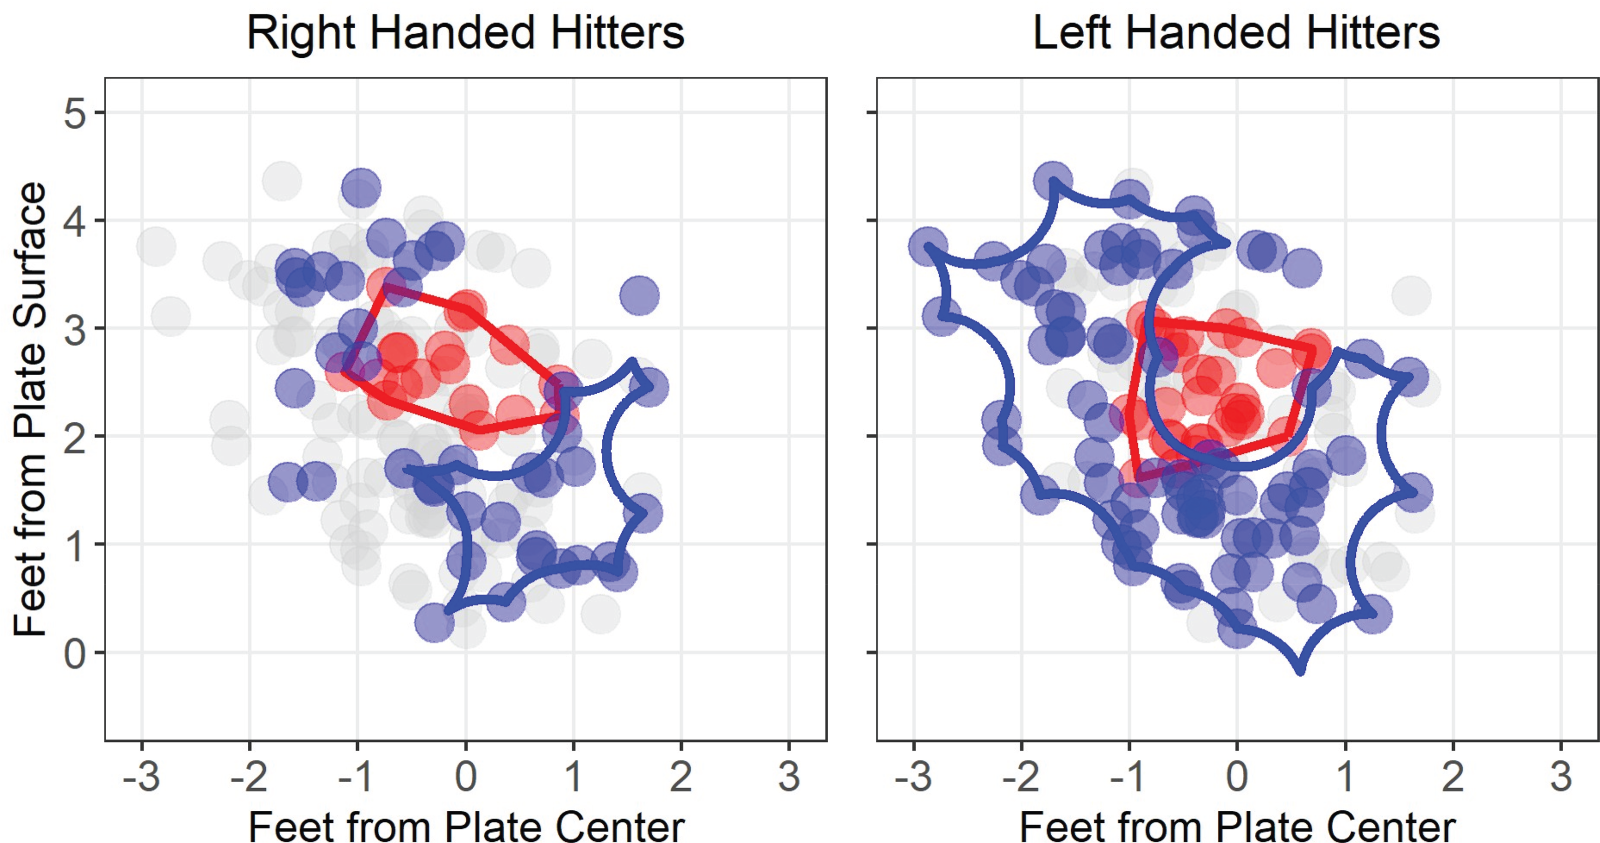
Convex hulls of called strikes and α-convex hull of balls where α = 0.65 for a game with relatively low CACH. Note the large areal overlap between the called strike and ball regions.
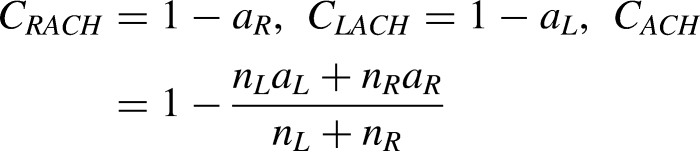
Two items in regard to our consistency measures are worth mentioning. First, although in theory CRACH, CLACH, or CACH could be negative, this never happened in any of the 36,527 games considered in this study. Second, Flannagan et al. (2024) also introduced a notion of umpire performance that they called consistency, which they tracked across a portion (2008–2015) of the same period of time we consider. However, their notion was one of consistency across an entire season, which is quite different than the within-game consistency we consider.
Geometry
In addition to the two metrics of umpire performance just described, we consider the geometry of the CSZ itself, defined formally as an empirically determined region in which a called pitch is more likely to be called a strike than a ball. We obtain these regions for each year by applying a neural net algorithm to the data separately from each year, taking as features only the horizontal and vertical coordinates of the called pitch. We used a neural net having a single hidden layer with either four or five nodes, which we implemented using the nnet package in R with a maximum of 500 iterations. A single layer rather than multiple layers was used because we judged that one would suffice (and avoid overfitting) for our relatively simple case of only two input features. The choice of nodes was made on the basis of ten-fold cross-validation with increasing numbers of nodes, starting with two. For all years except 2010–2012, the misclassification rate stabilized at four nodes; for the three exceptional years stabilization occurred at five nodes. The year-specific misclassification rates for our neural network were slightly lower than those we obtained by fitting the generalized additive model of Mills (2014, 2017), but only by 0.1–0.3% in most cases.
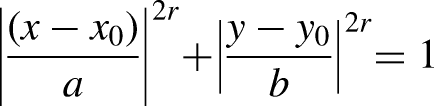
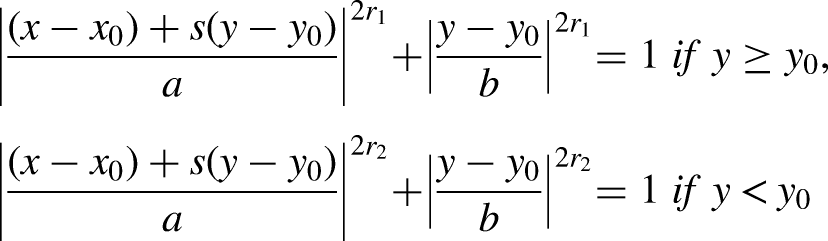
Furthermore, in order to quantitatively describe the geometry of a CSZ for a particular year and compare it statistically to another such zone or to the RBSZ, we model its shape. Previous investigations of the CSZ, whether marginalized over such factors as years, umpires, or batter and pitcher handedness (Zimmerman et al., 2019; Flannagan et al., 2024) or considered for specific choices of those factors (Huang and Hsu, 2020), have demonstrated that it has a shape that is very nearly a superellipse or a generalization thereof. Roughly speaking, a superellipse generalizes an ellipse by providing a continuum of shapes intermediate to an ellipse and a rectangle (see Figure 4, top row). The points (x,y) on the outline of a superellipse satisfy the equation
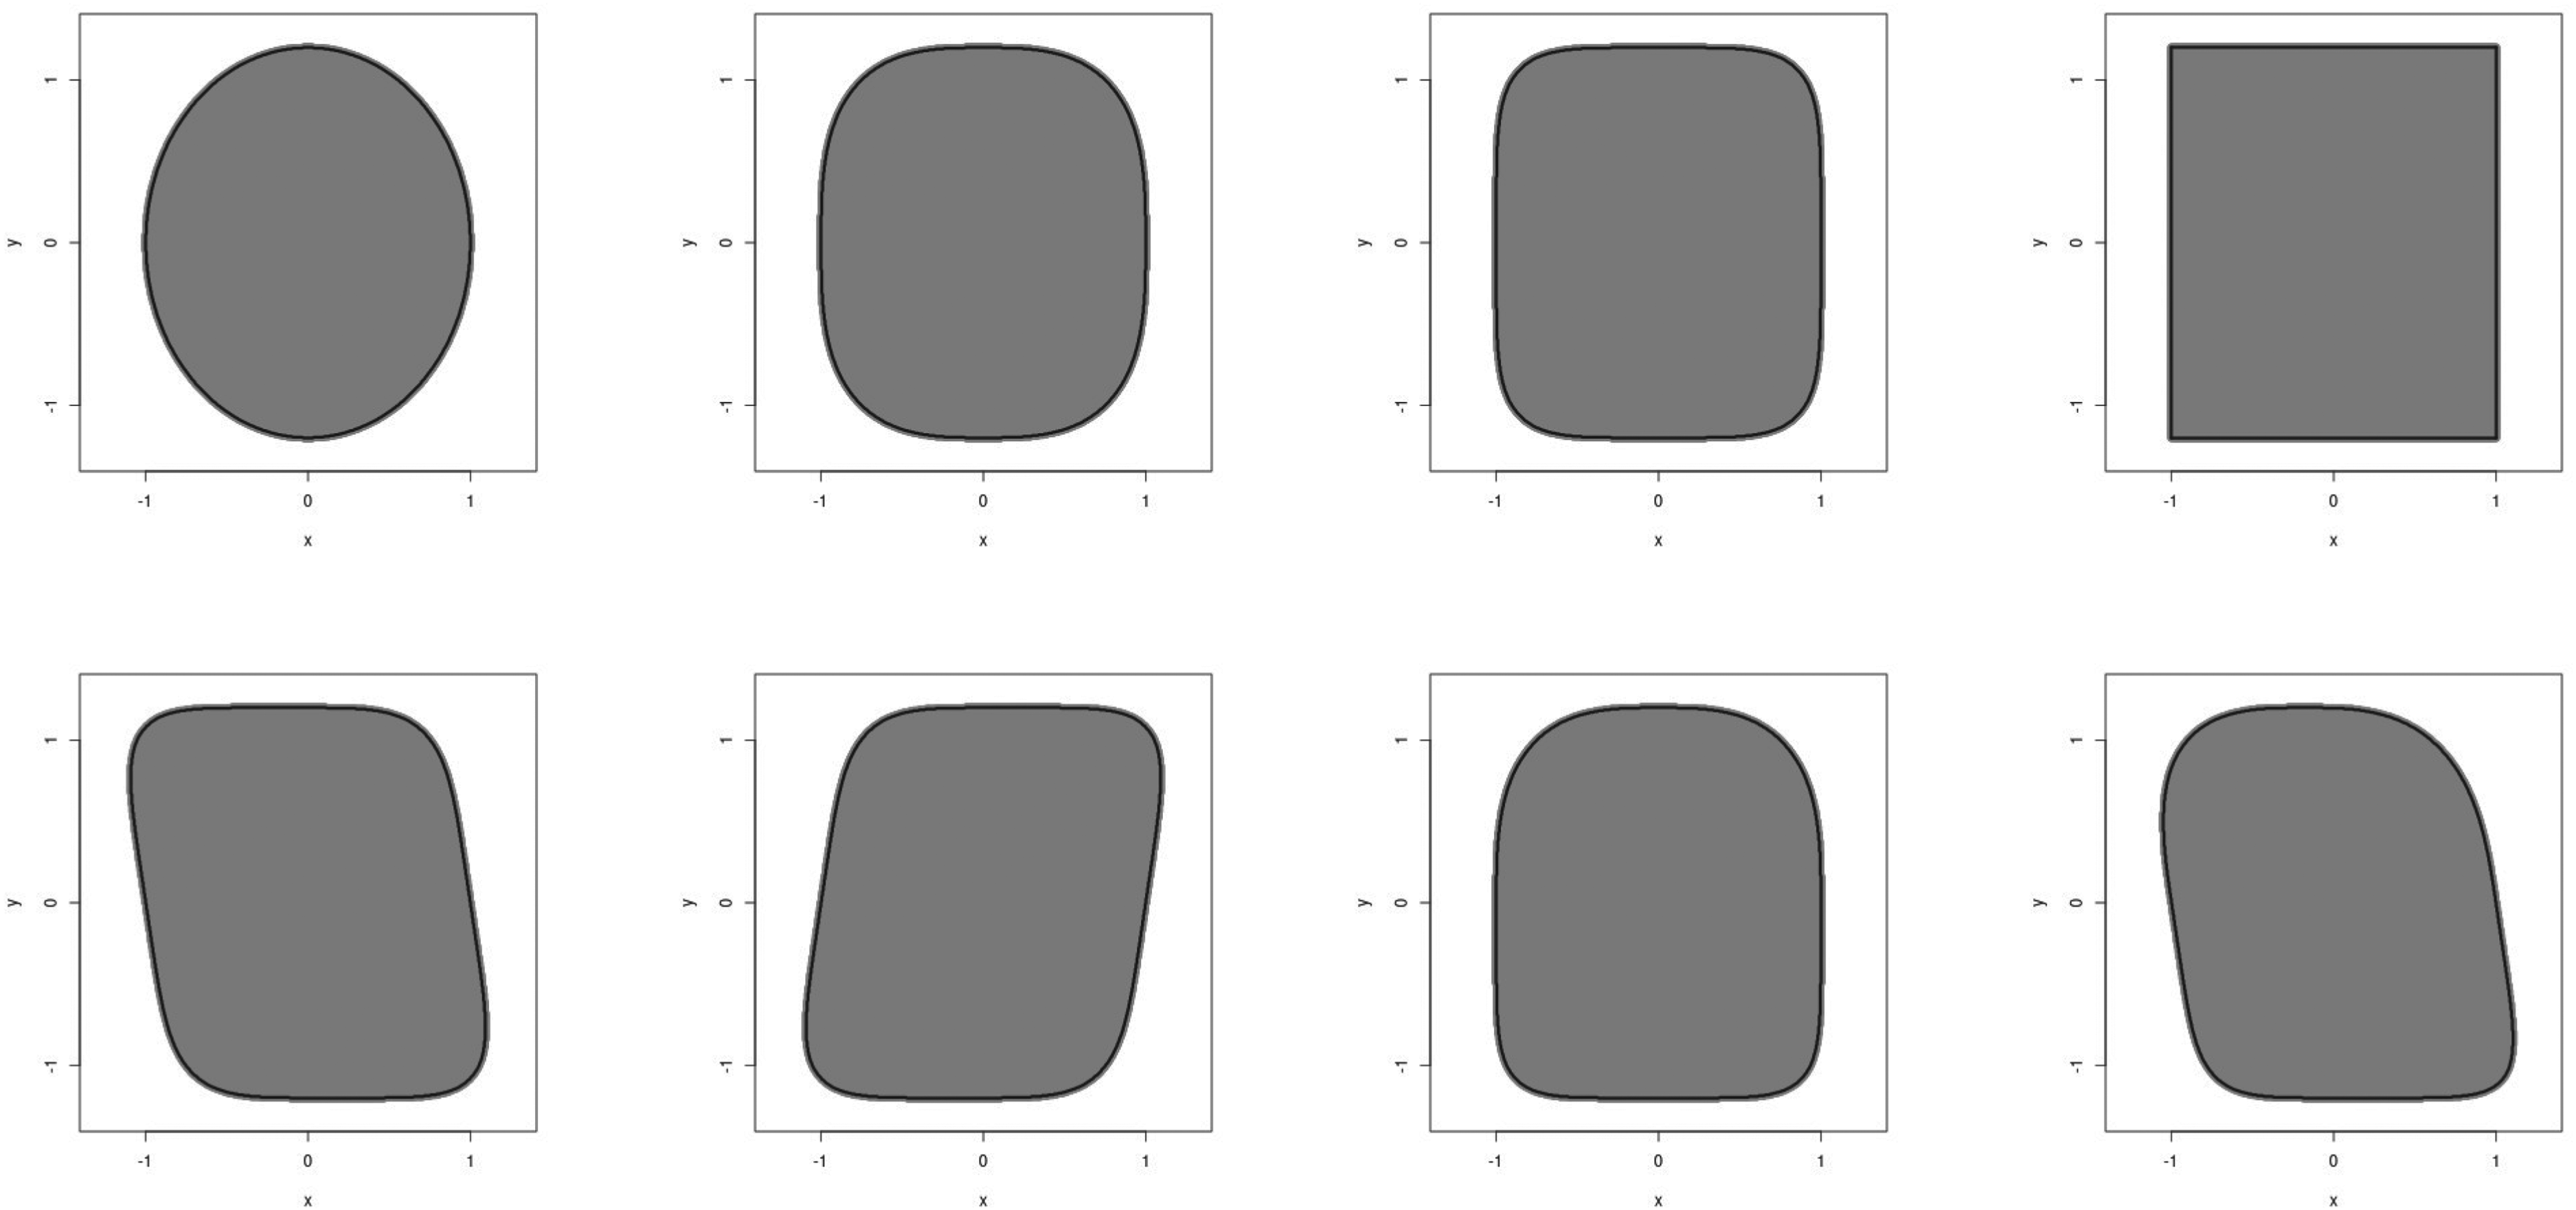
Examples of superellipses (top row) and ATLASes (bottom row). In both rows, a = 1.0 and b = 1.2. Moving from left to right in the top row, r = 1.0,1.5,2.5,+∞. Moving from left to right in the bottom row, (r1,r2,s) = (2.5,2.5,0.15),(2.5,2.5,−0.15),(1.5,3.0,0), and (1.5,3.0,0.15).
A generalization of a superellipse that has proven to be useful for modelling called strike zones is an affine-transformed latititudinally asymmetric superellipse (ATLAS), given by
If one were interested in only the center, height, and width of the CSZ, these quantities could be estimated nonparametrically in straightforward fashion. The advantage of a parametric ATLAS model is that it allows for explicit estimation of rectangularity (or lack thereof) and tilt, and to do so more parsimoniously than is typically possible using a more flexible (but still parametric) elliptic Fourier model (Zimmerman et al., 2019).
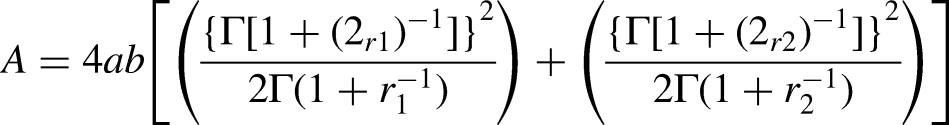
Two additional geometric features of the ATLAS derived from its parameters are its eccentricity, defined as E = a/b, and its area, which is given by
We fit an ATLAS model to each year-specific called strike zone using an orthogonal distance fitting algorithm for closed curves specialized for use with (generalized) superellipses, which was developed by Zimmerman et al. (2019). This algorithm employs a least squares approach, minimizing the sum of squared distances of the point configuration along normals to a closed curve, where in this case the closed curve is modeled parametrically as an ATLAS.
Results
This section reports results of our analyses of year-specific umpire accuracy and within-game consistency, and of the geometry of year-specific called strike zones, from 2008–2023.
Accuracy
Of the 5,083,585 called pitches in the dataset, 3,641,629 (71.64%) were RBSZ balls and 1,441,956 (28.36%) were RBSZ strikes. Also, 3,428,603 (67.44%) of the called pitches were called balls, and the remaining 1,654,982 (32.56%) were called strikes. Of the RBSZ balls,
379,473 (10.42%) were called strikes; of the RBSZ strikes, 166,447 (11.54%) were called balls. Thus, umpires were slightly more likely to make an incorrect call on a RBSZ strike than on a RBSZ ball. On the other hand, those same numbers of misclassified pitches imply that 4.85% of the called balls were inside the RBSZ and 22.93% of the called strikes were outside the RBSZ. Thus, the error rate for umpires’ strike calls was more than four times higher than the error rate for their ball calls.
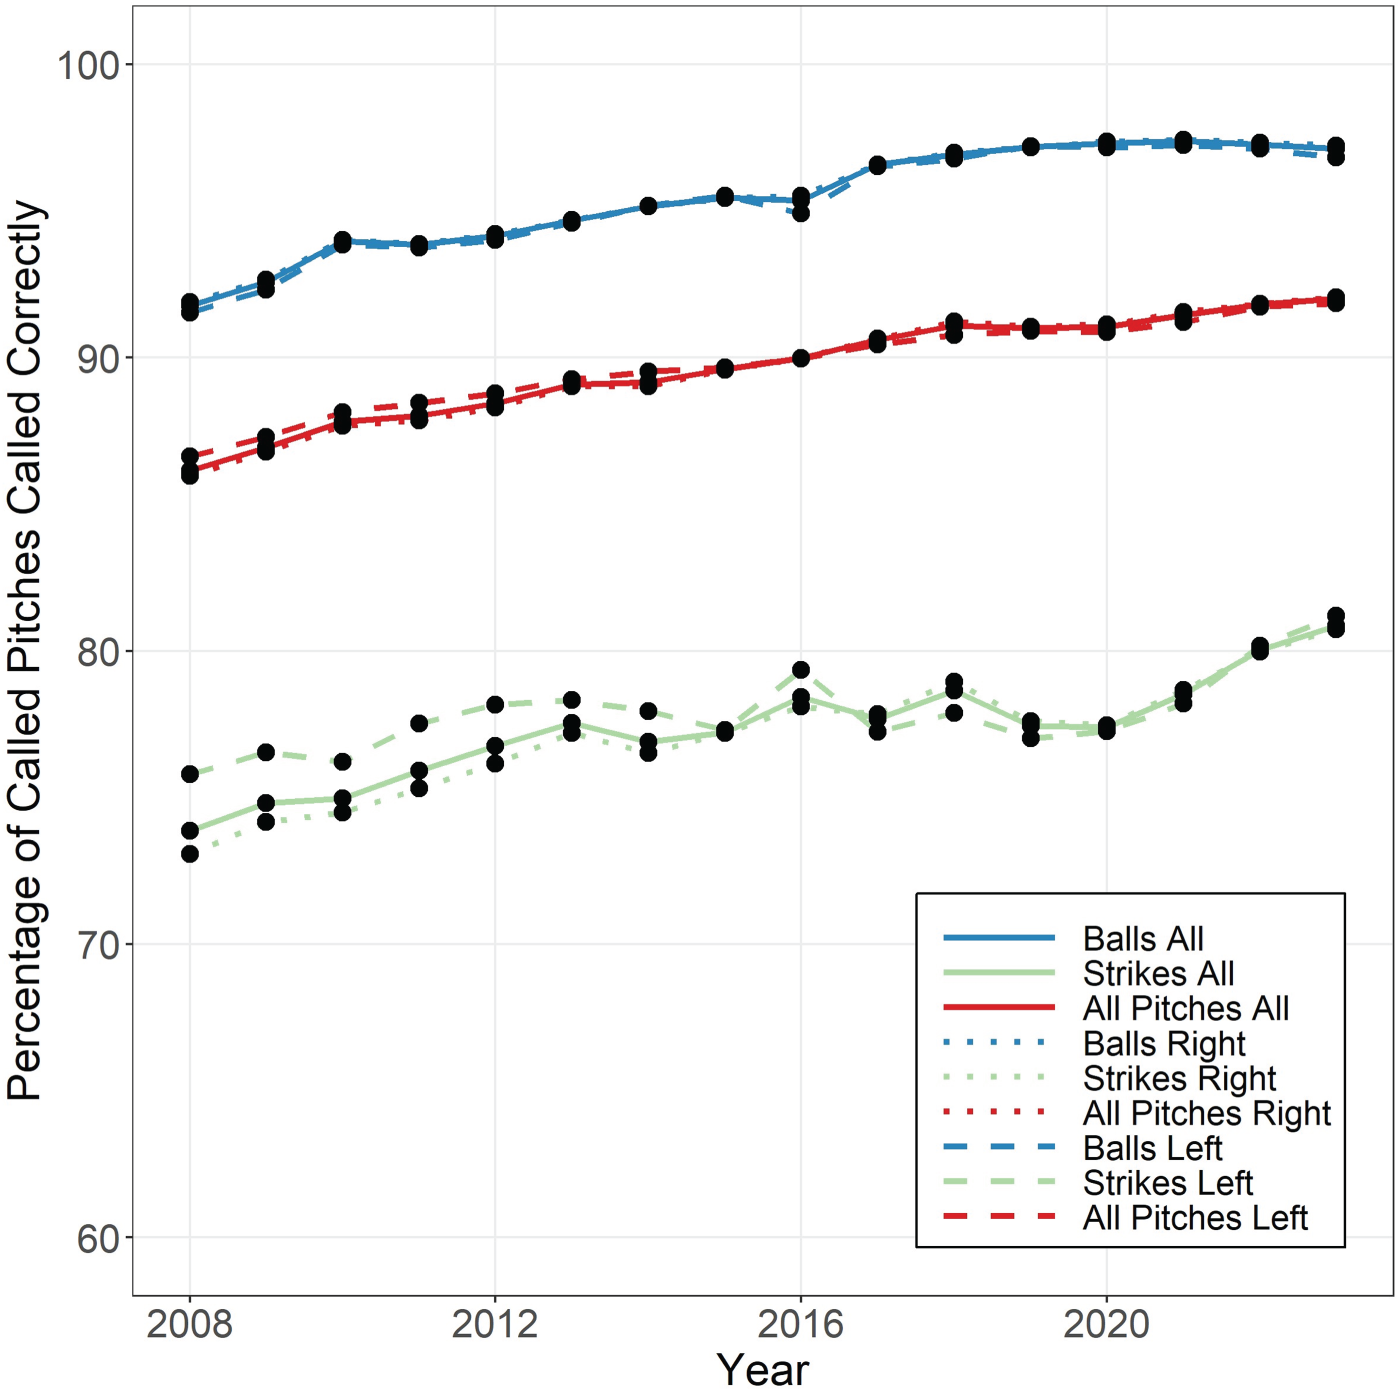
Overall, umpires correctly classified all but 545,920 (10.74%) of the called pitches, but their accuracy was not constant over time. The solid segmented lines in Figures 5 and 6 show that umpire accuracy increased steadily from 2008–2023, overall and for balls and strikes individually, whether the denominators of the error rates are taken to be the numbers of RBSZ balls and strikes (Figure 5) or the numbers of called balls and strikes (Figure 6). Mann-Kendall tests for trend are statistically significant for the accuracy of balls, strikes, and both combined, regardless of the type of denominator (in fact P < 0.0001 for all). Interestingly, Figure 5 shows that the proportion of RBSZ strikes called correctly, which was well below the proportion of RBSZ balls called correctly in 2008, improved at a much faster rate than the latter proportion, so that by 2023 the former exceeded the latter. Both figures indicate that accuracy tended to improve more slowly later in the time period than it did earlier, with the exception in Figure 6 of the proportion of called strikes called correctly, for which the improvement was as steep in the last three years (2021–2023) as it ever was.
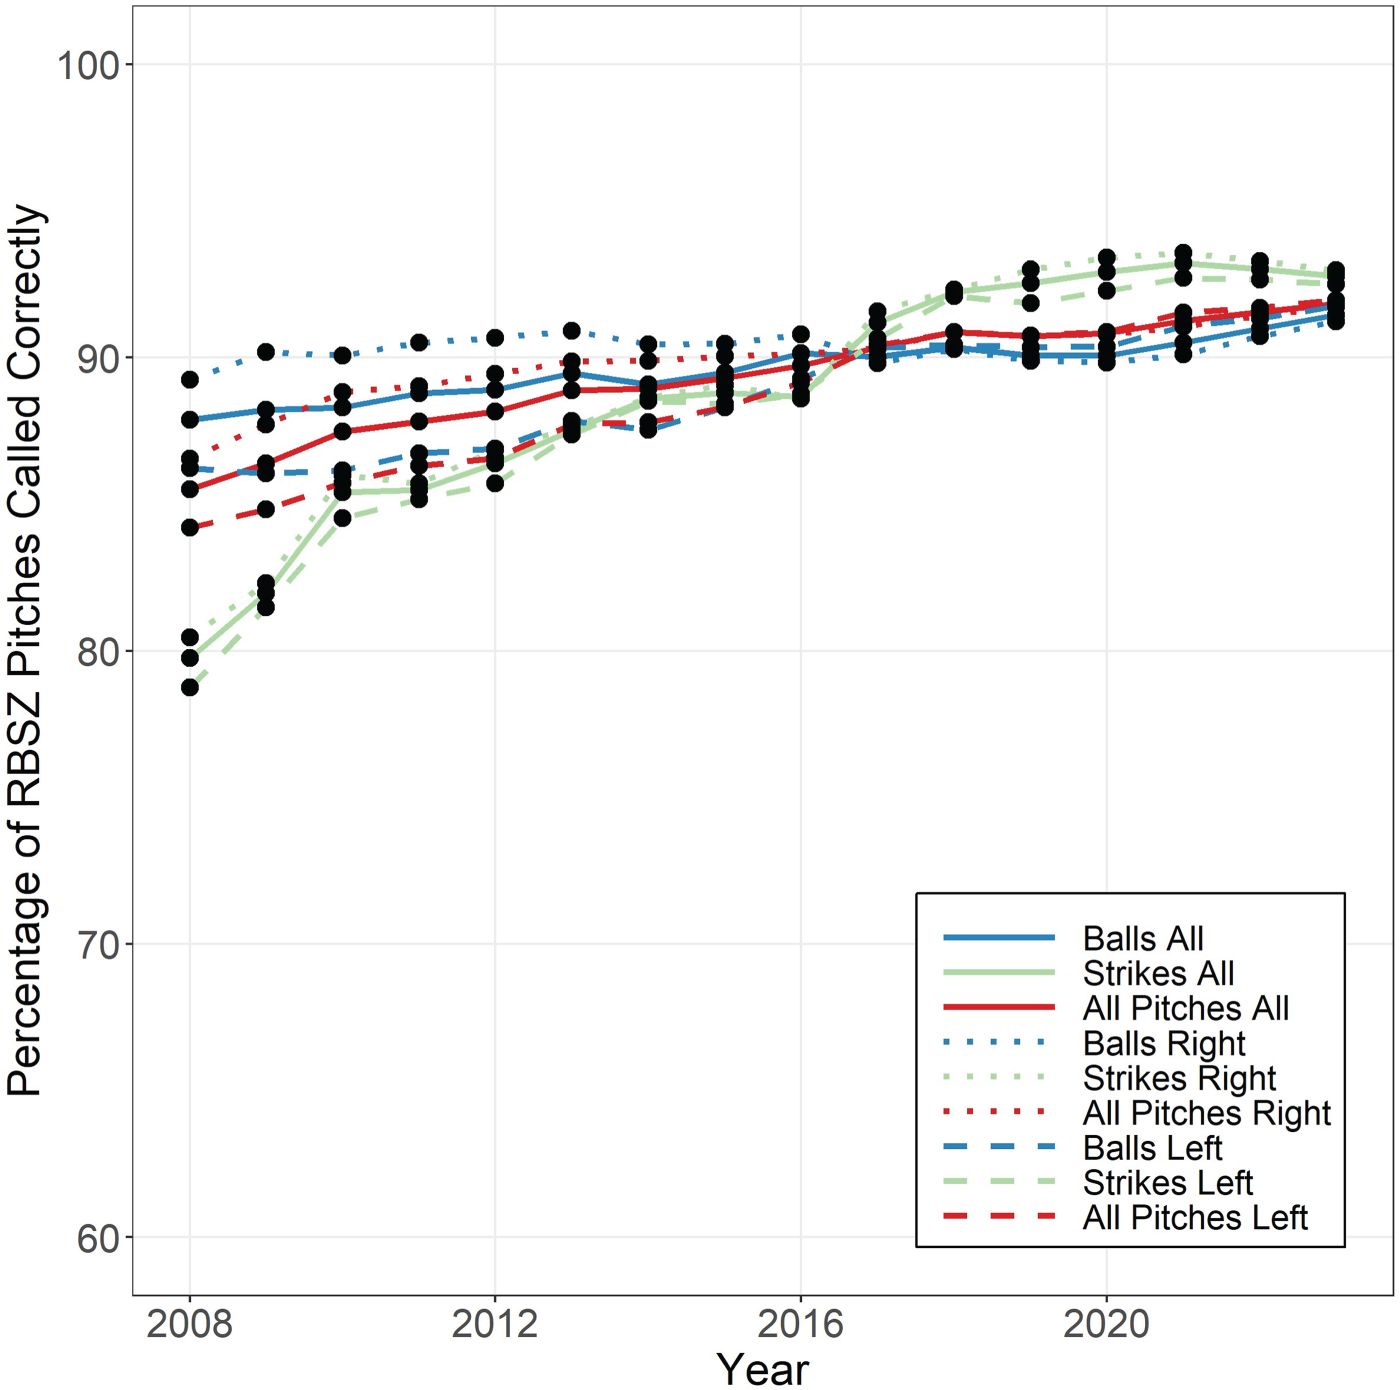
Year-specific accuracy (percentage of RBSZ balls and RBSZ strikes called correctly) for years 2008–2023, over all batters and parsed by batter handedness.
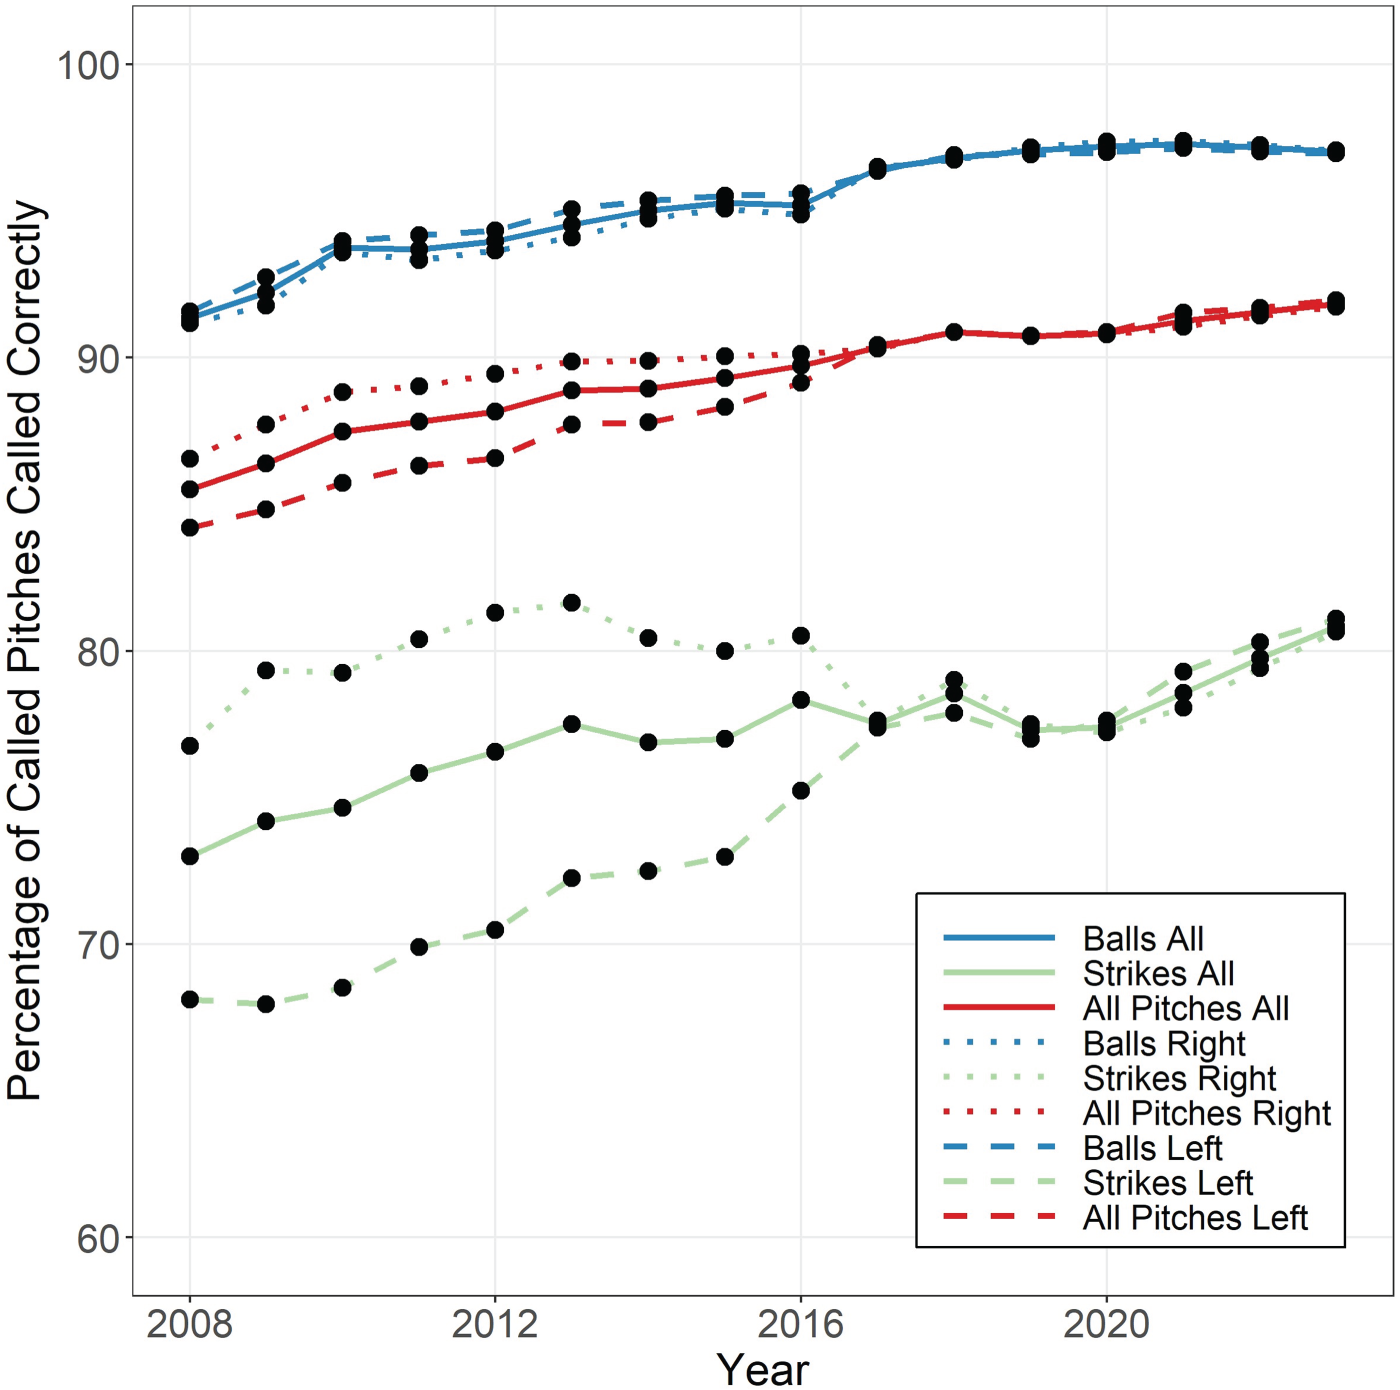
Year-specific accuracy (percentage of called balls and called strikes called correctly) for years 2008–2023, over all batters and parsed by batter handedness.
Figures 5 and 6 also parse the results on accuracy by the handedness of the batter (dashed and dotted segmented lines). An interesting revelation from Figure 6 is that almost all of the improvement from 2008–2017 in the proportion of called strikes called correctly was due to a reduction in incorrectly called strikes on left-handed batters. That is, prior to 2017, lefthanded batters suffered from a substantially greater proportion of called strikes that were actually balls than right-handed batters did, but this gap steadily narrowed over time. There was an opposite, much smaller but still statistically significant batter handedness effect on called ball accuracy over the same period, with left-handed batters receiving a slightly smaller proportion of called balls called incorrectly than right-handed batters. From 2017 forward, the called strike and called ball accuracies and their rates of improvement over time were similar for both groups of batters. The improvement in called ball accuracy itself, however, was highly statistically significant (in fact P < 0.0001) for batters of either handedness. Further discussion of these batter handedness effects is deferred to the Discussion.
Figure 7 displays alternative breakdowns of the results in Figure 5, this time by ball-strike count rather than batter handedness. The results shown, like those in Figure 5, are accuracies in terms of proportions of RBSZ strikes and RBSZ balls called correctly, as this facilitates the most direct comparison with previously published results. Some features evident in Figure 7 that are well known from previous studies (e.g., Green and Daniels, 2014) include: (1) an inverse relationship between the percentage of RBSZ strikes called correctly and the number of strikes in the count; (2) a direct, but weaker, relationship between the percentage of RBSZ balls called correctly and the number of strikes in the count; (3) a direct relationship between the percentage of RBSZ strikes called correctly and the number of balls in the count; and (4) an inverse, but weaker, relationship between the percentage of RBSZ balls called correctly and the number of balls in the count. Noteworthy features of this figure not previously documented are the apparent time trends, which reveal: (1) a steeper rate of improvement in the percentage of RBSZ strikes called correctly as the number of strikes in the count increases; and (2) a relatively constant (and less steep) rate of improvement in percentage of RBSZ balls called correctly, regardless of the number of balls in the count. Thus, compared to the number of strikes in the count, the number of balls is not as strongly associated with either accuracy or its improvement over time. Nearly all of the upward trends in Figure 7 are statistically significant, but most are not as steep after 2016 as before. Overall, it can be said that umpires still exhibited some reluctance to call a third strike in 2023, but not as much as in 2008.
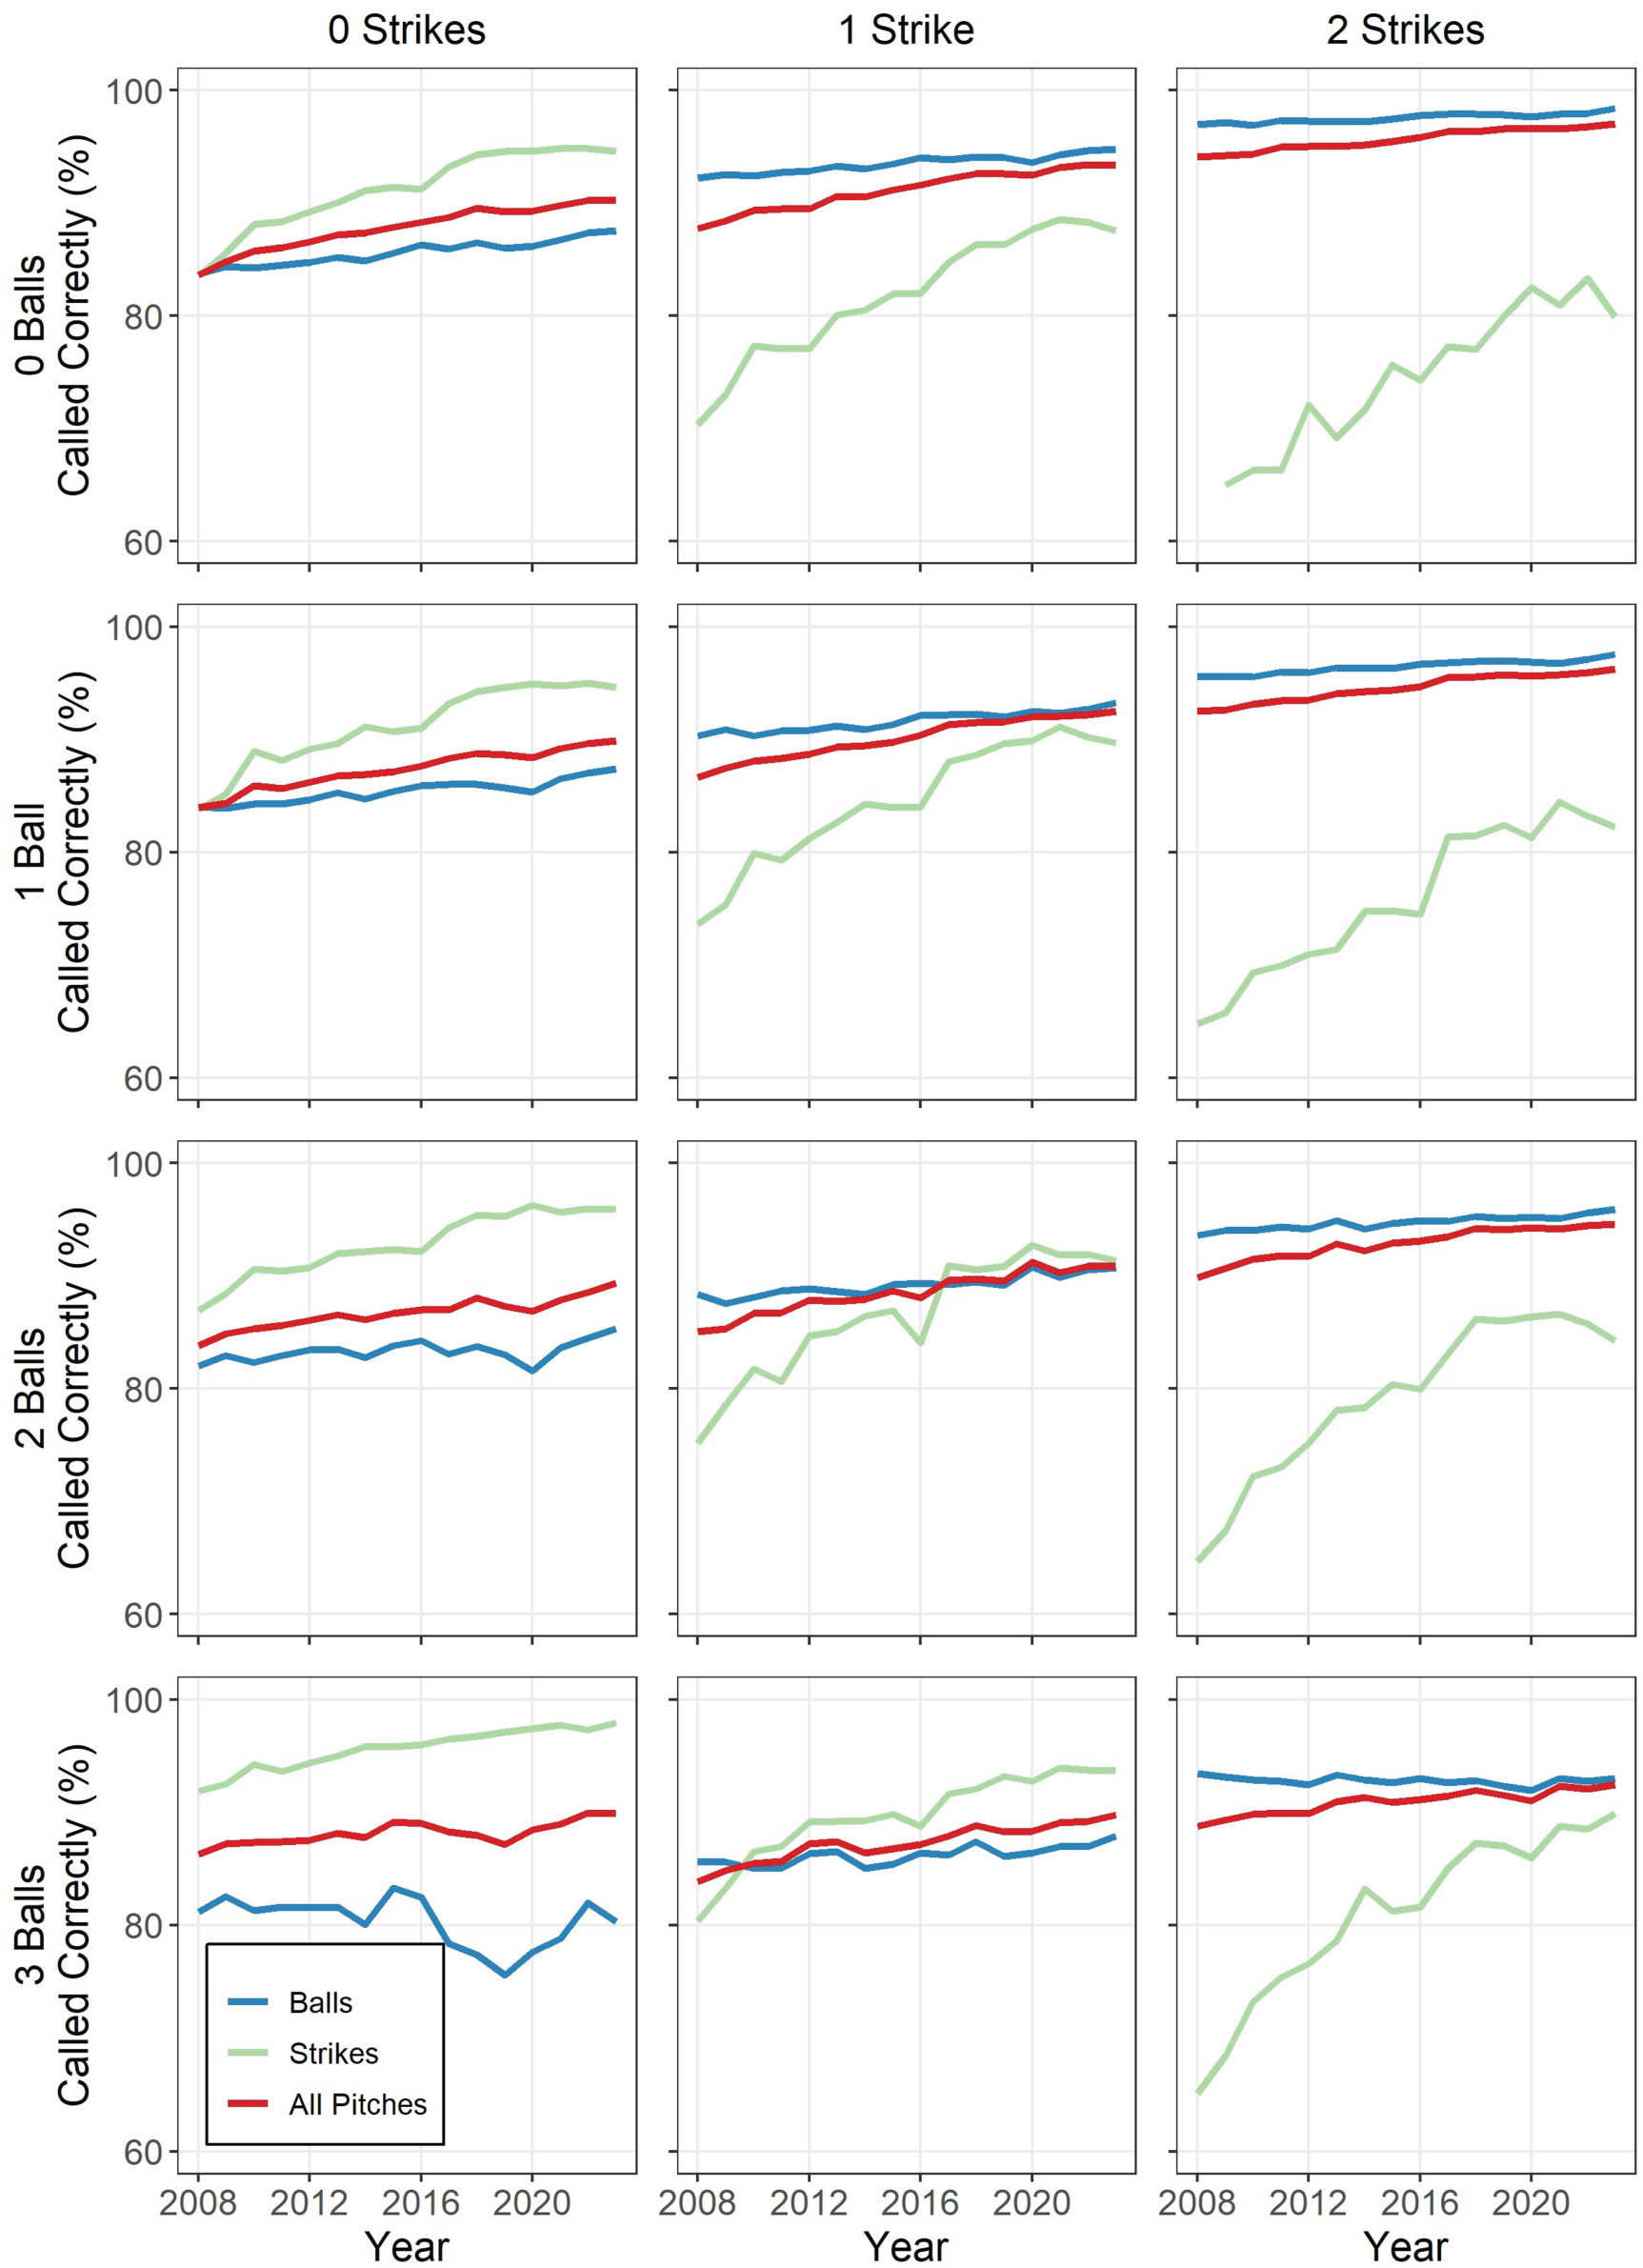
Year-specific accuracy (percentage of RBSZ balls and RBSZ strikes called correctly) for years 2008–2023, over all called pitches and parsed by the ball-strike count prior to the pitch.
Additional breakdowns of accuracy by player attributes or game situations are possible, including, for example, breakdowns by pitcher handedness and home/away venue for the pitcher. We parsed the accuracy results by each of these two factors and found nothing particularly noteworthy. Figure 8 reveals a small (1.5–3%) but statistically significant pitcher handedness effect (P < 0.05 using a two-sample z-test for equal proportions) in the proportions of called strikes called correctly in years 2008–2012 and 2014, which vanished after 2014. Figure 9 shows that there were no discernible effects of pitcher home/away status on umpire accuracy.
Year-specific accuracy (percentage of called balls and called strikes called correctly) for years 2008–2023, over all pitchers and parsed by pitcher handedness.
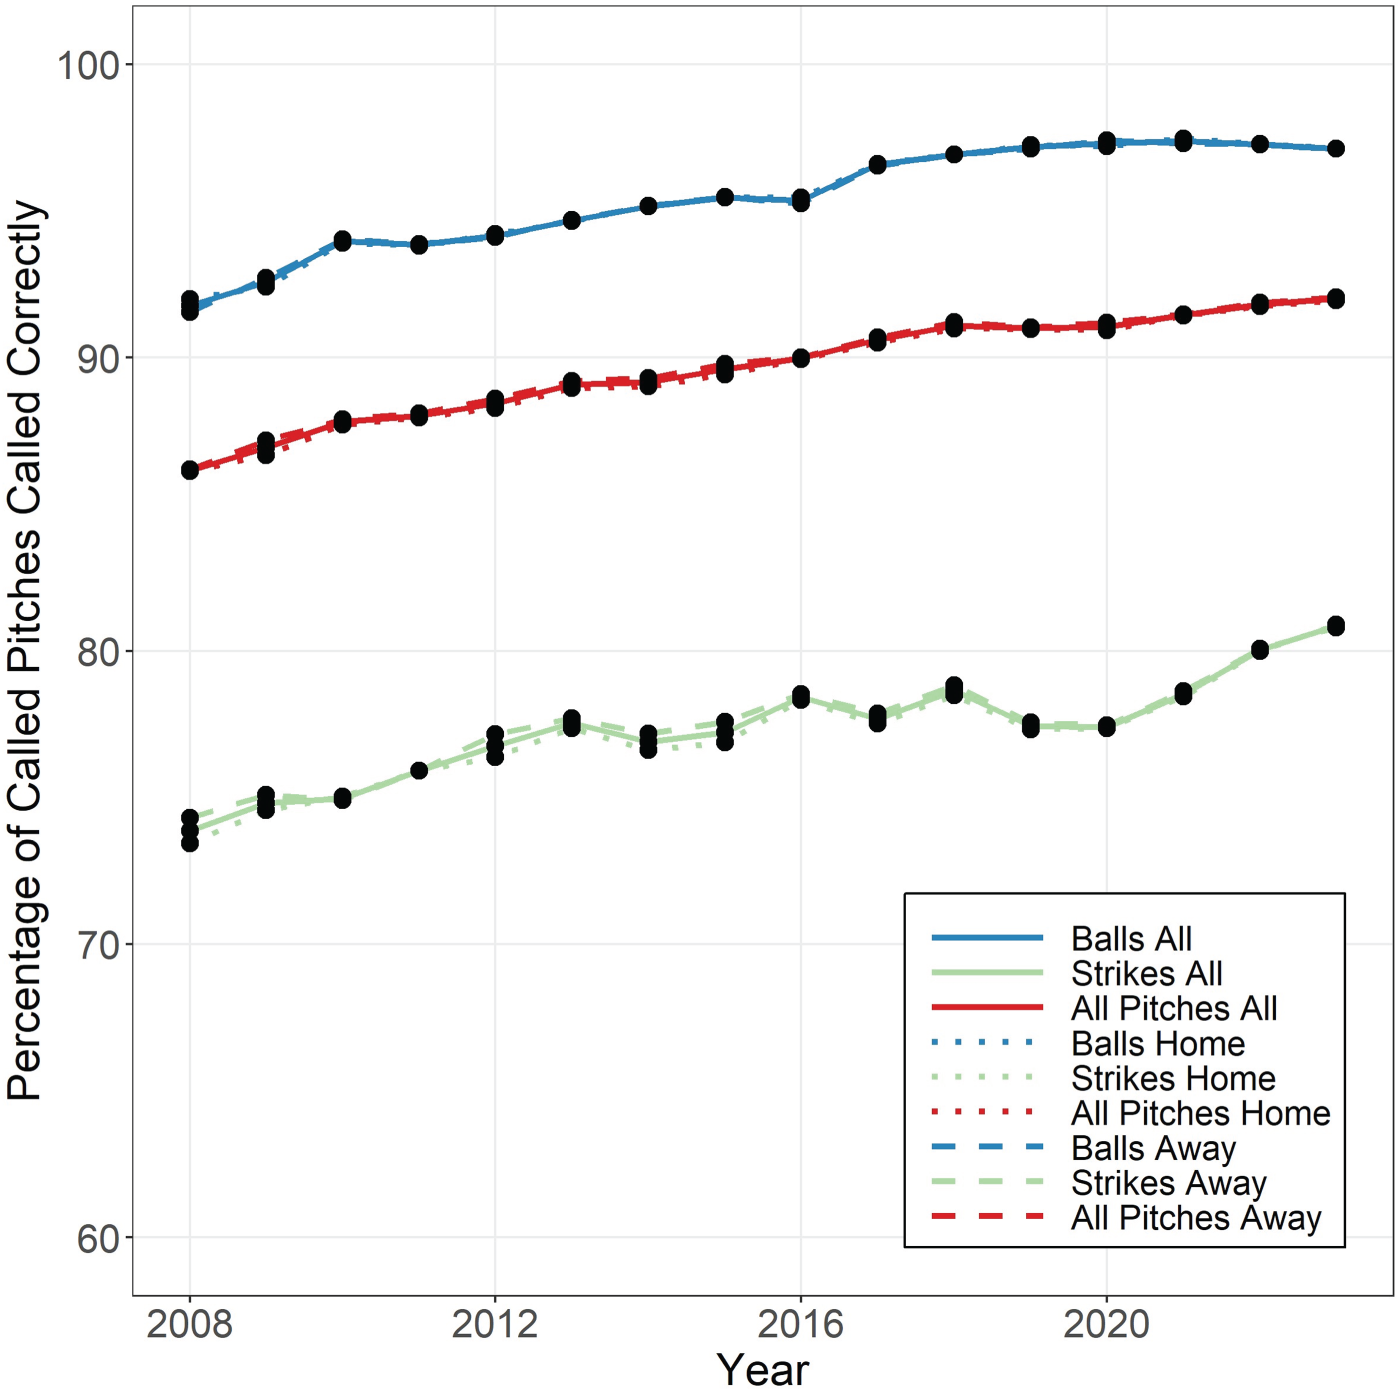
Year-specific accuracy (percentage of called balls and called strikes called correctly) for years 2008–2023, over all pitchers and parsed by home/away status of the pitcher.
Within-game consistency
Hunter's convex hull consistency index for called balls, CCH, averaged over all games in a given year, is plotted against year in Figure 10 (left plot). Profiles of the index are included for all batters and also broken down for right-handed and left-handed batters considered separately. The index is consistently higher when parsed by batter handedness than when it is not, and is consistently higher for left-handed batters than right-handed batters. Improvements over the entire time period are seen for all three groups of batters, but they are greatest in an absolute sense when batters are not separated by their handedness. MannKendall tests for trend are highly significant (P < 0.00001) for all three groups. Results for the consistency values calculated using the α-convex hull method, CACH, are shown in the right plot of Figure 10. Similar to CCH, CACH improved dramatically over the study period, with a trend that was again highly significant using a Mann-Kendall test (P < 0.00001). In each year, the α-convex hull consistency measure was considerably larger for left-handed batters than for right-handed batters, but the improvement profiles were roughly parallel over time.
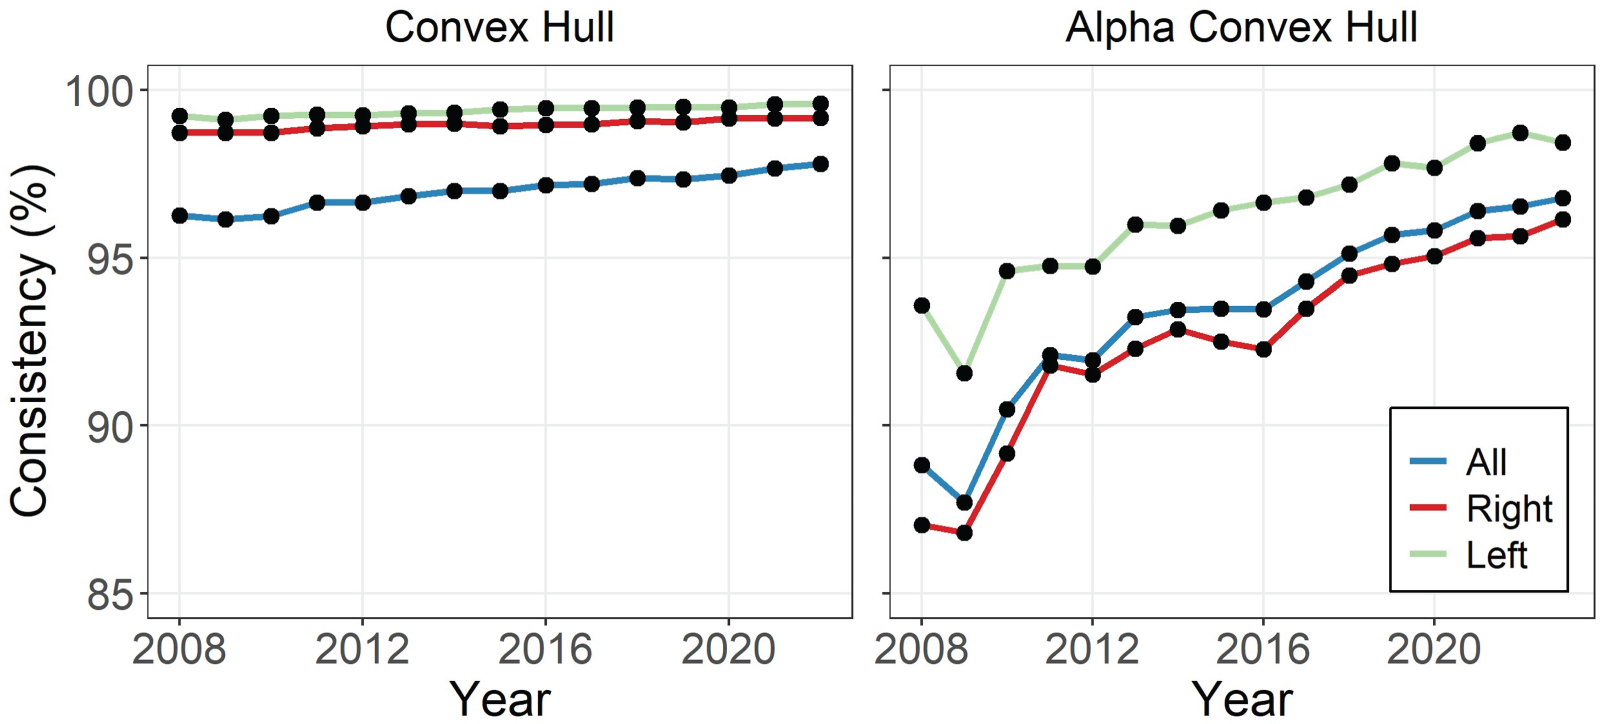
Year-specific within-game consistency metric of called pitches for years 2008– 2023, CCH on left and CACH on right. Both plots include called pitch umpire consistency based on batter handedness as well as the combined overall consistency.
Geometry
Figure 11 displays year-specific CSZs from 2008–2023 obtained using the neural network method described in Section 3.3. Recall that the CSZ is defined herein as the set of points at which the neural network model predicts the pitch to be more likely called a strike than a ball. Rectangular RBSZs are superimposed on the CSZs for purposes of visual comparison. Because the bottom and top boundaries of the RBSZ are batter-specific, for purposes of the display in Figure 11 the lower and upper boundaries of the rectangle representing the RBSZ for a given year are computed as averages of those boundaries of batter-specific RBSZs over all called pitches in that year, and we refer to the RBSZ so obtained as the “average” RBSZ.
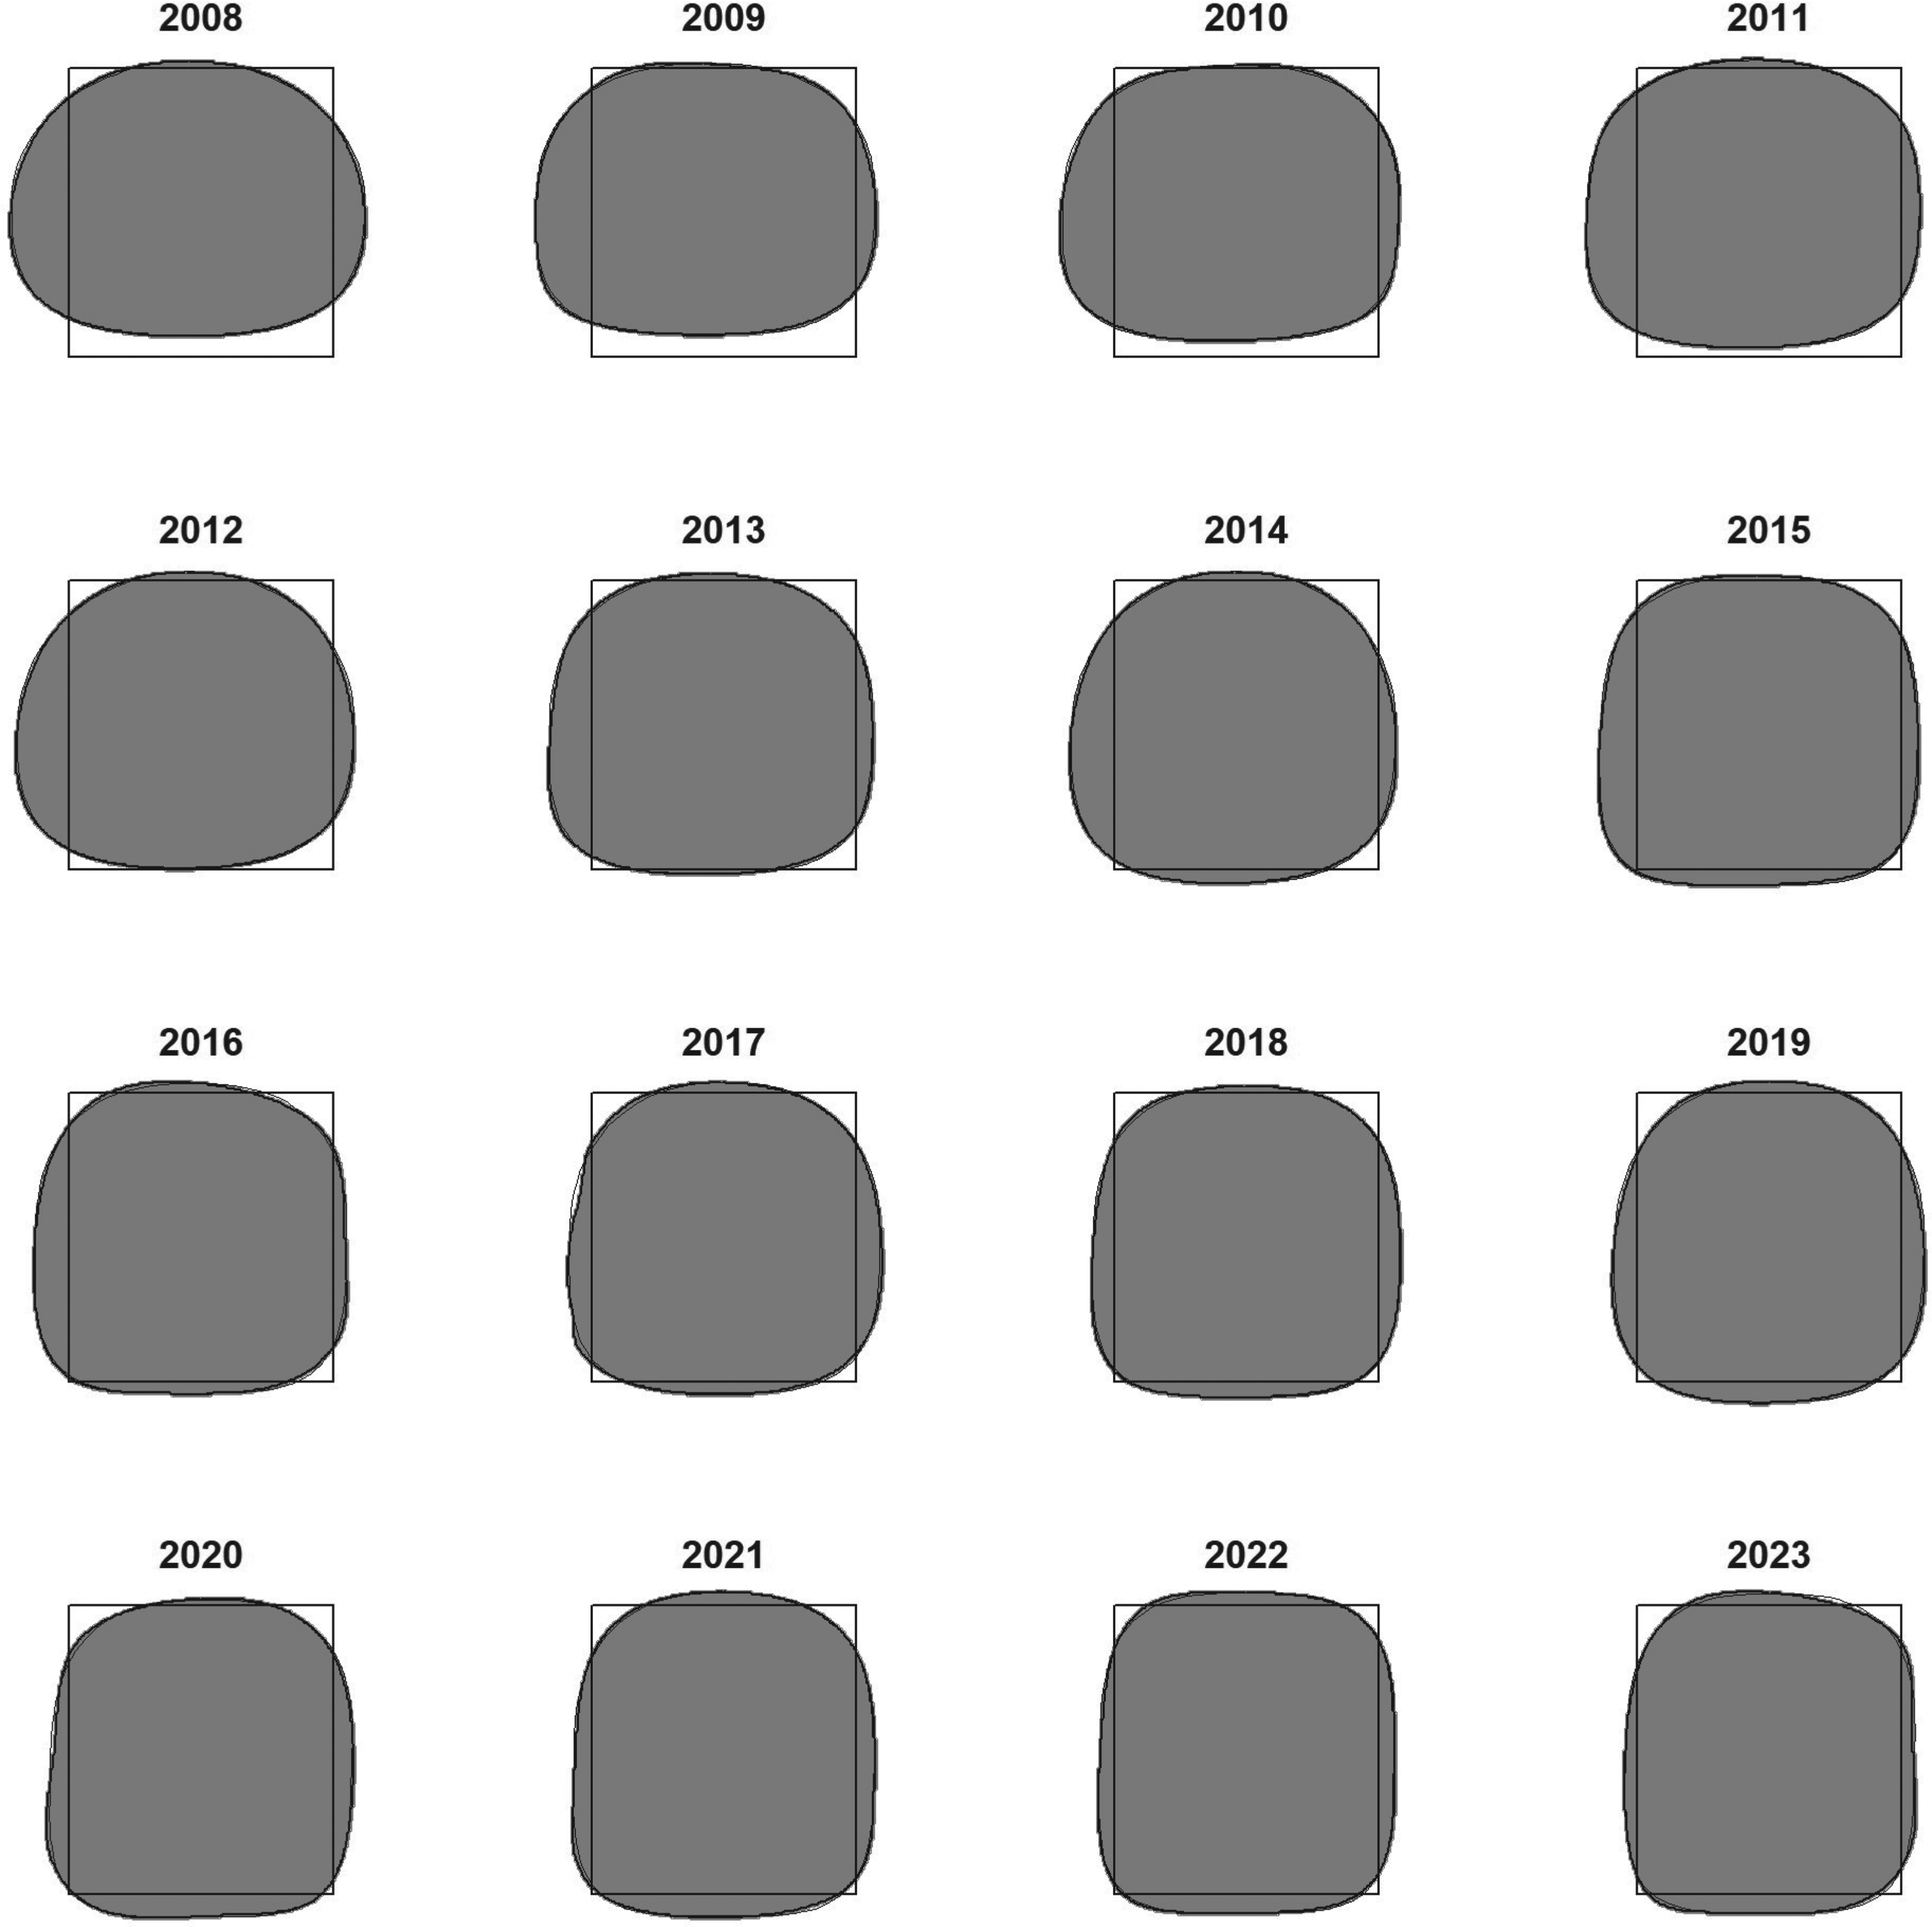
Year-specific called strike zones from 2008–2023. Fitted ATLAS outlines and the average RBSZ are superimposed on each called strike zone for comparison.
It is quite clear that the CSZ's geometry evolved rather smoothly and systematically from 2008–2023, primarily by becoming narrower and taller. In particular, the upper left plot in Figure 11 reveals that the lower extent of the average RBSZ — the so-called “strike at the knees” — was not part of the CSZ at the beginning of the time period, but by 2023 it was almost completely included therein.
Also superimposed on the CSZs in Figure 11 are the corresponding fitted ATLAS models (dark outlines). Plainly, the ATLAS models fit the neural net-determined CSZs quite well for all years. The outline that fits least best is that from 2017, where the ATLAS model is not quite flexible enough to deal with the small but discernible concavity along the left side of the CSZ.
Table 1 lists the estimated ATLAS coefficients, plus area and eccentricity, fitted to the year-specific CSZs displayed in Figure 11, with the corresponding average RBSZ values provided for comparison. P-values of Mann-Kendall tests for monotonic trend are provided for each parameter over time periods 2008–2016 (the “PITCHf/x era”) and 2017–2023 (the “Trackman era”). Figure 12 displays plots of the estimated ATLAS coefficients against year. From these plots, several trends in the geometric attributes of the called strike zone are evident and may be summarized as follows.
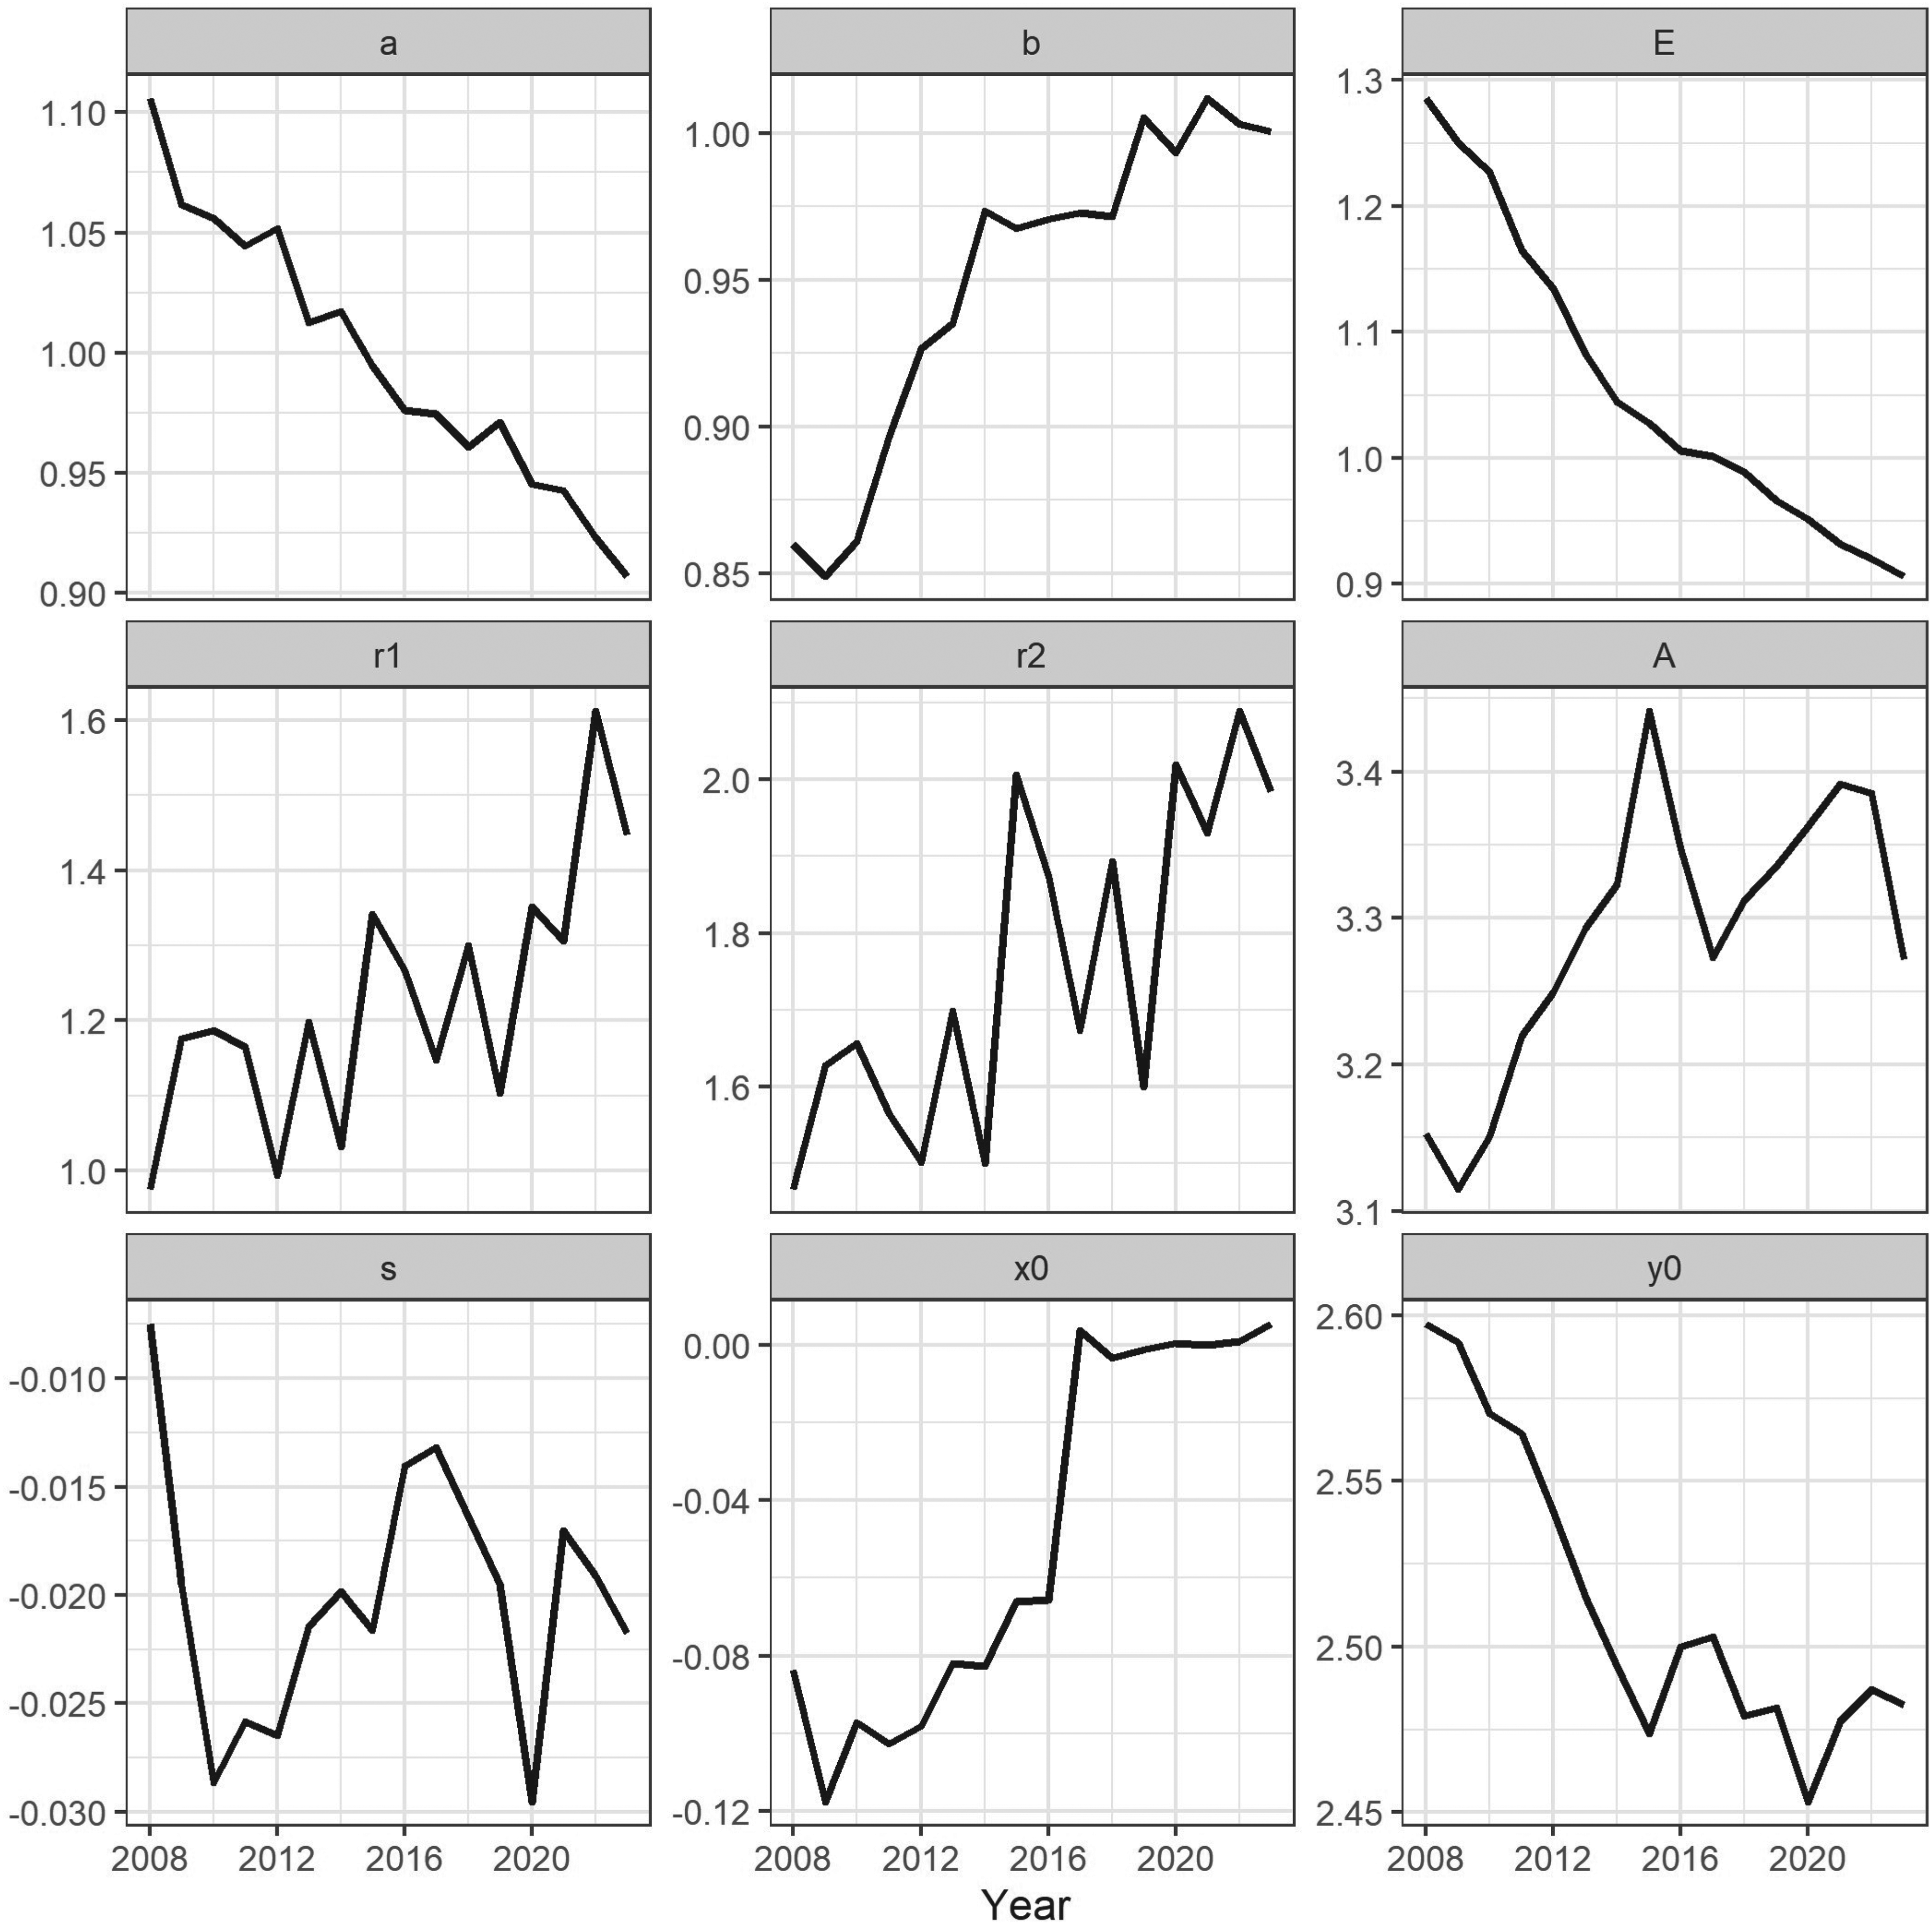
Fitted ATLAS coefficients of year-specific called strike zones plotted against year, from 2008–2023.
Fitted ATLAS coefficients, plus eccentricity and area, of year-specific called strike zones from 2008–2023. Units of a, b, x0, and y0 are feet; units of A are square feet, and the remaining coefficients are unitless. The corresponding average RBSZ values are provided for comparison. P1 and P2 are two-sided P-values of Mann-Kendall tests for monotonic trend over time periods 2008–2016 and 2017–2023, respectively. The trends that are significant at the 0.05 level, and their signs, are indicated by italicizing the P-value for a positive trend and bolding it for a negative trend.
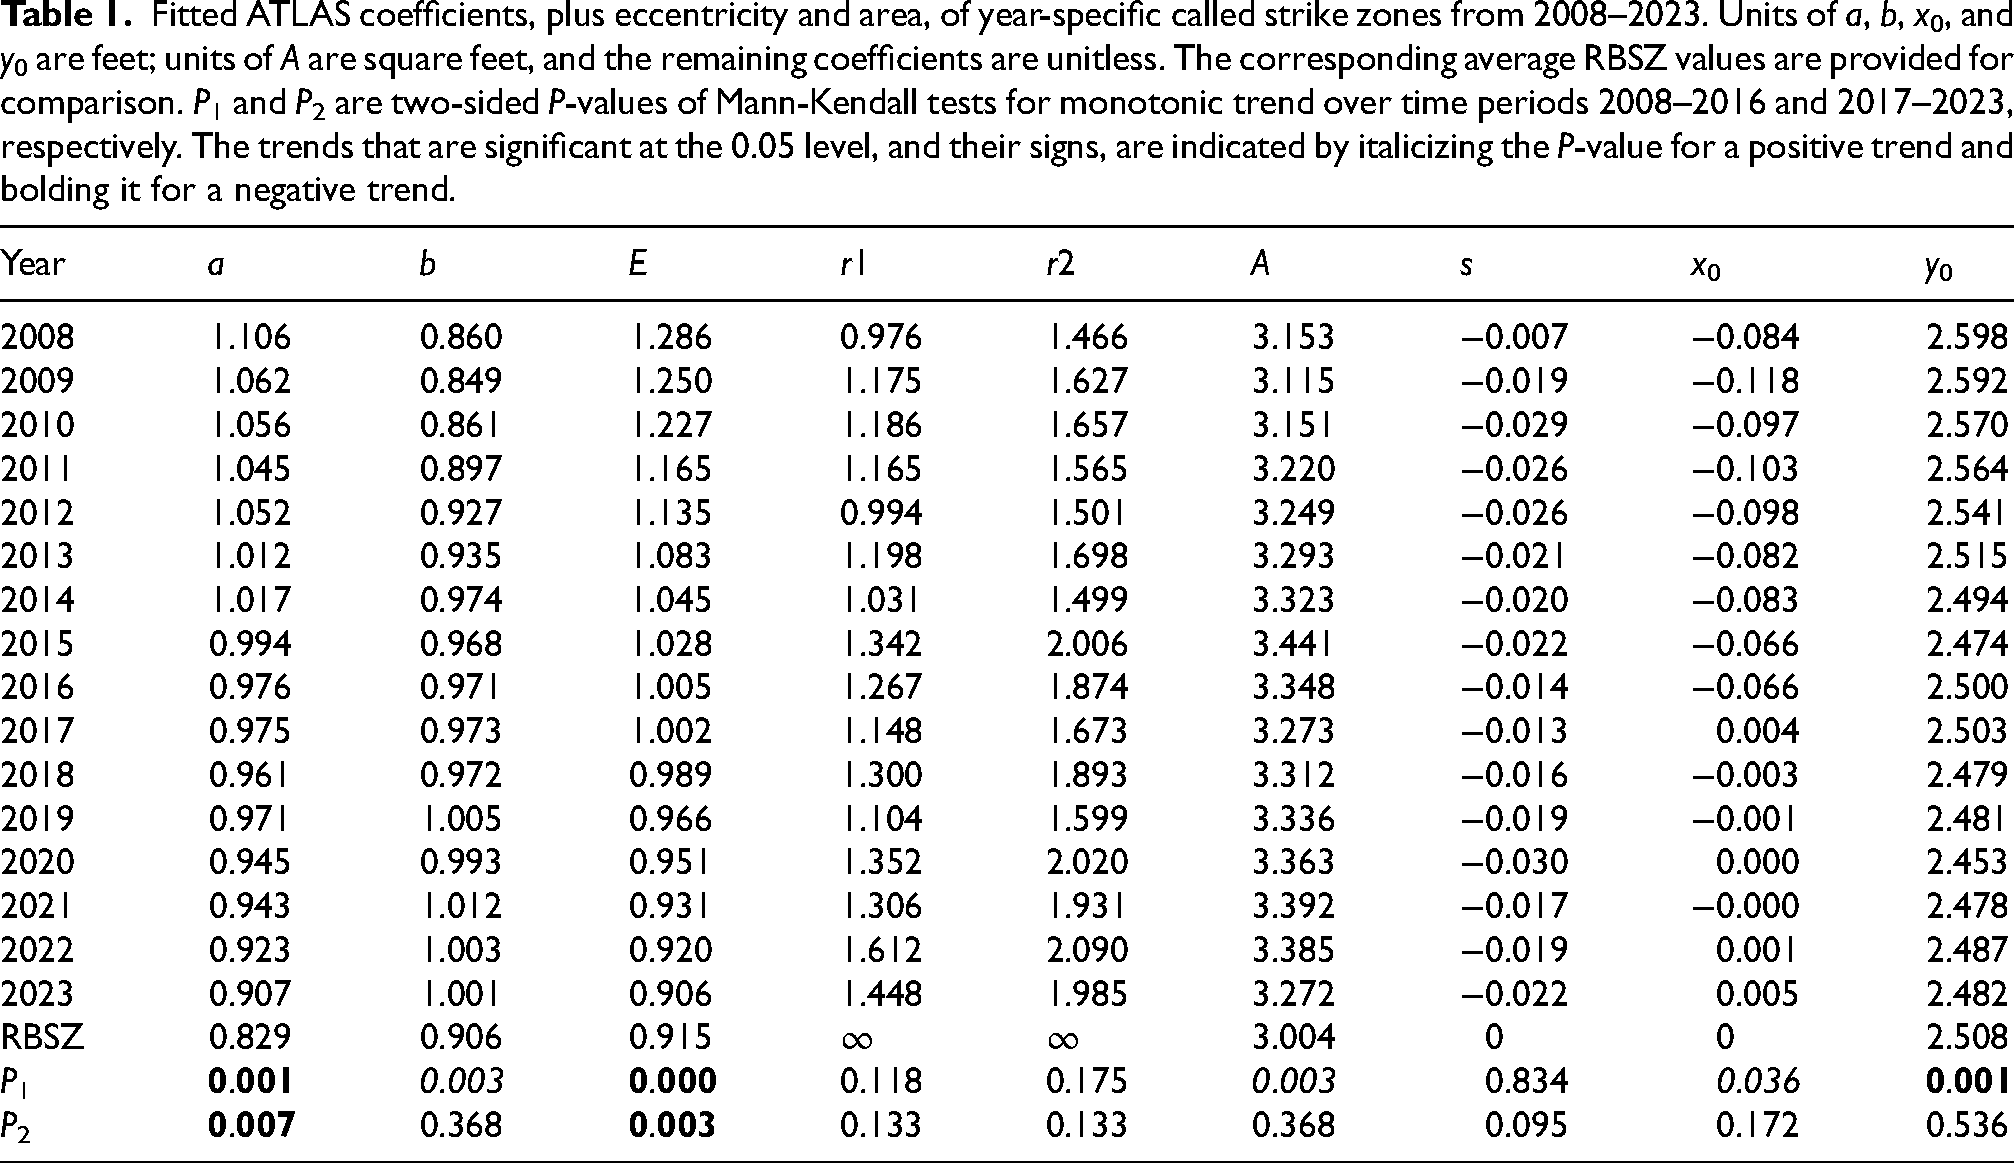
Width, height, and eccentricity. The maximum width of the CSZ, which was more than 30% greater than the width of the RBSZ in 2008, decreased steadily over the entire time period. By 2023 the CSZ was almost 5 inches narrower than it was in 2008, though it was still significantly wider at its widest point than the RBSZ (by about 10%). The maximum height of the CSZ was significantly smaller than that of the average RBSZ in 2008; it increased steadily after that, but most especially over the PITCHf/x era. Most of this increase occurred as a result of its extension into the lower reaches of the RBSZ and beyond. By 2023 the CSZ was significantly taller at its tallest point than the average RBSZ, also by about 10%.
Consequently, the eccentricity of the CSZ, which was much larger than that of the average RBSZ in 2008, by 2023 was in near-perfect agreement with it.
Rectangularity. The general trend in the rectangularity indices was upward over the entire time period, implying a more rectangular CSZ over time, although the increase in neither index was monotonic. The bottom-half rectangularity index was consistently 35–50% larger than its top-half counterpart, implying that the top half consistently had more rounded corners. The bottom-half index increased most over the PITCHf/x era, while the top-half index increased considerably over both eras. All of these trends were statistically significant when considered over both eras, except for height over 2017–2023. Neither index had a significant monotonic trend over either individual era. However, both attained significance when considered over the entire period, due to greater power of the Mann-Kendall test for detecting trend over 16 years compared to only 9 or 7.
Area. The aforementioned increases in the CSZ's height and rectangularity (the latter leading to increased expansion into the corners) resulted in a statistically significant increase in its area over the first half of the time period, despite the concomitant decrease in width. However, after 2014 there was no consistent trend in the CSZ's area. The area of the CSZ was larger than that of the RBSZ over the entire time period; in 2023, in particular, it was about 10% larger.
Shear. The CSZ's shear parameter was quite small over the entire time period and did not exhibit any consistent trend. Thus, the CSZ was consistently aligned quite closely with the standard horizontal and vertical axes.
Horizontal and vertical centers. There was a general, statistically significant rightward shift of the horizontal center of the CSZ from 2008–2017, including a big jump in 2017, to essentially the exact center of the plate. The horizontal center remained there after 2017. The CSZ's vertical center moved steeply and statistically significantly downward from 20082016, after which it did not exhibit any consistent trend. It became commensurate with the average RBSZ's vertical center in 2014. Thus, proper centering of the CSZ occurred by 2017 and did not change appreciably after that.
Discussion
We have shown in this article that several metrics of umpire performance and fidelity of the CSZ to the RBSZ improved markedly from 2008–2016 and continued to do so from 2017– 2023, albeit more slowly. In particular, umpires improved in their accuracy in both called balls and called strikes. Two trends, which might be called the “heightening strike zone” and the “vanishing lefty strike,” were mainly responsible for these improvements. The first of these refers to the extension of the called strike zone both below and above where it was in 2008 and was most pronounced over the first half of the study period. The extension of the lower boundary has been well-documented (e.g., Roegele (2014) and Brodie (2016)); that of the upper boundary less so. The lefty strike (Roegele, 2013) refers to a called strike to a left-handed batter that just misses the outside of the plate and lies between the top and bottom boundaries of the RBSZ. Figure 13 shows that in 2008, only 28% of pitches in that region, taking its width to be the maximum width of a baseball (2.94 inches), were correctly called balls, while by 2023 that percentage had increased to 71%. The increase in correct ball calls in that region (and concomitant decrease in incorrect strike calls in that region — hence the term “vanishing” lefty strike) was highly statistically significant and considerably larger than the increase in correct calls in any of the three complementary regions (pitches that lie just to the inside of the plate to lefthanders, and just to the inside and outside of the plate to righthanders). There was a noteworthy jump from 2016 to 2017 in the region just to the inside of the plate for righthanders, but this might not be completely attributable to better umpire performance (see below).
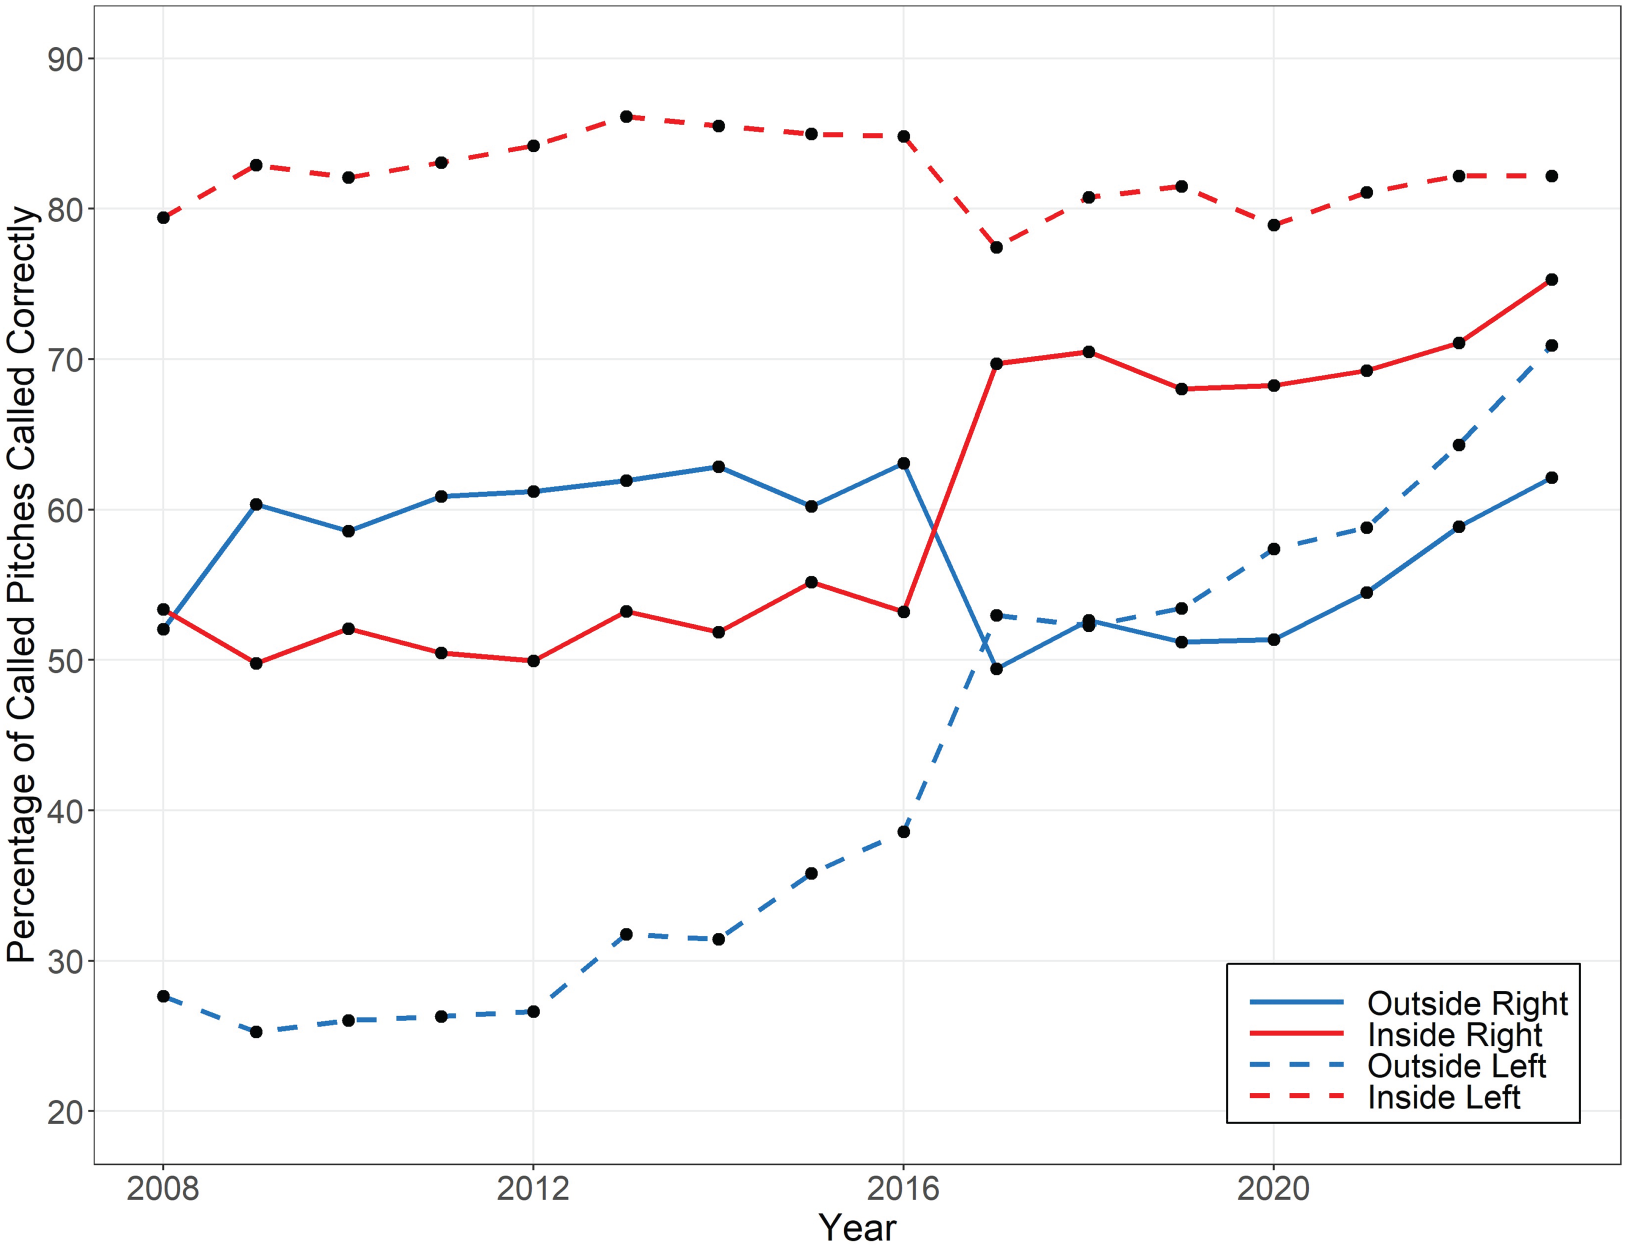
Year-specific accuracy (percentage of called pitches called correctly) from 2008– 2023 within four rectangular regions lying just to the inside and outside of the RBSZ, for batters of each type of handedness.
As mentioned in the Introduction, not all of the increase in our accuracy metrics may be due to an improvement in umpire performance. Changes in the measurements systems themselves could have contributed also. The transition from PITCHf/x to Trackman, which took place from 2016 to 2017, resulted in a completely different method for determining the vertical extents of the RBSZ and the location of each called pitch. For PITCHf/x, the vertical extents of the RBSZ were determined by a human camera operator and varied across at-bats of the same batter more than could reasonably be expected by variations in the amount that the batter crouches or how high he wears his pants, though it is possible that operators improved over time within the PITCHf/x system. In the Trackman system, the technology for recording the vertical extents was automated and probably less error-prone than PITCHf/x. As for the two systems’ accuracies of recording the location of a called pitch, the literature is somewhat equivocal. While it might be natural to expect that the more advanced technology of Trackman would result in smaller measurement errors, Nathan (2012b) stated that the systems’ measurement errors were comparable, and Arthur (2017) even provided evidence that Trackman's errors were larger, at least initially; see also Schifman (2018). To our knowledge, concurrent data from the two systems that could be used to calibrate one system against the other are not publicly available. In summary, it must be admitted that some of the perceived improvement in umpire accuracy may be due to improvements in the measurement system itself. But in light of the improvements in umpires’ within-game consistency and in the geometry of the called strike zone relative to the RBSZ, neither of which are susceptible to the aforementioned issue with the vertical extents of the RBSZ, we believe it is reasonable to attribute most, if not all, of the changes in accuracy over time to actual improvements in umpire performance.
A more in-depth understanding of the increase in umpire accuracy from 2008–2023 is gained by studying how the geometry of the called strike zone evolved during this period, in reference to the RBSZ. We found that proper centering of the CSZ at the center of the RBSZ, both horizontally and vertically, occurred by 2017, and that subsequently the center changed imperceptibly little. The overall shape of the CSZ in each year was that of an affine-transformed latitudinally asymmetric superellipse (ATLAS), aligned quite closely with the standard horizontal and vertical axes, whose size and shape parameters evolved over time. As noted above, the CSZ's height increased substantially, while its width decreased by proportionally the same amount. These changes were virtually monotonic, with about two-thirds of the change in magnitude occurring from 2008–2016 and one-third after that. By 2023, both the height and width of the CSZ, as well as its area, were about 10% larger than those of the (average) RBSZ. The CSZ became more rectangular in shape over time at both its upper and lower extents, though not monotonically so, and the corners in its upper extent were consistently more rounded than those in its lower extent.
Umpires also improved from 2008–2023 in two metrics for within-game consistency. Within game consistency is something quite different than accuracy but is arguably just as important to managers and players, so it is perhaps not surprising that it improved over the time period just as accuracy did. Both metrics for within-game consistency were higher for left-handed batters than right-handed batters, for which we have no plausible explanation; however, the degree of improvement over time was similar for both groups.
It seems likely that the trends in umpire performance and the geometry of the CSZ documented herein affected some aspects of the game, but establishing direct causal links is challenging. Whalen, Matthews and Mills (2024), using multivariate changepoint analysis techniques, identified 2008, give or take a year, as the beginning of a new era in baseball, where eras are demarcated by statistically significant changes to some metric(s) of on-field performance. The metrics primarily responsible for the 2008 changepoint were the average number of strikeouts per game and the average number of hits per game. The former, which had ranged between 6.0–6.5 for many years prior to 2008, suddenly began to increase steeply in 2008 and continued to increase through 2023, by which time it was 8.6 (Source: www.baseball-reference.com/leagues/majors/bat.shtml). The latter ranged from about 9.0 to 9.3 prior to 2008 but then began a steady decrease to about 8.3 in 2023. Note that these changes began during the significant expansion of the called strike zone from 2009–2015, but continued even after the expansion abated in 2016. However, two other performance metrics, namely the average number of home runs per game and runs scored per game, decreased from 1.0 and 4.65 to 0.86 and 4.07, respectively, over 2008–2014, but thereafter increased, to 1.21 and 4.62, by 2023. Thus, run production had returned to almost pre-2008 levels by 2023. For the period from 2008–2014, Mills (2016) showed convincingly that 28– 43% of the decline in run production could be attributed to the downward migration of the lower boundary of the CSZ. Clearly, since run production rebounded after 2014 while the lower boundary continued to extend downward, other factors must be involved. Our analysis makes no attempt to establish a causal link between changes in umpire performance or the geometry of the called strike zone and changes in strikeout rates, run production, or other factors over time, but it does suggest some plausible hypotheses that could be investigated in future work.
We noted earlier that current levels and trends in umpire performance should inform the type of automated ball-strike system that Major League Baseball chooses to implement, as well as the timing of its implementation. The fact that the error (misclassification) rate of umpires in calling balls and strikes still exceeds 8%, even after more than 15 years of training, feedback, and incentives suggests that there is indeed a need for some type of automated system, unless the perceived advantages of human umpires (of which there are several, see for example Greene (2021)), are regarded as more important than near-elimination of errors on ball-strike calls. Furthermore, our finding of continual and substantial improvement in the performance of human umpires from 2008–2023 suggests that the implementation of a challenge system (as an alternative to a fully automated system) is likely to be much less disruptive to game flow now than it would have been in 2008. Still further, the recent attenuation in the rate of improvement in human umpire performance suggests that further improvements are likely to be relatively small and/or a long time coming. If the implementation of a challenge system is inevitable, which seems to be the case, then in our opinion these results support putting it into effect without delay.
The successful implementation of a challenge system for line calls in professional tennis in 2006 provides, perhaps, a relevant comparison for conjecturing how well a challenge system would work in baseball at current levels of umpire performance. In tennis, each player is allowed three unsuccessful challenges per set. One study (Mather, 2008) estimated the error rate of line judges for balls within 10 cm of a line to be about 8%. That same study determined that in an evenly contested set consisting of 10 games with 5 points per game, where in a worst-case scenario each point involved a ball within 10 cm of a line that had to be called by the line judge, the judge would make no more than about 4 errors (two-thirds the number of unsuccessful challenges permitted between the two players). Another study (Abramitzky et al., 2012) revealed that fewer than 3% of points were actually challenged. This, plus the fact that only 30–40% of challenges are successful, suggests that the expected number of challenges in a set is small enough to prevent major disruption of the flow of a match (it takes only about 20–30 s after a challenge is initiated for the outcome to be displayed on a screen), and indeed this appears to be the prevailing view among tennis players and fans. In baseball, the number of called pitches in a typical game is about 140 (a number we obtained by dividing the total number of called pitches in the combined PITCHf/x and Trackman dataset by the number of games). Taking the overall pitch misclassification rate to be 8.2%, its value in 2023, we expect on average about 11.5 pitches per game, i.e., slightly more than one per inning, to be called incorrectly. Even if all of these pitches were challenged, it is unlikely that the game would be significantly disrupted or delayed because it would probably take just a few seconds to process the challenge (Trackman itself takes less than a second to determine whether the pitch is a ball or a strike). Thus, from the standpoint of preventing disruption or delay, it appears to us that a challenge system for ball-strike calls in Major League Baseball is likely to be successful.
Footnotes
Acknowledgements
Riley Post was supported by The Iowa Flood Center within the University of Iowa and Stanford University.
Declaration of interest
The authors declare that they have no known competing financial interests or personal relationships that could have appeared to influence the work reported in this paper.