
Abstract
This study identified roster-formulation strategies in the Indian Premier League (IPL) auction and explored relationships to team performance. Using data from 127 team-seasons across 16 IPL seasons, teams were clustered into strategic groups based on 27 standardized features, including spending patterns, player attributes, and retention behaviors. Three distinct groups emerged from the cluster analysis. These clusters primarily differed in spending behavior, salary distribution, and player characteristics. Regression analyses indicated minimal short-term relationships between a team's cluster assignment and its subsequent winning percentage or playoff qualification, although a few multi-year sequences displayed significant effects in relation to a baseline strategy. The observedly weak links between labor market strategy and team performance are likely due to the league's auction-based labor market and structural regulations that promote competitive parity. These results provided insights into strategic planning under salary constraints and potential links to team performance.
Introduction
The Indian Premier League (IPL) operates as the world's most financially lucrative cricket league, with viewership and revenues that rank among the highest in world sport (Majumdar, 2011). In 2022, the league—which utilizes an abbreviated Twenty20 (T20) format with single innings restricted to 20 overs (Ray and Roychowdhury, 2021)—was valued at nearly $11 billion; in 2023, the IPL was able to agree to a 5-season, $6.4 billion deal for the sale of its domestic media rights (BBC News, 2022). In addition, estimates from the league's governing body, The Board of Cricket Control for India (BCCI), suggest the IPL contributes nearly $150 million to India's GDP, further highlighting the economic importance of the league to a country that has long served as a hotbed for cricket fandom and talent (Shankar, 2021). Each season, the involved franchises compete in a group-stage, round-robin tournament before entering a playoff that decides the eventual champion. There are significant financial rewards for winning the title and finishing higher in the standings, and intense regional rivalries ensure the glory and pride of victory are noteworthy among fans and other stakeholders (Ray and Roychowdhury, 2021; Singh and Sharma, 2023). As such, success on the pitch is economically beneficial to IPL teams.
The performances of sports teams are often viewed as functions of playing talent. In settings where labor market regulations are less restrictive, and franchises are economically incentivized to win, player salaries frequently serve as a measure of talent (Kahn, 2000; Rosen and Sanderson, 2001; Hall et al., 2002). In the IPL, there exists a unique auction system that regulates player acquisitions, squad composition, and salary determination among the competing clubs. Each offseason, eligible domestic (Indian) players and international players enter an auction with a stated salary (base value) that, depending on demand, teams can match or bid higher for. Players are pooled together based on their skillsets (e.g., batsmen, bowlers, and all-rounders are in separate pools), and teams start bidding on players at their respective base values until the highest bid is reached. Before each auction, teams are entitled to retain a specific number of players for their salaries from the previous season's contract. This allows teams to maintain some continuity of their roster across seasons. Restrictions on the labor supply include Right to Match (RTM) options that teams can use to match another club's winning bid for a player that was on their roster the prior season, a minimum and maximum number of players that must be purchased across each position, and a cap (ceiling) on the total amount that teams can spend during the auction. Depending on the season, the auction format also varies between a series of “mini” and “mega” auctions. Mini auctions occur most frequently and involve fewer players, while mega auctions involve more players and typically occur every four seasons. Combined, these mechanisms contribute to frequent roster turnover while limiting player compensation and the number of players that can be rostered.
As such, the IPL provides a viable forum for exploring teams’ roster-building strategies and their relationships to on-field performance in a unique labor market setting. To this point, prior studies in cricket have primarily focused on deciding the playing 11 based on opponent characteristics (Gokul and Sundararaman, 2023), the determinants of players’ auction prices (Dey et al., 2014), or the creation of optimization tools that can help teams adjust players’ values in real time (Singh et al., 2011). In this study, we attempt to categorize the strategic approaches taken by IPL teams in the auction using k-means clustering to segment teams based on their approaches to player acquisition and roster construction. We then link members of the resulting clusters to a series of performance outcomes that attempt to capture the relationships between teams’ labor market actions and on-field achievements. In doing so, we explore the following research questions:
In addition to guiding cricket strategy, our findings are intended to provide new insights into the relationship between labor market actions and team performance in dynamic auction settings with roster and spending limitations.
Literature review
Sport labor markets
In professional sports labor markets with relatively few constraints, teams that invest the most in playing talent tend to perform better over time (Hall et al., 2002; Szymanski, 2014). When earnings are tied to performance and revenue redistribution is limited, successful teams can secure repeated dominance through a combination of winning and shrewd spending (Michie and Oughton, 2004; Pifer et al., 2018). However, in environments with lower information availability, stricter labor market controls, or increased revenue sharing, these relationships may be less apparent (Hall et al., 2002). Even then, some teams benefit from being in larger markets, being early movers in a league, or from favorable league policy changes and historical factors (Pifer et al., 2018). For teams lacking these advantages, greater discernment and efficiency are needed to optimize performance relative to labor market expenditures.
Labor market structures in professional sports—such as salary caps, free agency restrictions, revenue-sharing models, and auction-based labor systems—have been widely implemented with the intention of promoting competitive balance and ensuring long-term financial sustainability. However, a growing body of empirical research suggests that these mechanisms often result in wage inefficiencies and distorted player valuations. Hall et al. (2002), in a comparative analysis of Major League Baseball (MLB) and English soccer, found that MLB's salary arbitration and free agency policies suppressed compensation for younger players, while English soccer's open transfer system enabled financially dominant clubs to acquire elite talent with greater ease. In markets where stronger correlations exist between team finances and competitive outcomes, smaller clubs have been shown to offset financial disadvantages through superior scouting, player development, and resource management (Feess and Muehlheusser, 2003; Michie and Oughton, 2004; Pifer et al., 2018). Conversely, in more regulated environments such as the National Basketball Association (NBA) and National Hockey League (NHL), salary caps and contract restrictions have produced unintended consequences—including the proliferation of luxury tax loopholes and backloaded contracts—that obscure the true economic value of players (Kahn, 2000; Zimbalist, 2001). In the National Football League (NFL), labor regulations are further intensified by rookie wage scales and franchise tags that limit the earning potential of younger or high-performing athletes and restrict their access to open-market valuations (Szymanski and Ross, 2002). Although these rules are often defended as instruments of competitive parity, several scholars contend that they primarily serve to preserve larger revenue shares for team owners and administrators (Chakravarthy, 2012). Vrooman (2009) reinforces this argument, framing salary caps and revenue-sharing frameworks as tools of monopsonistic control that reduce wage dispersion and suppress market-driven compensation, thereby consolidating financial power within league ownership structures.
The IPL operates beneath a distinct, auction-based labor system that introduces its own set of unique labor market constraints. The auction format sets salary constraints within a structured bidding process that sees teams simultaneously bid on players until a high bid is achieved and the player is signed at the highest bid amount. In addition, foreign player quotas limit international recruitment and influence salary distribution strategies (Parker et al., 2008; Chittibabu and Sundararaman, 2023). Although these policies aim to prevent financial overreach and maintain local talent development, they constrain player movement and suppress wages relative to an open-market system (Dey et al., 2014; Malhotra, 2022). Similar inefficiencies have appeared in Major League Soccer (MLS) and European soccer, where designated player rules and Financial Fair Play regulations meant to curb excessive spending have instead reinforced financial imbalances by favoring the historically wealthier clubs (Michie and Oughton, 2004; Szymanski, 2014; Pifer et al., 2018).
Restrictive labor markets also shape consumer perceptions of fairness and competitive integrity, impacting fan engagement and rivalry-driven market dynamics. Fans often view salary cap violations, transfer bans, and other labor-related punishments as safeguards to competitive balance; however, some fans view these as being favorably biased toward specific teams (Watanabe et al., 2019). In leagues with rigid labor controls, teams must rely on scouting, strategic efficiency, and disciplined financial management, placing greater emphasis on long-term sustainability rather than short-term spending (Havard and Hutchinson, 2017). However, as professional leagues continue refining labor policies, finding a balance between financial sustainability, competitive parity, and market-driven player valuation remains an ongoing challenge (Berendt et al., 2024).
Labor market challenges and opportunities in cricket
The “Moneyball” phenomenon chronicled one of the first major applications of data analytics in sports, demonstrating that competitive teams could be built using efficient labor market strategies (Lewis, 2004). Billy Beane, then general manager of MLB's Oakland Athletics, observed that players’ salaries were not directly proportional to their on-field contributions (Hakes and Sauer, 2006). By identifying statistics that more accurately reflected run production, Beane exploited the labor market to acquire undervalued talent, giving his team an edge over wealthier rivals. Despite having one of the lowest payrolls in the league, the A's achieved a 20-game win streak in 2002 and secured four consecutive postseason berths from 2000 to 2003 (Lewis, 2004).
While the Moneyball approach proved effective in MLB, extending it to other sports, including cricket, has been more challenging. Gerrard (2007) identified three main barriers—conceptual, technological, and cultural—that complicate the adoption of data-driven strategies in sports. The technological barrier refers to teams needing the tools and resources to track player actions and movements. The conceptual barrier involves the need for a framework to analyze large volumes of player performance data, particularly in team sports where individual contributions are interdependent. The cultural barrier relates to the reluctance of decision-makers to integrate statistical analyses with their personal judgments (Gerrard, 2007). Despite a recent influx of resources and the more individualistic nature of cricket easing some of these constraints, a cultural shift toward fuller integration of data analytics in cricket remains elusive.
Nevertheless, professional cricket has begun incorporating data analytics into on-field decision-making and strategy formulation. Scholarly research has also started to explore the sport using machine learning algorithms and predictive models to forecast match outcomes across various cricket formats (Anik et al., 2018; Barot et al., 2020; Wickramasinghe, 2020; Senevirathne and Manage, 2021; Kapadia et al., 2022). Some studies have even developed models that predict match outcomes, analyze team structures, and recommend player signings. For example, Jayanth et al. (2018) used support vector machines to rank professional cricket players and followed this up with a k-means clustering algorithm to group similarly ranked players. The features included batting performance metrics such as batting average and strike rate, along with bowling performance metrics such as economy rate. They also incorporated team-level statistics such as general batting and bowling averages to contextualize individual performance within a broader competitive framework. These specific features were selected to highlight player effectiveness, consistency, and match impact. Davis et al. (2015) introduced a metric called “expected run differential” in T20 cricket to more accurately evaluate player skill, measuring the additional runs a player contributes relative to a standard player. More recently, Gokul and Sundararaman (2023) used player-level batting (e.g., batting strike rate and batting average) and bowling metrics against upcoming opponents to develop a single metric to help determine the optimal playing 11. Santhosh et al. (2023) developed a player performance index that combined such key batting and bowling metrics as batting strike rate, batting average, and economy rate. Altogether, these studies provide evidence of analytical procedures being utilized in cricket.
Outside of cricket, research in other sports has highlighted strategies that may be useful for acquiring talent in regulated labor markets. In MLB, Humphrey et al. (2009) showed that teams investing more financial resources in players who were “core role holders” were able to improve team performance. Operating under the assumption that players’ roles within a team have differential impacts on performance, analyses showed that pitchers’ and catchers’ career experience and job-related skill were more strongly related to teams’ winning percentages than “non-core” role holders with similar traits. In addition, “… teams that invested more financial resources in core roles significantly outperformed those teams that did not leverage their assets as effectively” (Humphrey et al., 2009, p. 57). Hall et al. (2002) found that MLB teams’ winning percentages regressed on payroll expenditures relative to the league average only accounted for an R2 of 0.24, while in English soccer—where the labor market has historically contained fewer regulations—the R2 between league rank and relative payroll spending was 0.74. Shifting to the NFL, where a hard salary cap limits what teams can spend on players, Mondello and Maxcy (2009) found a positive relationship between payroll increases and team performance and a negative relationship between salary dispersion and performance. As the coefficient of variation used to measure payroll dispersion within a team increased, teams’ winning percentages tended to decline significantly. Roach (2018) found that losses of offensive talent, as measured on a per-salary-cap-dollar basis, more negatively affected team performance relative to losses of defensive talent. Losses of salary cap resources devoted to offensive linemen and quarterbacks had a higher marginal impact on team performance. Nonetheless, analyses of these types within the context of professional cricket—specifically the unique auction market of the IPL—have been limited to this point.
Research on player valuation and labor market auction strategies in cricket
Auction theory is a branch of economics that analyzes how different auction designs influence bidding behavior and the resulting outcomes (Milgrom and Weber, 1982). The IPL auction introduces a unique market dynamic where information asymmetry and bidding strategies significantly influence labor market outcomes. The league's auction follows an open, ascending-bid format where private and public valuations often affect the final bid. Teams with advanced data analytics capabilities can better assess a player's value by considering historical performance data, injury records, and expected future contributions. Informed bidding allows teams to optimize their rosters by acquiring undervalued players or outbidding rivals for key targets. IPL teams, therefore, can use a mix of tangible (e.g., financial resources) and intangible (e.g., management experience) assets to formulate auction strategies that outmaneuver competitors and acquire players who provide the most value. Following from the theory of the resource-based view of the firm (Makadok, 2001; Teece et al., 1997), Gerrard (2007) noted how some sports teams employ effective resource-picking strategies that allow them to carefully select assets (i.e., players) that offer higher quality at a lower cost, while other teams are more adept at capability-building (i.e., developing internal structures that allow these resources to be deployed more efficiently). The latter of these, known as “dynamic capabilities” (Teece et al., 1997), suggests that financial returns in industries featuring frequent change largely depend on the development of technological, organizational, and managerial processes inside the firm.
The IPL's auction process has been studied in a limited number of prior works. In one of the more recent studies, Chittibabu and Sundararaman (2023) proposed a performance-based approach to determine IPL players’ base values in mega auctions, aiming to enhance fairness, transparency, and efficiency in the auction process. By analyzing batting, bowling, and fielding statistics, a two-step method was developed to assign base values that were more reflective of actual, on-field contributions. The first step involved clustering players based on batting, bowling, and fielding performance metrics such as strike rate, economy rate, number of fielding dismissals, and number of dot balls faced. The second step applied an assignment logic to determine the base price within each cluster. In another study, Malhotra (2022) analyzed the economic valuation of cricketers in the IPL and whether pay was associated with performance-related factors. The study found that, on average, batsmen were overpaid relative to performance, while all-rounders and bowlers were underpaid. This finding aligns with one of the cricket industry's more frequently cited anecdotes, “Batsmen win you matches, but bowlers win you tournaments” (Gollapudi, 2017). The study also noted a trend whereby younger, more agile players with experience were favored in the auction, resulting in many overpaid batsmen falling into this category.
Dey et al. (2014) developed analytical hierarchy process (AHP) and artificial neural network (ANN) models to estimate players’ prices in the IPL auction. The AHP measured the weights of the attributes responsible for player price estimation, while the ANN forecasted player prices using the weights calculated by AHP. The models incorporated metrics related to prior IPL performance, match-winning ability, man-of-the-match awards, player age, captaincy experience, international caps, T20 and ODI rankings, fielding ability, and popularity as potential price indicators. The AHP results showed that man-of-the-match awards and matches won carried the most weight in driving auction prices higher. The ANN analysis indicated that while some players were overpaid or underpaid, many received prices that aligned with their optimal potential. In another study, Parker et al. (2008) focused on the IPL's inaugural season, analyzing determinants of players’ auction values. The study found that players with experience in shorter formats were valued more highly, especially when they displayed efficiency in scoring runs.
Chauhan et al. (2018) applied an AHP-ANN model to the IPL auction to develop a performance-based index that quantified batting, bowling, and wicket-keeping skills into a single metric. After accounting for experience, results indicated that marquee players from the IPL's early seasons received higher-than-expected bids, while others, especially those affected by auction spending caps, received less. Singh et al. (2011) noted the limited “mathematical scrutiny” in cricket and devised a study that estimated each player's auction price using metrics such as runs scored, matches played, centuries and half-centuries scored (for batsmen), average wickets taken (for bowlers), previous auction value, base value, age, and captaincy record. Optimization techniques were then used to introduce budget constraints and provide teams with a method for dynamically forecasting auction prices in real time.
Taken together, several trends regarding player selection and valuation in IPL auctions emerged from the literature. First, multiple studies have focused on developing methods to accurately assess player values, often using performance-based metrics to assign base auction values, as seen in Chittibabu and Sundararaman (2023). Disparities in player payments relative to performance have also been noted, with batsmen generally being overpaid while bowlers and all-rounders are underpaid (Chittibabu and Sundararaman, 2023). Studies like Dey et al. (2014) have used complex machine-learning techniques to estimate optimal player prices. Past research has also highlighted the impact of experience, especially in the T20 format, on player valuation in auctions (Malhotra, 2022). Experienced players, even those with injury histories, were often valued more highly (Chittibabu and Sundararaman, 2023). Research has also delved into market dynamics and inefficiencies, exploring how aggressive bidding and spending caps lead to over or underpayment of players (Chittibabu and Sundararaman, 2023). Although various bidding strategies have been analyzed in the IPL auction, few studies have categorized these strategies or thoroughly examined which combinations of strategies yield the best results for IPL teams. While much of the focus has been on auction prices and their alignment with player performance, less attention has been given to the approaches teams use to build their squads and the relationships between these strategies and team performance.
Methodology
Data
The dataset utilized in this study contains 127 observations of IPL team-seasons spanning the 11 teams that consistently appeared in the IPL across the 2009 to 2024 seasons. Some teams, such as the Gujarat Lions, Rising Pune Supergiant, Kochi Tuskers Kerala, and Pune Warriors India, inconsistently participated in the IPL for a small number of seasons, so their team-seasons were not included in the sample. All data, including players’ annual auction prices and performance metrics, were collected from the IPL's official website and ESPN's Cricinfo website and aggregated at the team-season level. For each observation in the dataset, 27 different features were obtained. They are listed and defined in Table 1. Features were included based on suggestions from the prior literature and with regard to roster composition factors such as age, the distribution of wages across and within positions, and the composition of the team in terms of international (Indian vs. non-Indian) and internationally capped players (Mondello and Maxcy, 2009; Singh et al., 2011; Chittibabu and Sundararaman, 2023).
Feature names and descriptions.
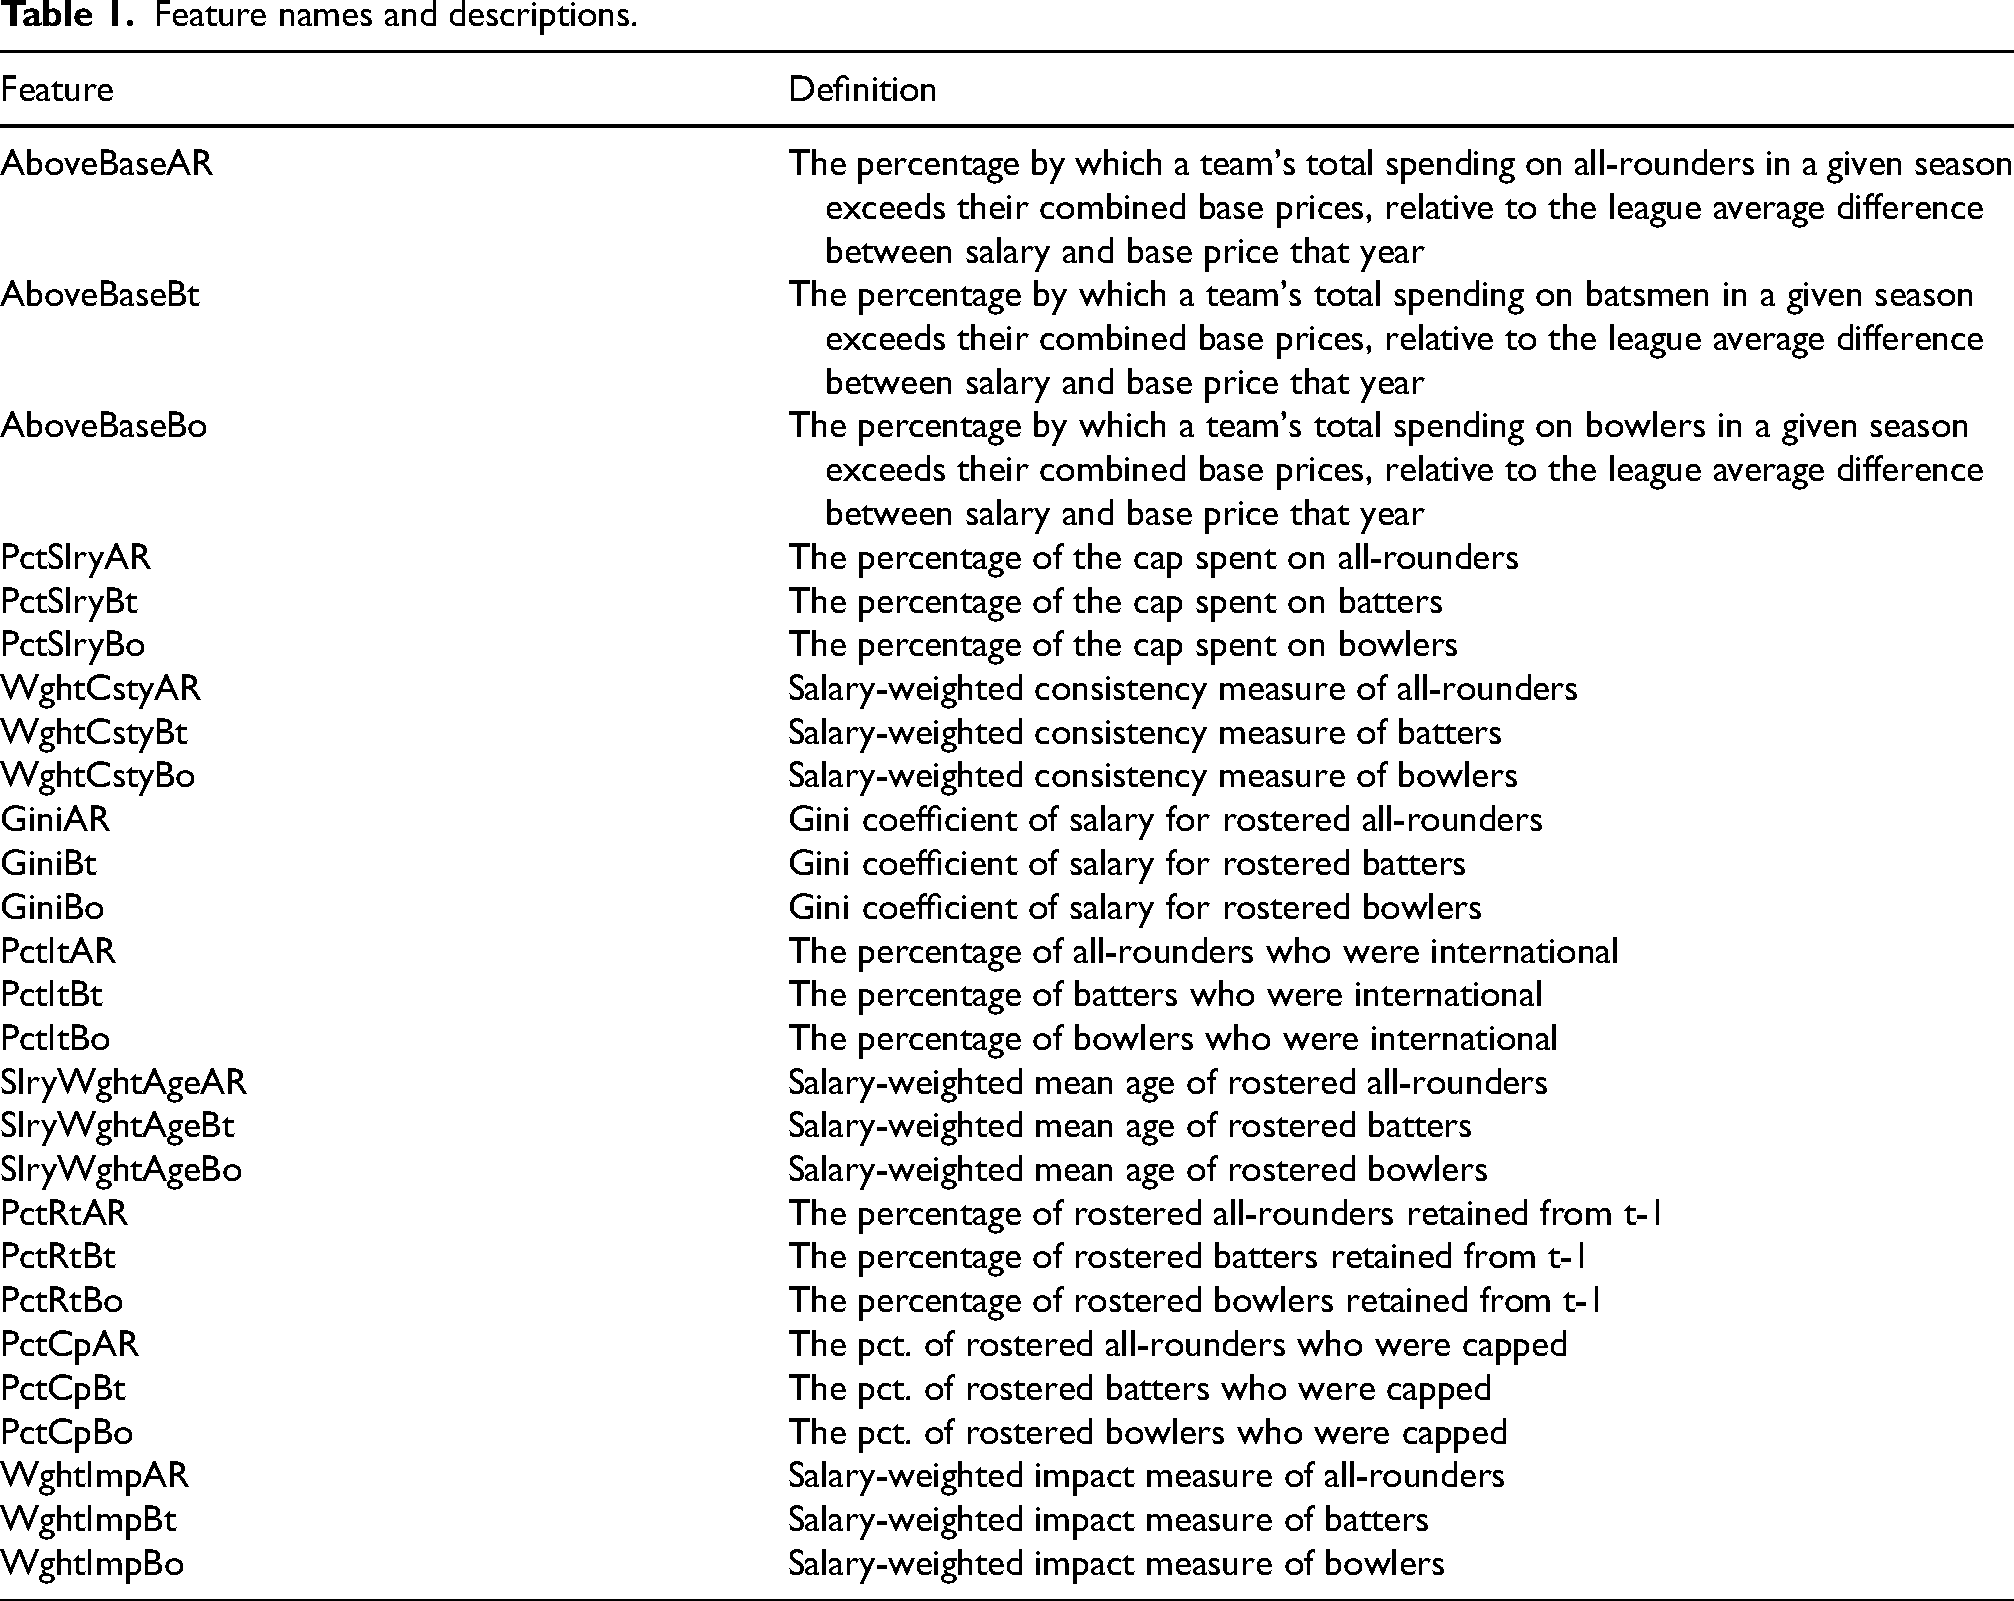
Notable financial features included the percentage of the total cap invested in all-rounders, batsmen and bowlers (PctSlryAR, PctSlryBt, and PctSlryBo), and the percentage being spent over the base price relative to the league average for each positional category in a given season (AboveBaseAR, AboveBaseBt, and AboveBaseBo). The AboveBase metrics were adjusted to the league average to account for fluctuations in spending that arise due to variations in the auction type (e.g., between mini- and mega-auctions) and other factors, and they were calculated via the following formula: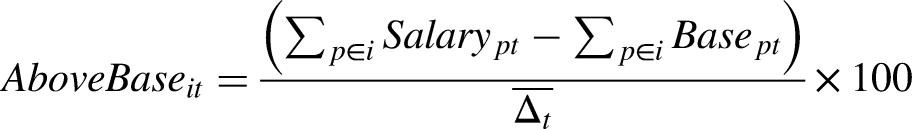
Other features included Gini coefficients measuring the distribution of newly spent auction money among batsmen, bowlers, and all-rounders (GiniAR, GiniBt, and GiniBo) and the mean ages of new and returning batsmen, bowlers, and all-rounders weighted by each player's individual salary (SlryWghtAvgAR, SlryWghtAvgBt, and SlryWghtAvgBo). In addition, given the various instruments that allow teams to retain certain players heading into an auction, we included features (PctRtAR, PctRtBt, and PctRtBo) that showed the percentage of rostered players from each position carrying over from the prior season.
Player performance metrics were quantified similarly to Singh et al. (2011) by averaging two distinct metrics for batsmen and bowlers across all rostered players of those positions in a given team-season. For batsmen, batting strike rate and batting average were used (Gokul and Sundararaman, 2023; Santhosh et al., 2023). Strike rate was quantified as the ratio of runs scored to the number of balls played in a season, and batting average was estimated as the number of runs scored per match. For bowlers, economy rate—the ratio of runs conceded to the number of overs bowled—and bowling average—the ratio of the number of runs conceded to the number of wickets taken—were calculated as the average for those values across all rostered bowlers (Santhosh et al., 2023). To account for the opposing effects of higher batting statistics and lower bowling statistics being indicative of good performance, the two metrics quantifying all-rounder performance were recorded as the ratio of their batting strike rate to their economy rate and the ratio of their batting average to their bowling average. Strike rates for batsmen and economy rates for bowlers were considered as impact metrics (SlryWghtImpAR, SlryWghtImpBt, and SlryWghtImpBo), and batting averages for batsmen and bowling averages for bowlers were labeled as consistency metrics (SlryWghtCstyAR, SlryWghtCstyBt, and SlryWghtCstyBo). All performance statistics utilized in the calculations were taken from a player's prior season because previous performance provided recent information that likely influenced the subsequent value and selection of that player in an auction. It is also important to note that the team-level aggregations of these metrics were weighted by players’ salaries to emphasize the expected, relative importance of higher-paid players to team outcomes.
Cluster analysis
Following data collection, k-means clustering—an unsupervised machine-learning technique that partitions a larger sample of data into a k-number of clusters such that the observations in each cluster are closer to the mean centroid of that cluster than any other cluster-mean in the dataset (Parasa et al., 2021)— was applied to the data using R statistical software version 4.4.1. In this way, the annual auction strategies of IPL teams could be categorized based on similarities across the 27 different features that were included. Prior to the analysis, data for each feature were standardized to their z-scores for scaling purposes. An elbow plot was used to determine the optimal (k) number of clusters based on the cluster number at which the within-group sum of squares (WSS) stopped shrinking. This approach recommends stopping cluster creation at a number of clusters where the new clusters are not becoming more homogenous in relation to their centroids. Figure 1 displays the plot, with a noticeable “elbow” occurring as the WSS levels out after the third cluster. The recommendation of the elbow plot was supported by four additional indices—Marriot, Trace Covariance (TrCovW), Ratkowsky, and Ball—that further identified k = 3 as the most appropriate solution. These indices are visualized in Figure 2 and more specifically defined in Charrad et al. (2014). The number of starts, which is the number of random centroids used to initiate the clustering process, was set at a higher value of 25 to try and find a more optimal configuration.
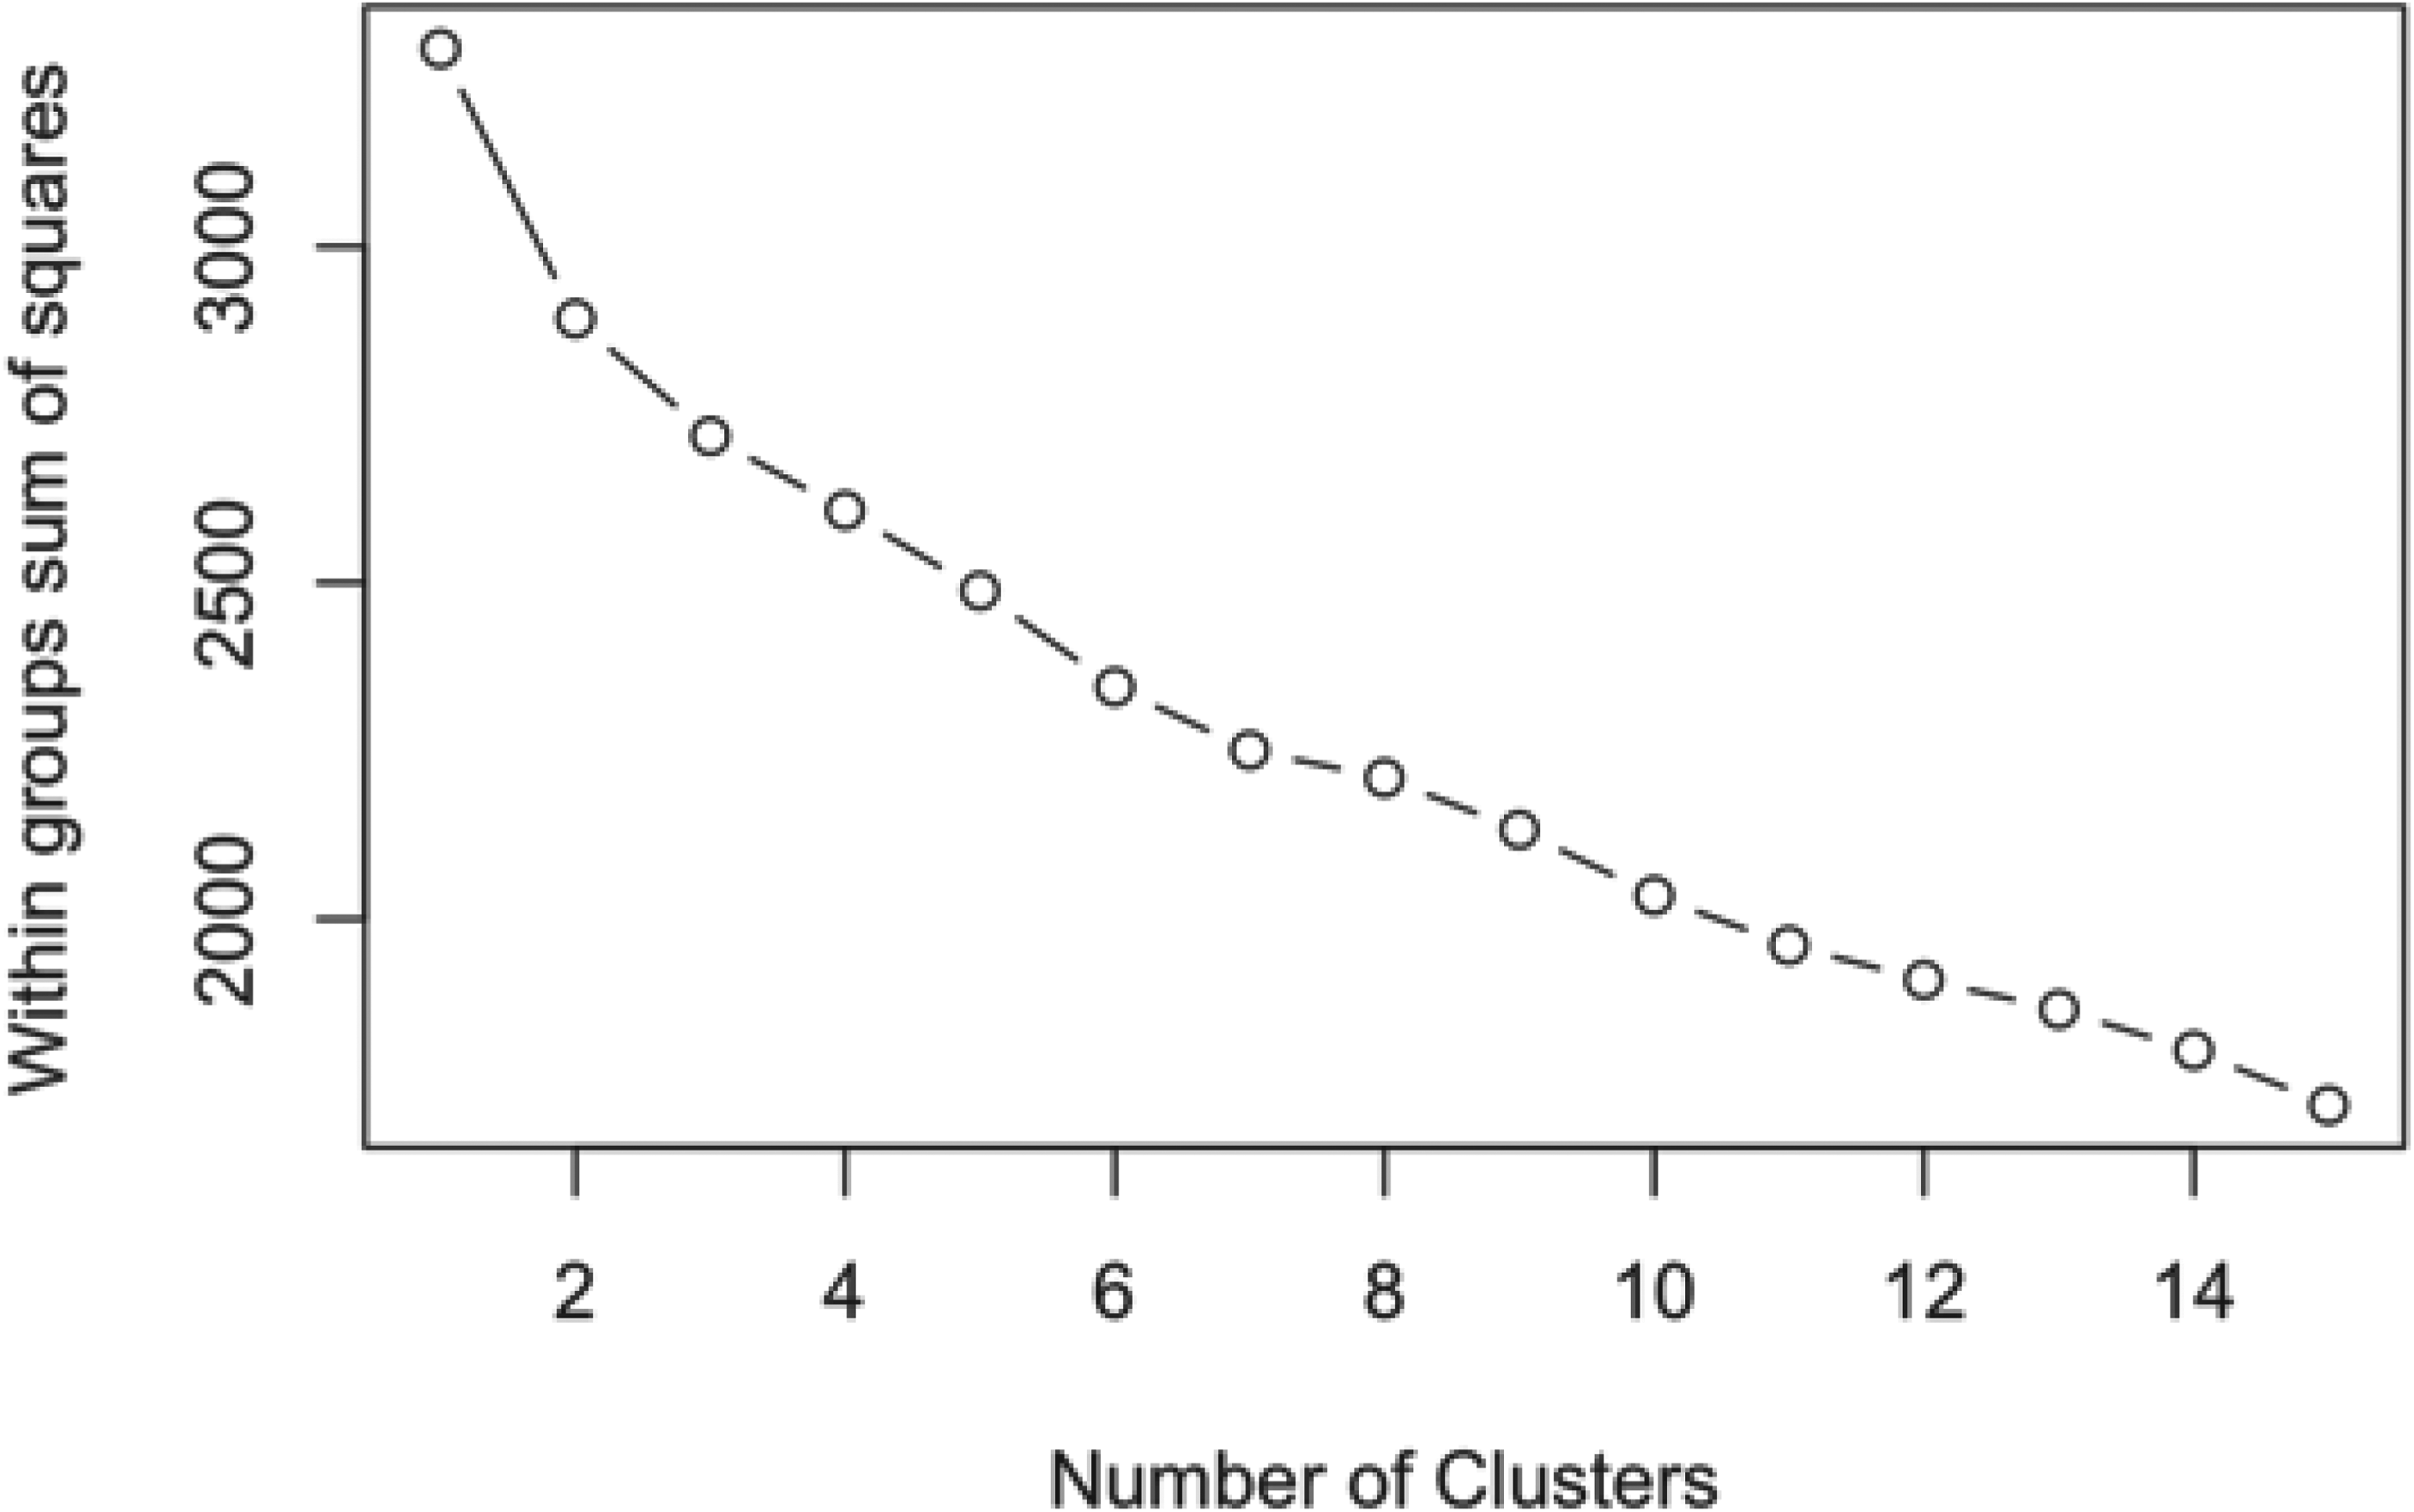
Elbow plot showing the recommended number of clusters.
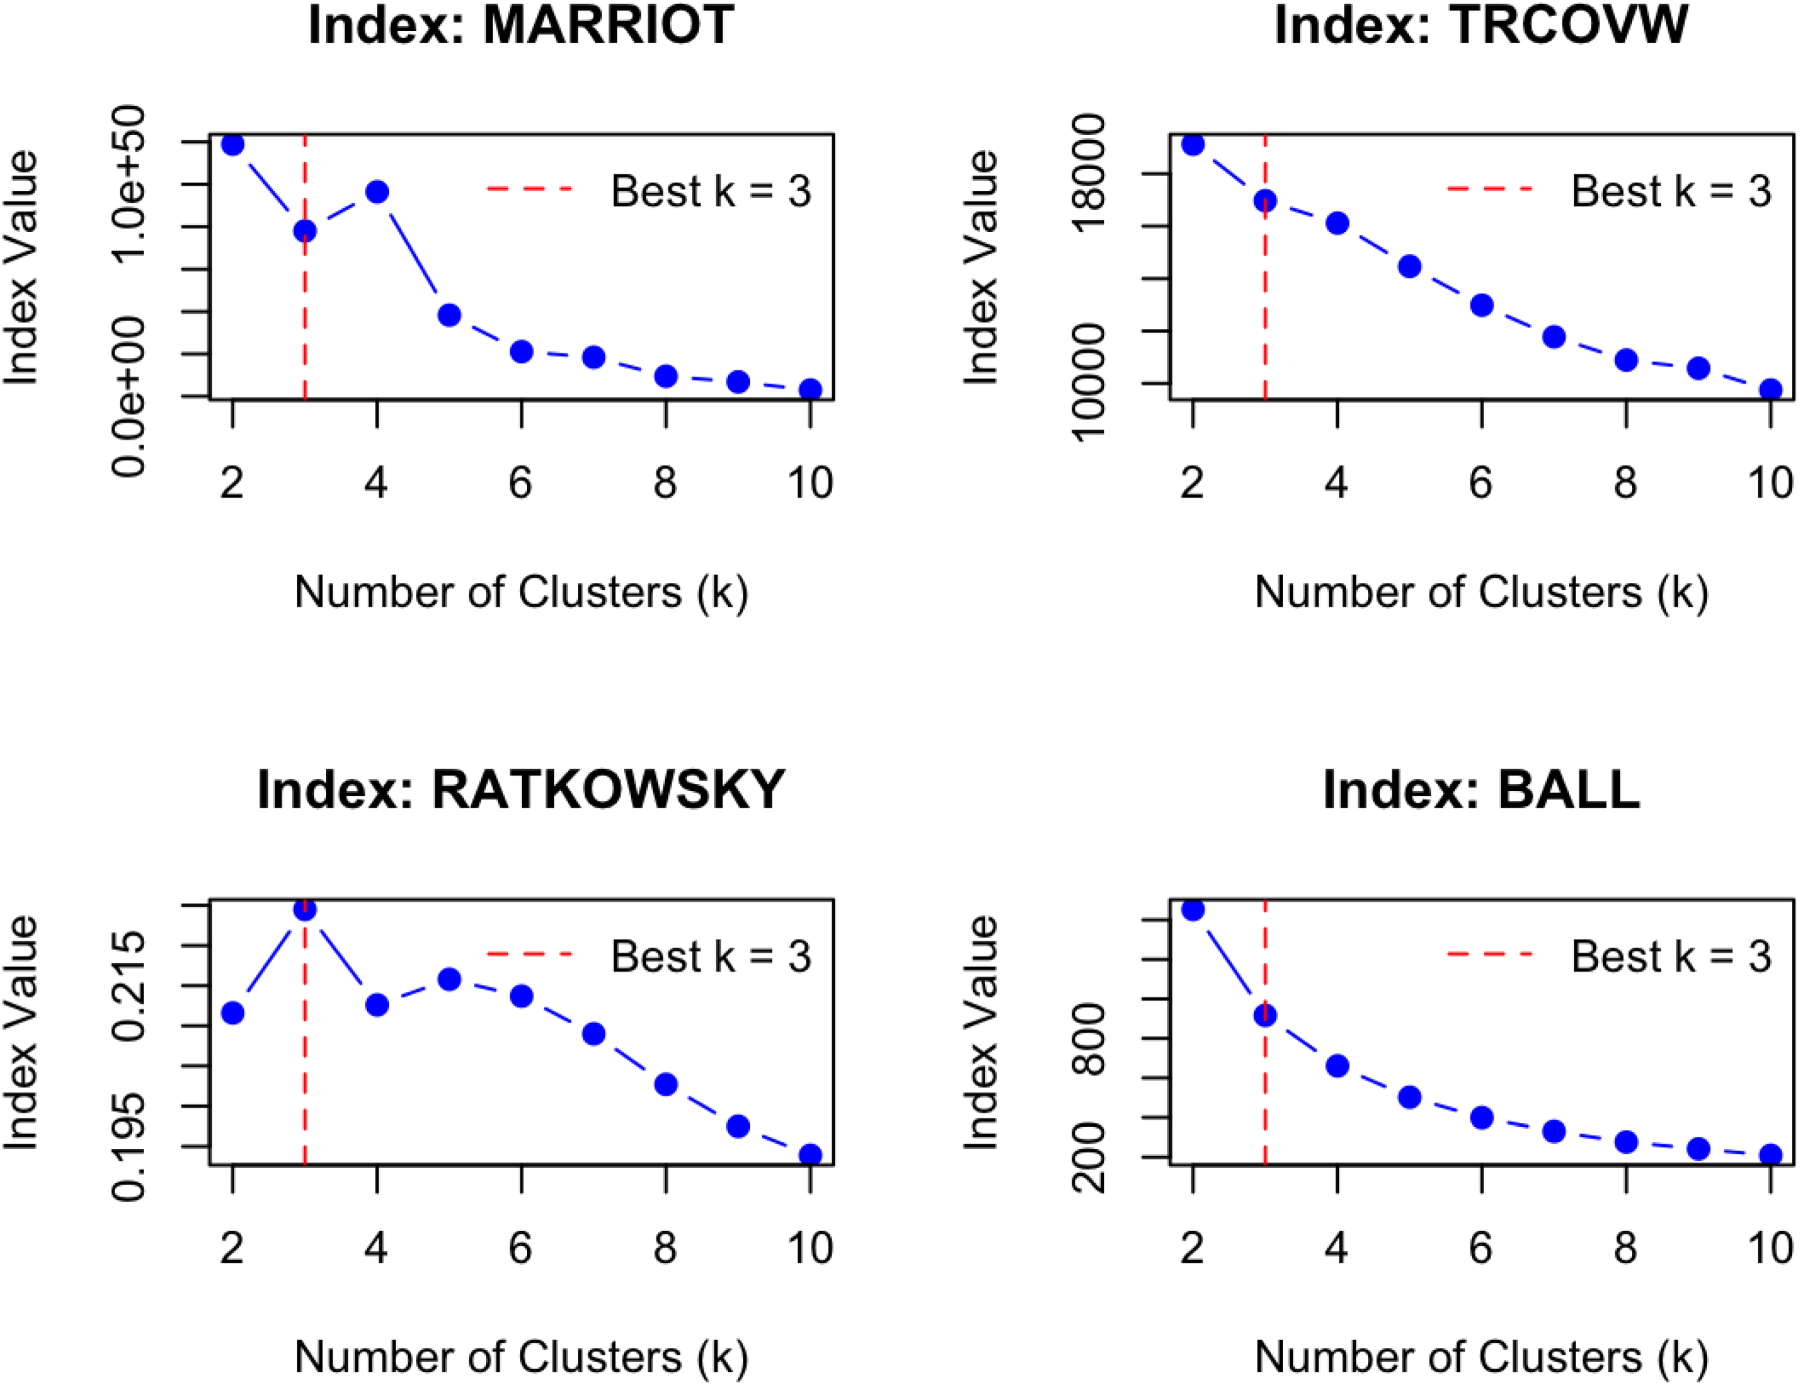
Plot of additional indices showing the recommended number of clusters.
Multiple regression models
The descriptive characteristics of each cluster, which are more thoroughly defined in the results section, resulted in the following labels: Cluster 1 was equated to assertive acquisition strategies featuring aggressive bids above base-price for high-performing batsmen; Cluster 2 featured conservative, development-focused strategies emphasizing bowling talent, younger players, domestic players, and moderate spending; Cluster 3 contained continuity-focused, selective investment strategies with below-average spending relative to base prices, more concentrated salaries, more returning players, and a tendency to target high-performing all-rounders. After each observation was assigned to the cluster representing its roster formulation strategy, the relationships between the assigned clusters and team performance were assessed using a series of multiple regression analyses. The first was an ordinary least squares (OLS) model that regressed a team's winning percentage on the cluster it had been assigned to in the preceding auction. It is represented by the following equation: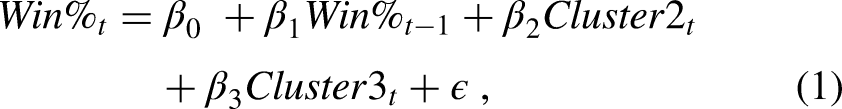
Lastly, to assess the sequential, longer-range effect of the various strategies on a team's winning percentage, the following model was created: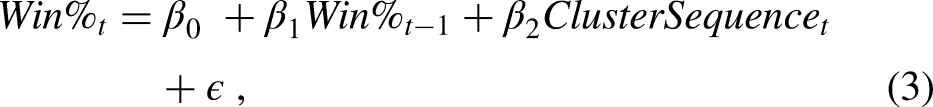
For the first two models, the cluster-related variables were dummy-coded such that the unique effects of observations in the second (Cluster2) and third (Cluster3) clusters were compared to the baseline effect of the first cluster (Cluster1). In the third model, the cluster sequences were compared to a baseline sequence of 1-1-1 (i.e., a team that was in the first cluster for each of the three preceding auctions). In each model, the prior time period's outcome variable for a team was lagged to address the potential autocorrelation that occurs from having repeat observations of teams (i.e., team-seasons) in the data. Iterations of the models without the lagged dependent variables were also included, as were iterations of models 1 and 2 with interaction terms between the lagged dependent variables and the clusters. For models involving multi-year sequences or lagged outcome variables, only team-seasons containing applicable data were included.
Given the generally small size of the sample, each model was further subjected to a global permutation test that examined whether the observed measure of fit (i.e., R2 in Equations 1 and 3 and McFadden's R in Equation 2) was significant in relation to a null distribution of fit measures based on random permutations of the data. In permutations, values of the outcome variable are randomly shuffled across the observations while keeping the covariates unchanged. This process is repeated—in this study, 5000 times—until a distribution of fit measures possible under the null hypothesis is produced (Bakker, 2024). The measure of fit from the initially constructed model is then compared to this distribution, with the resulting p-value representing the proportion of values greater than or equal to the measure of fit obtained from the model. Thus, a lower p-value from a global permutation test would suggest the original model fits the data better than models produced by chance.
Results
Cluster analysis
The 3-means cluster analysis resulted in observable separations between the clusters. The largest Euclidean distance between centroids was observed between Cluster 1 and Cluster 2 (5.04 units), and the smallest was observed between Cluster 2 and Cluster 3 (2.83 units). Cluster 2 had the lowest within-cluster sum of squares (694.32), indicating greater internal cohesion relative to Cluster 1 (1036.92) and Cluster 3 (1006.87). Although the between-cluster sum of squares ratio was relatively low (20%), suggesting some overlap, the centroid dispersion and internal validation indices supported the three-cluster solution. Figure 3, which plots the resulting clusters of team-season observations (abbreviated in the figure) across two dimensions following dimension reduction, further shows that the method was able to capture distinct underlying patterns in the data. Dimension 1, which explained 18.4% of the total variance, largely consisted of roster composition features, with the percentage of capped all-rounders (PctCpAR; 11.31%), percentage of international all-rounders (PctItAR; 9.88%), and percentage of capped batsmen (PctCpBt; 8.87%) being the primary contributors. Dimension 2, which explained 8.9% of the total variance, was shaped more by performance metrics, with salary-weighted performance variables for all-rounders (WghtCstyAR and WghtImpAR at 18.53% and 16.72%) and the percentage of the salary cap devoted to all-rounders (PctSlryAR; 10.31%) emerging as the more influential features in that component. At a more granular level, Table 2 shows the standardized values of the features within each cluster, and Figure 4 displays a bar chart of the clusters’ z-scores grouped by feature. Following these procedures, and in conjunction with the associated visuals, the clusters were able to be categorized and labeled according to the characteristics that defined them.
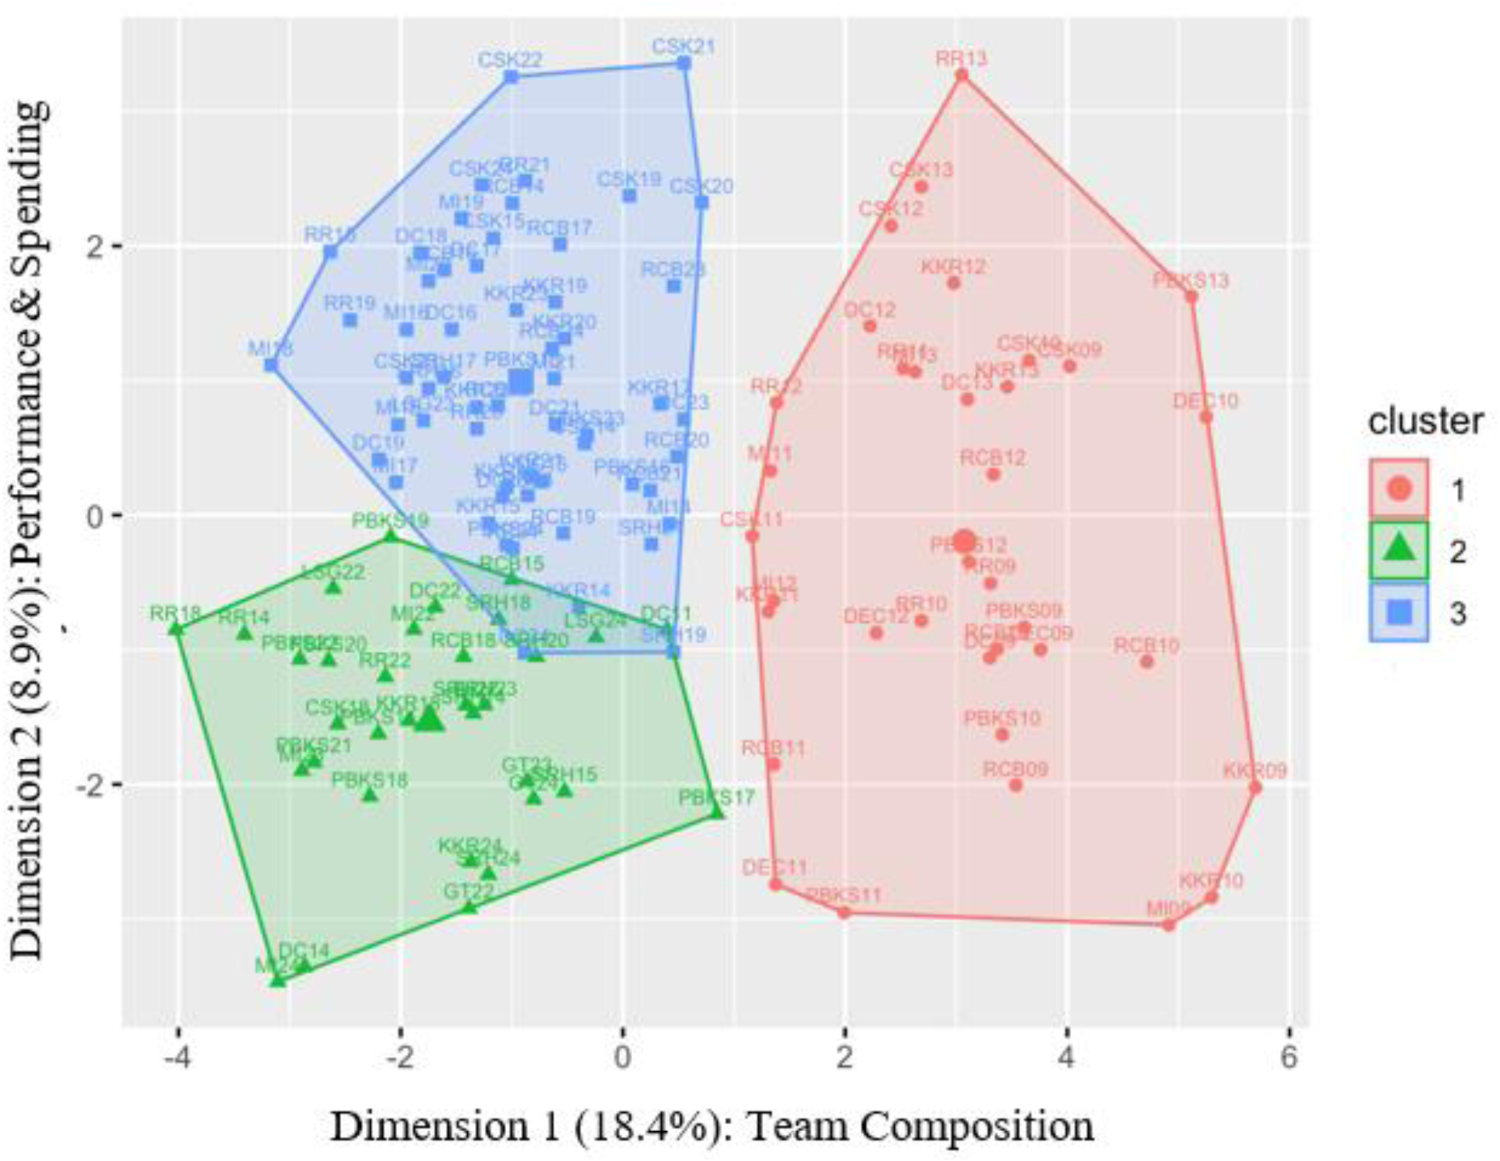
Two dimensional plot of the three obtained clusters.
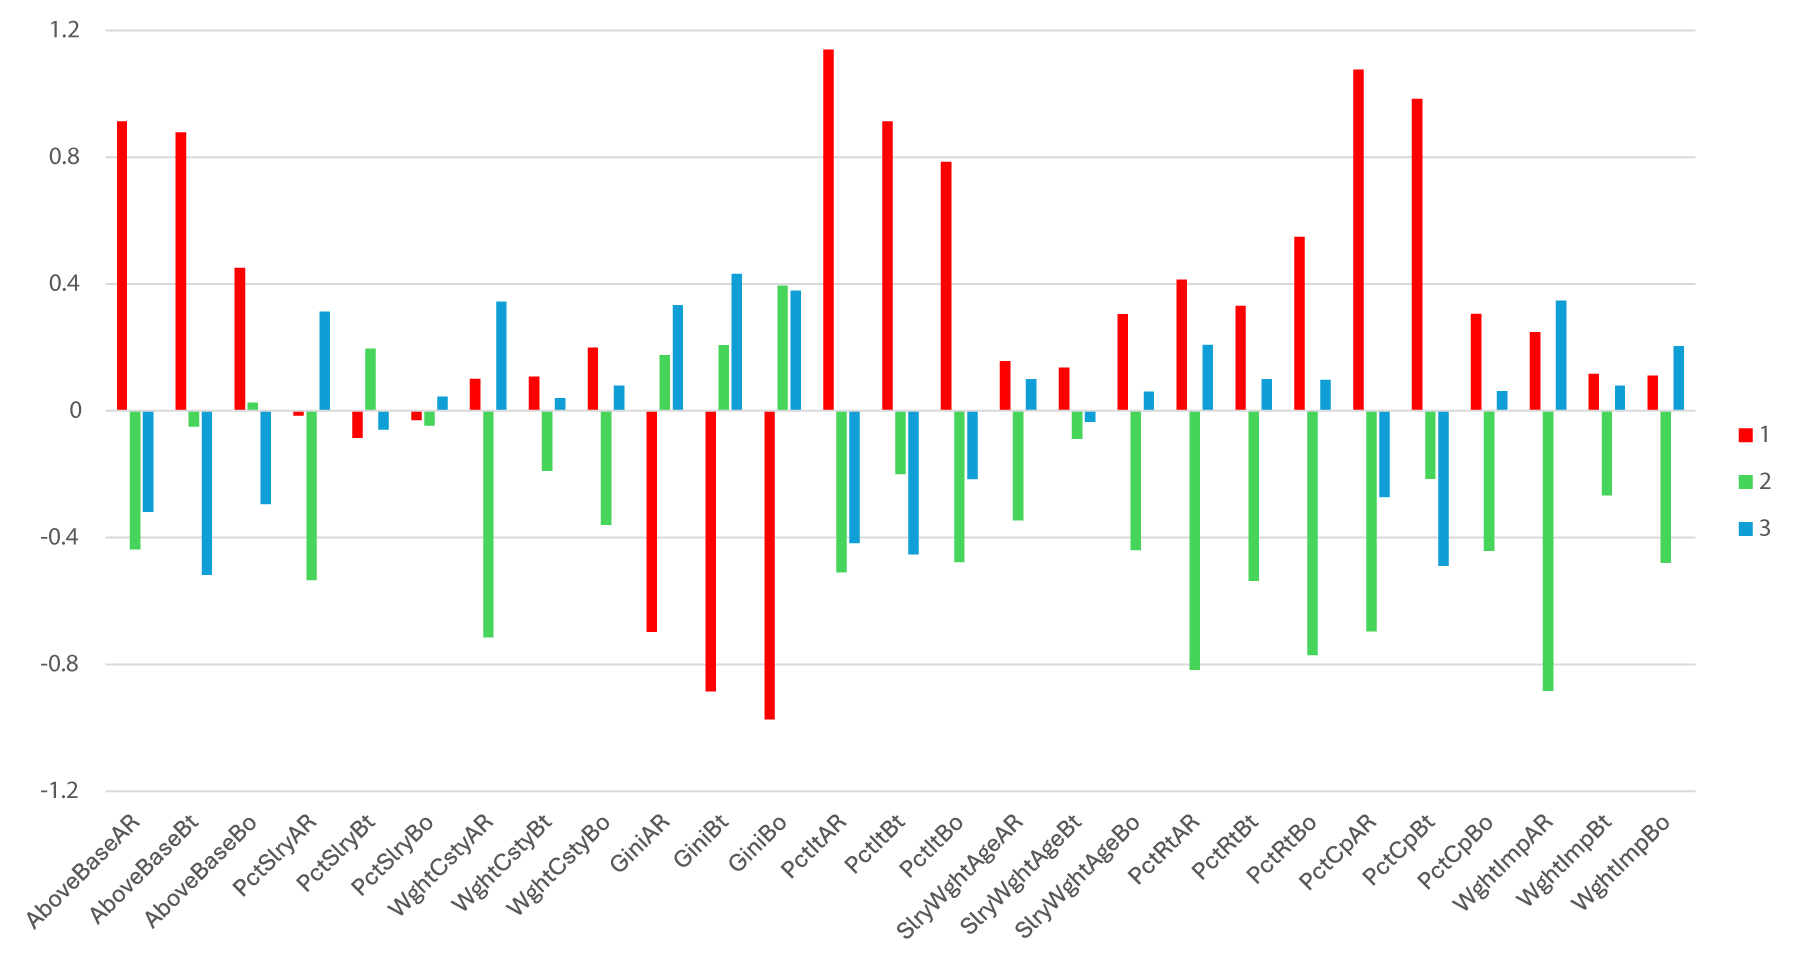
Z-Scores of features by cluster groups.
Z-Scores of cluster features.
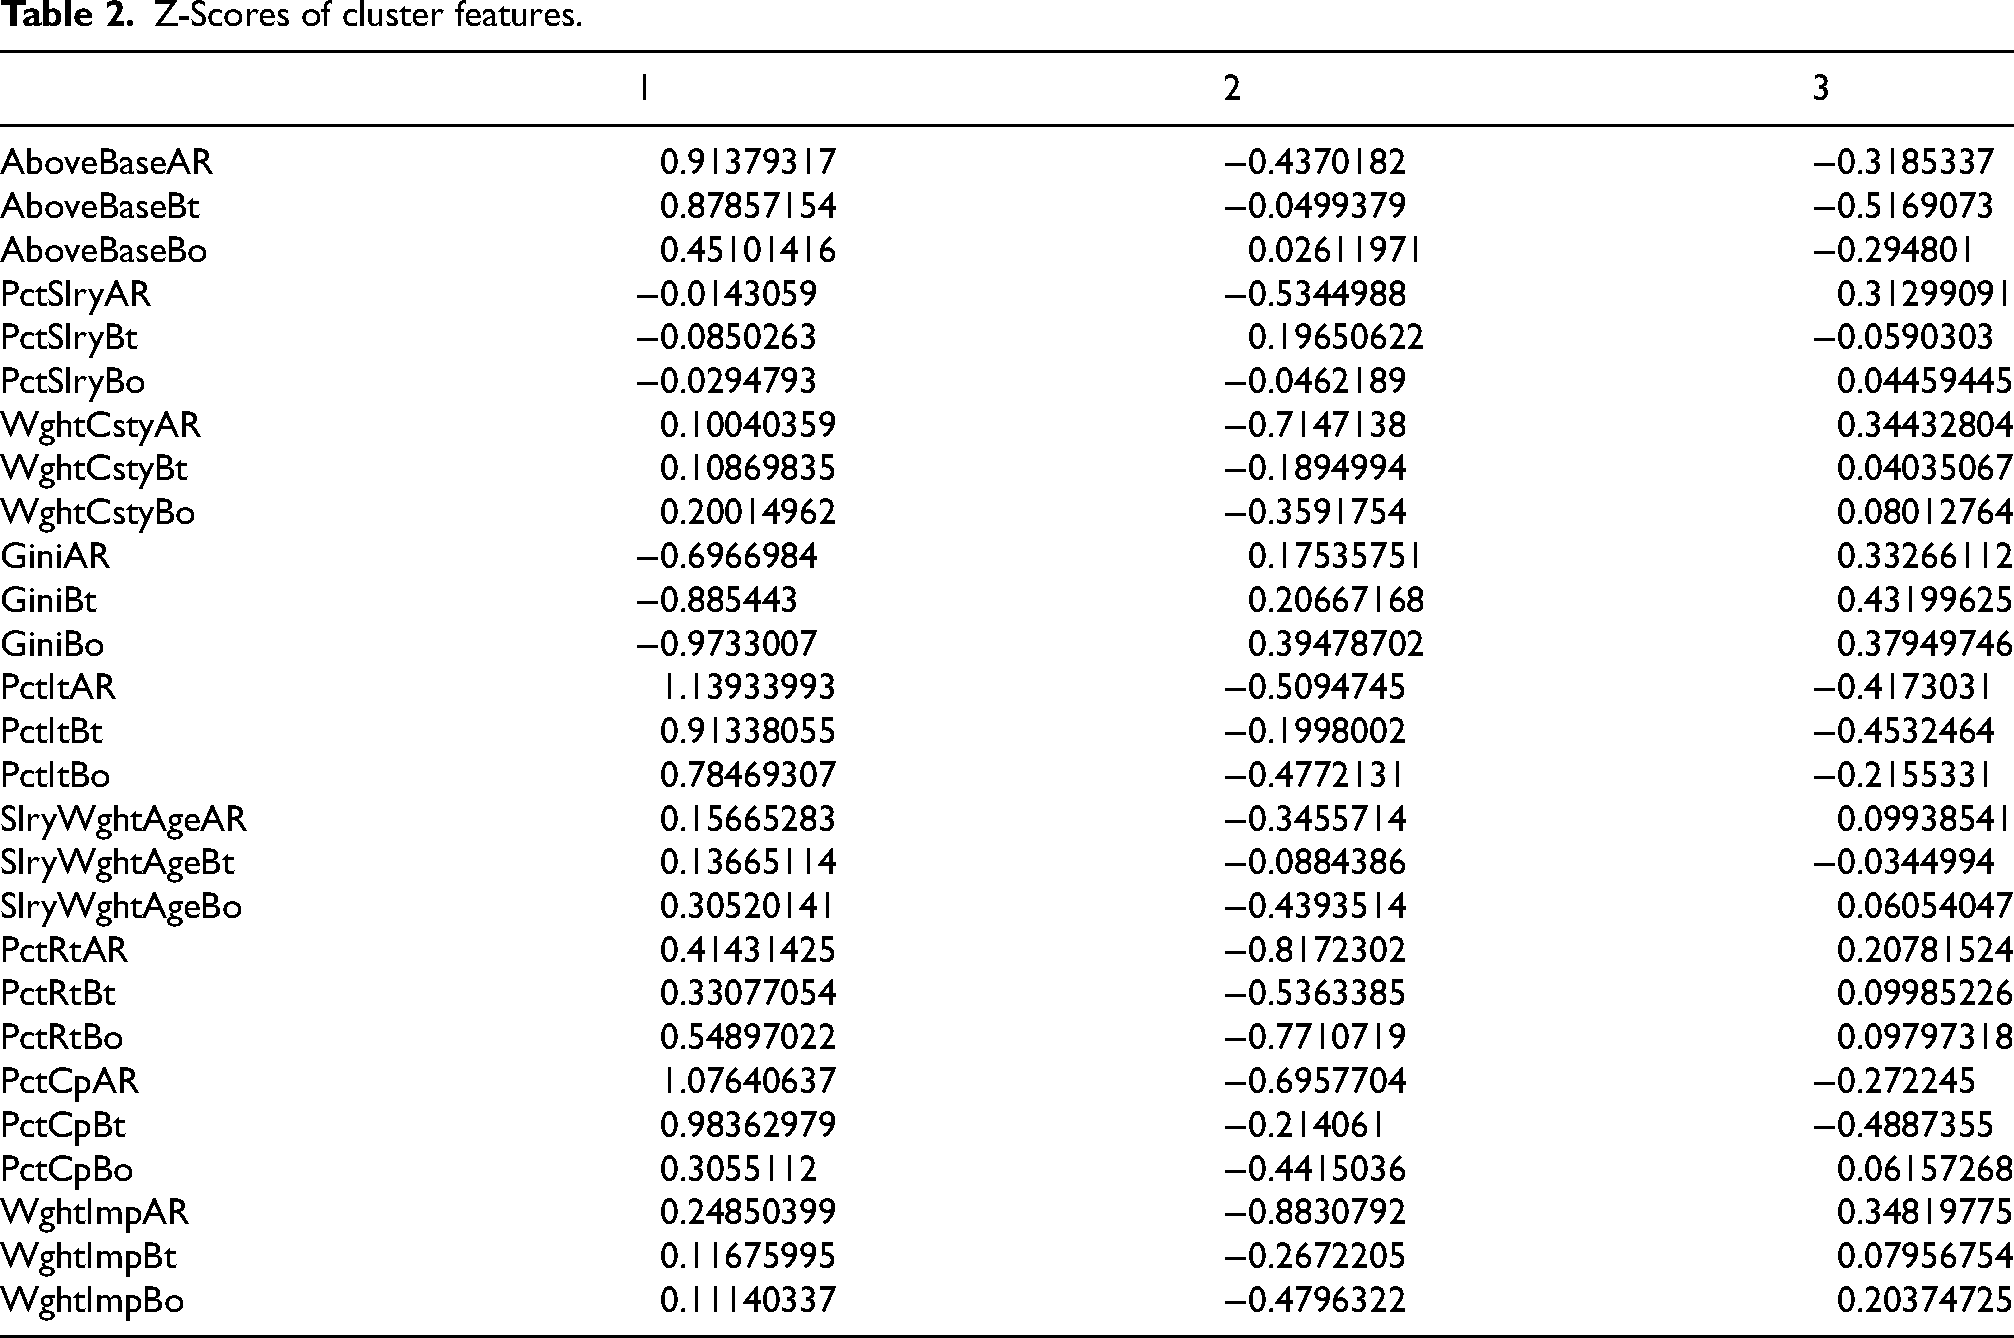
Starting with features related to spending behavior, Cluster 1 teams exhibited above-average ratios of total spending relative to base prices across all three positional groups (AboveBaseAR, AboveBaseBt, and AboveBaseBo), particularly for all-rounders and batsmen. This suggests that these teams consistently bid above the league's average base-price markups, signaling a comparatively aggressive valuation of talent. By contrast, Cluster 3 teams spent below the league's average levels across all positions, with the largest relative undervaluations being observed among batsmen. Cluster 2 teams were near the league average, reflecting a more moderate approach to player acquisition.
However, when examining the percentage of the total salary cap allocated to each positional group (PctSlryAR, PctSlryBt, and PctSlryBo), the patterns shifted. Cluster 3 teams allocated the highest share of their cap to all-rounders and bowlers, indicating a targeted investment in those roles. Cluster 2 teams spent more on batsmen relative to other groups, while Cluster 1 teams allocated near-average or slightly below-average shares across all three positions, suggesting their elevated spending relative to base price was not due to greater total cap use, but rather more aggressive pricing per acquisition. An example of this is Gautam Gambhir and Yusuf Pathan who were acquired for 12 and 7 times their base price respectively by Kolkata Knight Riders in 2011.
Regarding salary distribution (GiniAR, GiniBt, and GiniBo), Cluster 1 teams typically had the lowest Gini coefficients across all positions, indicating they spread salary resources more evenly within each group. Conversely, Cluster 3 teams displayed the highest salary inequality, with a strong concentration of pay among a few top earners. Cluster 2 teams, while still more balanced than Cluster 3, were modestly above average, suggesting a slight tendency toward salary concentration.
In terms of player performance (WghtCstyAR, WghtCstyBt, and WghtCstyBo for consistency and WghtImpAR, WghtImpBt, and WghtImpBo for impact), Cluster 1 teams rostered batsmen and all-rounders with above-average salary-weighted consistency and impact metrics, indicating a clear focus on securing high-performing players in these roles. However, their bowlers had less-favorable metrics, as indicated by the relatively higher z-scores for bowling consistency and impact. Cluster 2 teams exhibited the weakest profile in batting and all-rounder performance, with below-average values for consistency and impact. However, their bowling metrics were the most favorable in terms of both consistency (z = −0.36) and impact (z = −0.48), indicating a stronger preference for high-performers in that position. Cluster 3 members, while targeting slightly above-average batsmen and lower performing bowlers, displayed the strongest all-rounder metrics for both consistency (z = 0.34) and impact (z = 0.35). Taken together, teams in Cluster 1 prioritized strong batsmen and all-rounders but underperformed in bowling, Cluster 2 teams typically fielded the most effective bowlers but weakest batsmen and all-rounders, and Cluster 3 teams balanced modest batsmen with standout all-rounders.
Looking at roster composition and continuity (PctRtAR, PctRtBt, and PctRtBo), Cluster 1 teams had the lowest percentage of players retained across all positions, pointing to a strategy focused on turnover and rebuilding. Cluster 3 teams retained the highest proportion of their rosters, suggesting a strong preference for continuity and internal development. Cluster 2 teams took a moderate approach, retaining a noticeable portion of their roster without displaying a clear bias toward either strategy. With respect to international representation (PctItAR, PctItBt, and PctItBo for international players and PctCpAR, PctCpBt, and PctCpBo for international caps), Cluster 1 teams had the highest percentage of international players and the highest proportion of players with international caps, particularly among all-rounders and batsmen. Cluster 2 teams displayed the lowest levels of international representation and cap experience, while Cluster 3 teams intermediately featured more international experience than Cluster 2 but less than Cluster 1. Examining player age profiles (SlryWghtAgeAR, SlryWghtAgeBt, and SlryWghtAgeBo), Cluster 2 teams typically signed the youngest players across all three roles, as indicated by the salary-weighted mean age. Cluster 1 teams assembled slightly older squads, especially in bowling, suggesting a preference for experience in that area while balancing younger talent in other roles. Cluster 3 teams featured mixed age patterns, with batsmen skewing younger but bowlers being notably older, indicating a reliance on veterans in bowling roles.
In summary, Cluster 1 teams employed a more assertive acquisition strategy, bidding aggressively above base-price norms, favoring batsmen with high consistency and impact, distributing salaries more evenly, and targeting both experienced and international talent. Cluster 2 teams adopted a more conservative, development-focused model that emphasized bowling talent, youth, domestic players, and moderate spending. Cluster 3 teams pursued a continuity-focused, selective investment approach that involved below-average spending, concentrating salaries among top performers, retaining larger portions of their rosters, and pursuing high-performing all-rounders.
Regression models
The results of the models regressing team performance outcomes on the assigned clusters are displayed in Tables 3 to 5. As a preliminary check, the variance inflation factors (VIF) for the models’ features were calculated, and each one was below 5. This suggested that multicollinearity among the covariates was not a serious issue. Table 3 shows that teams’ winning percentages did not vary significantly from Cluster 1 to Cluster 2, β = −1.15, t(124) = −0.36, p = .723, or from Cluster 1 to Cluster 3, β = −2.27, t(124) = −0.80, p = .426. This pattern remained consistent in the model that included the previous year's winning percentage as a covariate. In that model, teams in Cluster 2, β = −2.05, t(110) = −0.57, p = .569, and Cluster 3, β = −2.60, t(110) = −0.86, p = .395, continued to show no significant differences from Cluster 1. The lagged winning percentage variable was also non-significant in relation to team performance, β = 0.15, t(110) = 1.55, p = .125. These findings persisted even when interaction terms between cluster membership and the lagged outcome variable were included. The overall model fit remained low across all variations, and the global permutation tests returned p-values ranging from .341 to .730. This provided further evidence that there was little to no association between teams’ strategic cluster assignments and their near-term winning percentages.
OLS regressions for winning percentage and clusters (Equation 1).
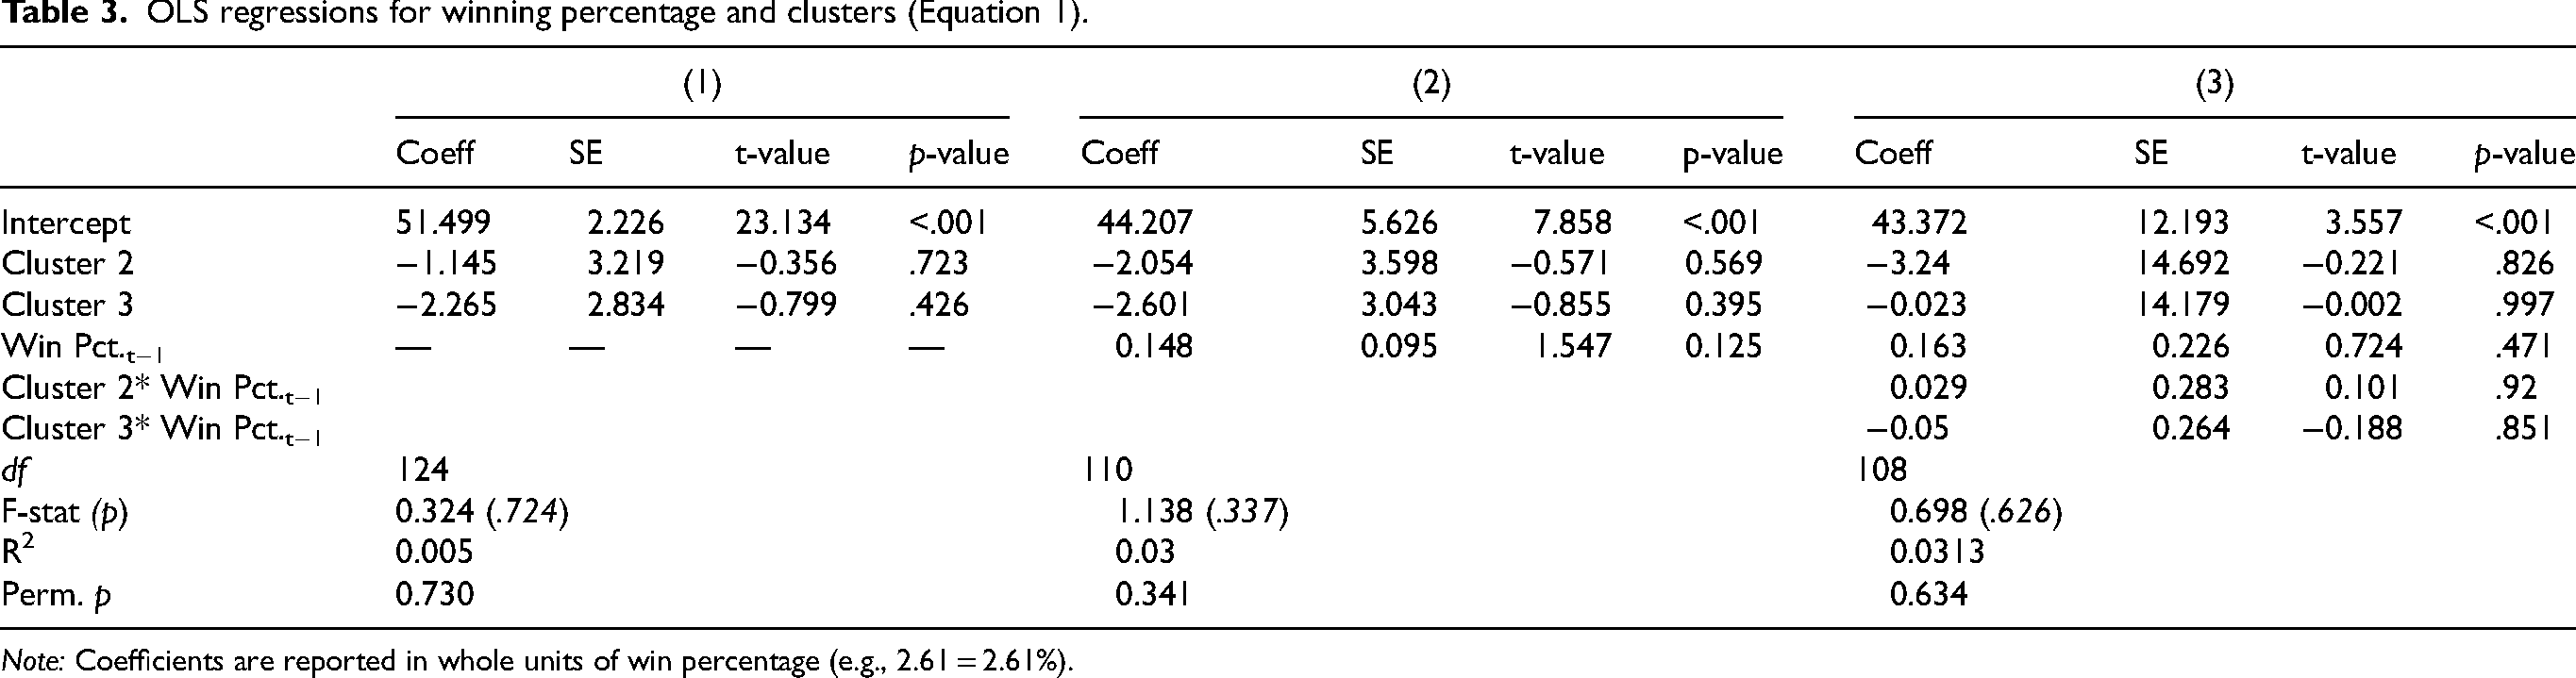
Note: Coefficients are reported in whole units of win percentage (e.g., 2.61 = 2.61%).
Logistic regressions for playoff appearance and clusters (Equation 2).
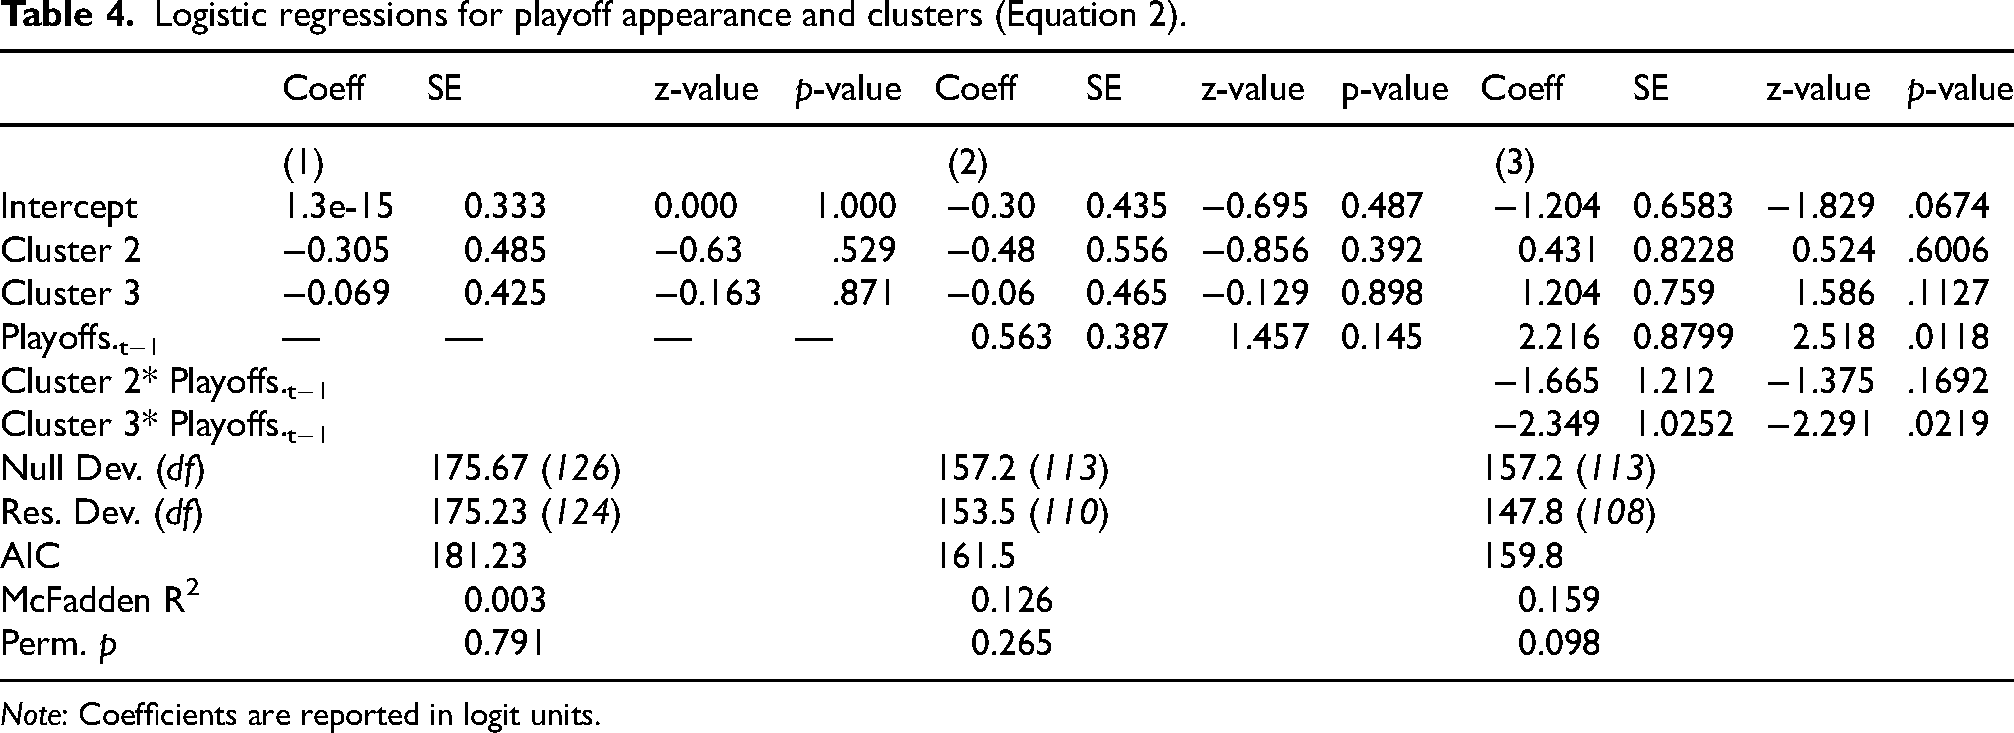
Note: Coefficients are reported in logit units.
OLS regressions for winning percentage and 3-year cluster sequences (Equation 3).
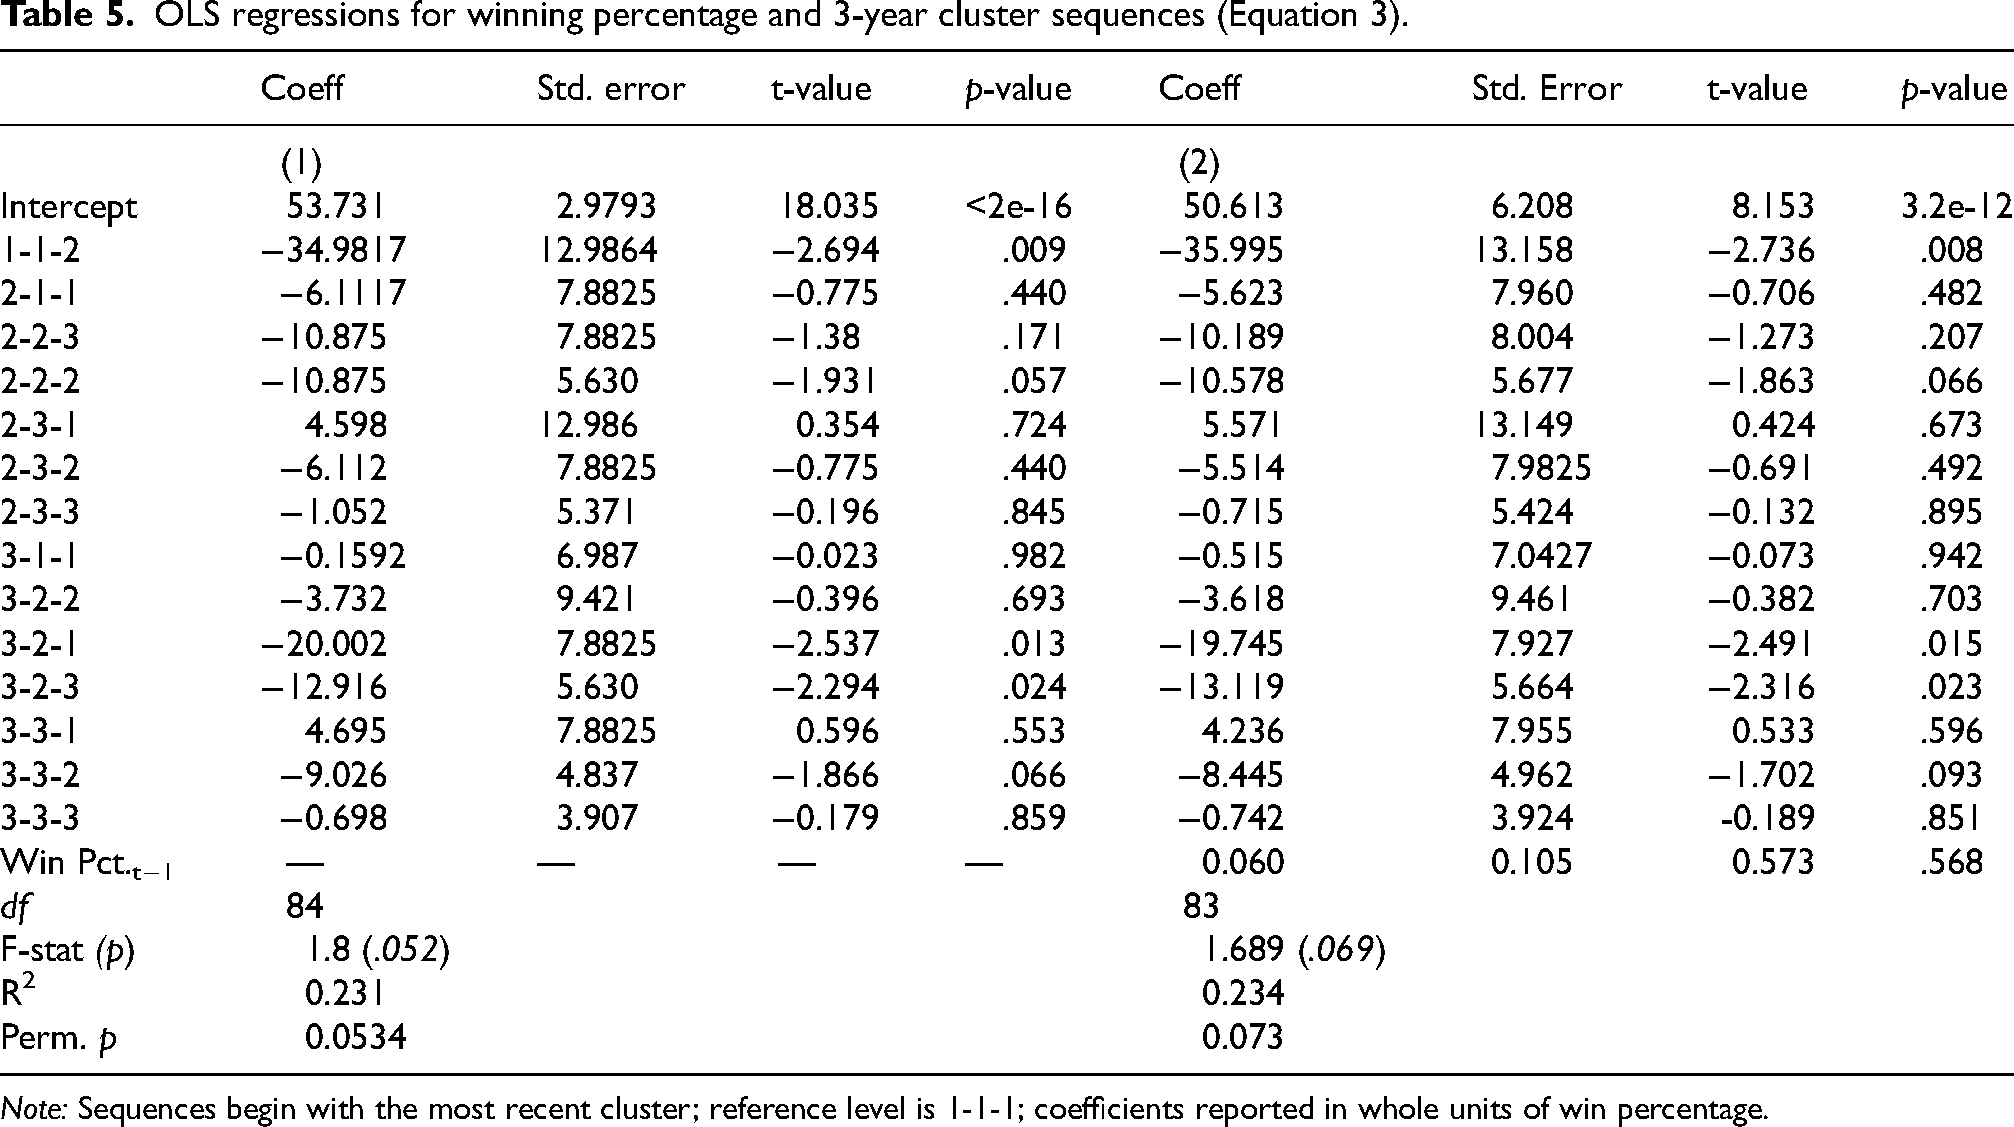
Note: Sequences begin with the most recent cluster; reference level is 1-1-1; coefficients reported in whole units of win percentage.
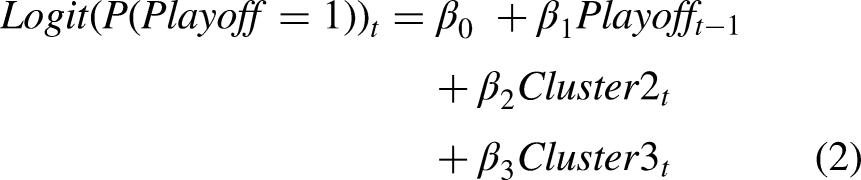
Table 4 displays the results of the logistic regression model where qualifying for the playoffs served as the dependent variable. As with the linear models, no significant differences emerged across clusters. In the baseline model, playoff qualification did not vary significantly between Cluster 1 and Cluster 2, β = −0.31, z = −0.63, p = .529, or between Cluster 1 and Cluster 3, β = −0.07, z = −0.16, p = .871. These findings were unchanged in the model that accounted for playoff qualification in the previous season (Cluster 2: β = −0.48, z = −0.86, p = .392; Cluster 3: β = −0.06, z = −0.13, p = .898). While previous playoff qualification had a positive, non-significant effect on current season qualification in the second iteration (β = 0.56, z = 1.46, p = .145), it became significant in the third version that included interaction terms (β = 2.22, z = 2.52, p = .012). The interaction term between Cluster 3 and previous playoff experience was also negative and significant, β = −2.35, z = −2.29, p = .022, suggesting that teams in Cluster 3 that had previously qualified for the playoffs were less likely to do so again compared to similarly situated teams in Cluster 1. The permutation tests conducted using McFadden's R² indicated that the first two models fit no better than random (p = .791 and p = .265), although the third model with the significant effects showed marginal signs of enhancement (p = .098).
The results of the third regression model examining teams’ winning percentages in relation to their sequence of clusters from the previous three auctions are displayed in Table 5. Three sequences—1-1-2, 3-2-1, and 3-2-3—displayed statistically significant effects relative to the reference category of 1-1-1 in the model that included the previous year's winning percentage as a covariate. For each of these sequences, the regression coefficients were negative (1-1-2: β = −35.995, t(83) = −2.74, p = .008; 3-2-1: β = −19.745, t(83) = −2.49, p = .015; 3-2-3: β = −13.119, t(83) = −2.32, p = .023), suggesting that clubs following these strategic patterns tended to have lower winning percentages than those employing Cluster 1 strategies across all three seasons. Two additional sequences—2-2-2 (β = −10.58, t(83) = −1.86, p = .066) and 3-3-2 (β = −9.03, t(83) = −1.70, p = .094)—were marginally significant (p < .10). All else equal, the lagged winning percentage showed no significant relationship with team performance, β = 0.06, t(83) = 0.57, p = .568. Notably, the inclusion of these sequence variables substantially improved the model's explanatory power, with adjusted R² values indicating that roughly 23% of the variance in winning percentage was now accounted for, representing a substantial improvement in fit relative to the models based on cluster membership in a single season. The global permutation tests confirmed this, returning p-values of .053 and .073 that were substantially lower than those witnessed in the short-run models.
Post-Hoc analyses
In addition to the initial regression-based findings, descriptive statistics revealed minimal differences across clusters in terms of winning percentage. Cluster 1 teams had a mean winning percentage of 51.5 and a standard deviation of 13.4, Cluster 2 teams had a mean of 50.4 and a standard deviation of 13.9, and Cluster 3 teams had a mean of 49.2 and a standard deviation of 13. The differences between each cluster's win percentage means were not significant following a series of independent sample t-tests (p > .05). Given the lack of performance differences across clusters, we conducted a series of post-hoc analyses to more precisely investigate whether spending was related to team performance. In line with prior literature showing that investments in specific positions are capable of producing differential results (Humphrey et al., 2009; Roach, 2018), we first analyzed whether features related to relative spending-above-base (AboveBaseAR, AboveBaseBt, and AboveBaseBo) and devoting a higher proportion of the cap to specific positions (PctSlryAR, PctSlryBt, and PctSlryBo) had significant and differential impacts on winning percentage. The Gini coefficients of the cap spent on batsmen, bowlers, and all-rounders (GiniAR, GiniBt, and GiniBo) were then included as further controls in a second iteration of the post-hoc model. Table 6 presents the results from both iterations.
Post-Hoc OLS regressions for winning percentage and spending variables.
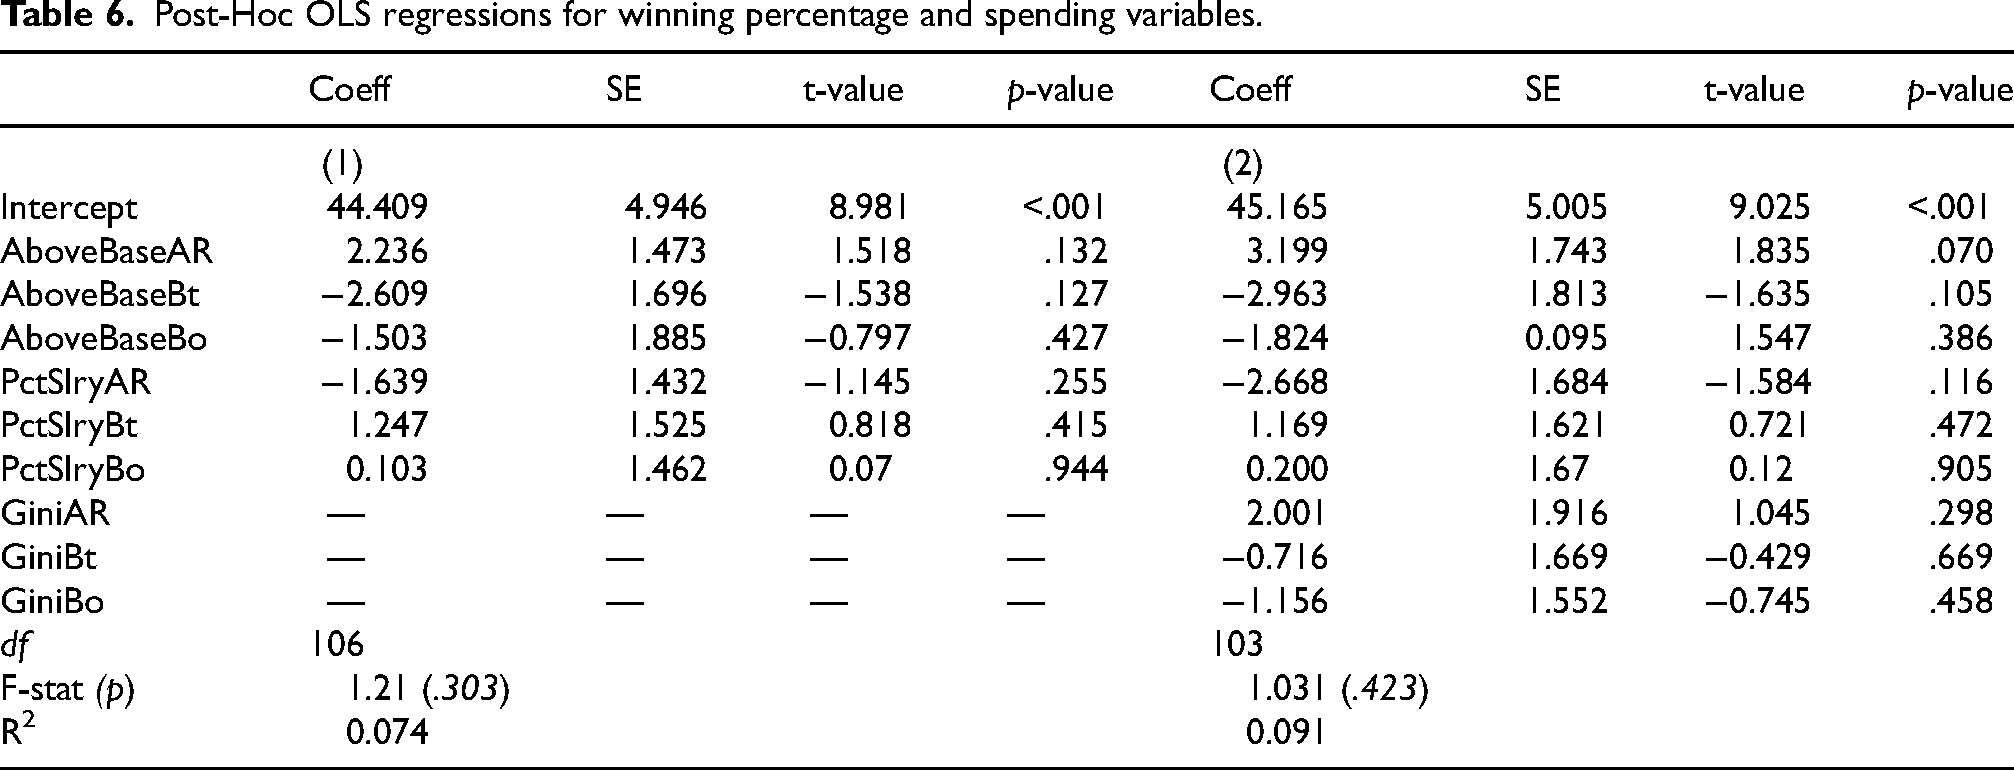
In both models, none of the financial variables were significantly related to the current season's performance (p < .05). This remained true even after controlling for a lagged outcome effect in separate models. While the ratio of above-base spending on all-rounders approached significance in the extended model, the effect remained marginal (p = 0.07) and insufficient to warrant strong conclusions. The included Gini coefficient variables were also non-significant and hardly improved model fit, suggesting that neither the amount spent on players nor the concentration of spending within roles had a reliable impact on team success in a single season. Taken together, the results indicated that IPL clubs’ short-term strategies for signing players—whether related to how much they spent on specific roles or the dispersion of player compensation—did not have a significant effect on team performance in a single season.
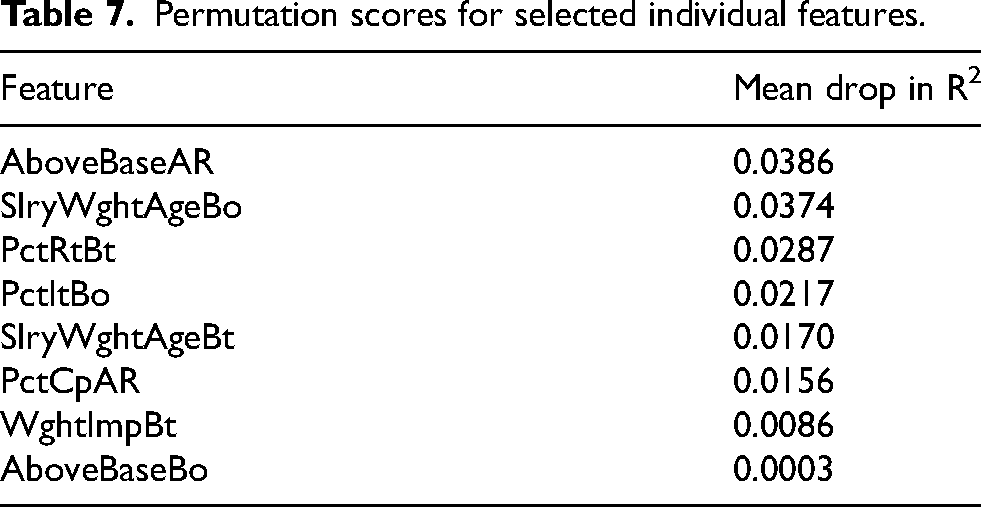
Nonetheless, just as we felt the need to examine overall model fit through a global permutation test in the cluster-based analyses (Equations 1 to 3), we conducted post-hoc analyses that quantified individual variable importance beyond the reported coefficients and p-values. For this, we started with a forward-based stepwise selection process that identified, from all 27 features, which combination of features yielded the best fit to the outcome. The resulting eight features, which are presented in Table 7, were then subjected to a permutation process that randomly shuffled a single covariate's values (holding all others constant at their original values) before estimating a new model fit. After repeating this process 5000 times, the mean drop in R2 when a feature was randomized was reported as its permutation importance score in Table 7. From this, relative spending-above-base on all-rounders (AboveBaseAR; mean R2 drop of 3.86%), the salary-weighted age of a team's bowlers (SlryWghtAgeBo; 3.74% drop), the percentage of batsmen returning to a team (PctRtBat; 2.87% drop), and the percentage of international bowlers (PctItBo; 2.17% drop) were identified as the covariates with the largest influences on winning percentage. The implied directional effects of these variables from the stepwise regression were negative, positive, negative, and positive, respectively.
Permutation scores for selected individual features.
Discussion
The results of the cluster and regression analyses revealed several trends relevant to the operations and economics of the IPL. To start, the clustering algorithm segmented the teams into three relatively distinct groups based on their behavior in the annual player auction. Table 2, which displays the standardized feature scores across clusters, shows that much of the differentiation between clusters can be attributed to spending behaviors—particularly the amount paid over base price and how the salary cap was distributed across player roles. Cluster 1 teams, for instance, consistently spent more on batsmen and all-rounders (z = 0.88 and z = 0.91, respectively) and demonstrated more balanced salary distributions across roles. These teams closely align with what prior literature refers to as resource-rich or resource-picking clubs—those attempting to acquire top-tier talent to bolster their chances of success (Hall et al., 2002; Lewis, 2004; Gerrard, 2007). Notable examples from Cluster 1 include the Delhi Capitals in 2009 and the Royal Challengers Bangalore in 2011. Both teams reached the playoffs with winning percentages of 71.43% and 69.23%, respectively, with Bangalore advancing to the finals that season.
By contrast, Cluster 2 teams adopted more conservative spending strategies, reflected in their lower z-scores for spending across all roles. These teams often relied on a mix of emerging talent and returning players, resembling to a degree what Gerrard (2007) termed a “David strategy.” This approach was evident in teams such as the Punjab Kings in 2014 and the Gujarat Titans in 2022. Both teams, despite their modest spending profiles, posted winning percentages of 78.57% and 71.43%, respectively, and reached the playoffs. Notably, the Titans went on to win the IPL title in their debut season, demonstrating that success in the league can stem from restrained and efficient financial strategies rather than aggressive spending.
Cluster 3 teams, meanwhile, fell somewhere between the other two in terms of overall spending but were differentiated by their positional allocations and inequality in salary distribution. These teams devoted a higher proportion of their finances to all-rounders and exhibited relatively higher Gini coefficients for batsmen, suggesting greater wage disparities within that group. Examples include the Mumbai Indians in 2017 and Delhi Capitals in 2021, both of which qualified for the playoffs with winning percentages of 71.43%. The Mumbai Indians ultimately secured the championship that season, illustrating that teams in this cluster, when executing their strategies effectively, are capable of converting targeted investments into title-winning performances.
Shifting to the relationship between team performance and sequences of clusters, results showed that longer-term sequences of strategies displayed a stronger fit to results relative to single-season strategies. Compared to a baseline strategy of 1-1-1 wherein teams consistently targeted offensive output, teams employing a similarly common 3-2-3 combination of strategies performed significantly worse; that is, sporadically focusing on bowlers and younger talent while maintaining a more continuous roster with lower-valued batsmen was not associated with winning to the same extent other, more consistently sequenced strategies were. The baseline strategy of 1-1-1, for example, gives teams an estimated winning percentage of 51%, relative to an estimated winning percentage of 38% in the 3-2-3 sequence. This alludes to the possibilities that effective strategies may need to be engrained within an organization's culture over a longer period of time (Gerrard, 2007), and that consistently targeting certain player types (e.g., core role holders) might allow teams to avoid dips in performance through specialization in key areas (Mondello and Maxcy, 2009). The former of these is also supported by the implications of dynamic capabilities theory, as stronger internal processes help organizations achieve larger competitive advantages, especially in environments (like the IPL) characterized by change (Teece et al., 1997). In essence, teams that maintain strategic continuity over time can leverage their capabilities more effectively than those that frequently shift to suboptimal strategies.
Indeed, strong links between single-season cluster membership and short-term performance-related outcomes were not apparent in the regression analyses. On a seasonal basis, teams’ clusters from the preceding auction showed no significant association with their winning percentage or likelihood of making the playoffs. The performances of teams in Cluster 2 and Cluster 3 did not significantly differ from those in Cluster 1. These findings persisted even after accounting for the previous year's performance and testing for interaction effects. One exception emerged in the interaction model, where Cluster 3 teams that had previously qualified for the playoffs were significantly less likely to do so again. This suggested that teams attempting a return to the playoffs decreased their probability of a repeat appearance if they followed the Cluster 3 strategies of selectively pursuing non-specialists (e.g., all-rounders) in the auction while maintaining a roster of (mostly) non-internationals at salaries near or below their base value. The permutated importance scores also provided signals that certain variables were more impactful on immediate team performance than others. For example, paying far above base for all-rounders and returning a higher percentage of batsmen (both traits of Cluster 3) were associated with negative returns to winning percentage, while the implied effects of older, more experienced bowlers and international bowlers were positive. Thus, IPL teams could look to avoid or further explore players with these features when building their rosters.
Nonetheless, the majority of the results were consistent with the broader parity observed in the IPL, where seven different franchises have claimed the title since 2008 (Indian Premier League, n.d.). The general lack of a clear relationship between labor market strategy and on-field performance may stem from a variety of structural factors. The IPL's labor market is highly regulated, featuring annual auctions, strict roster size limits, and spending caps that restrict the extent to which any team can dominate through financial resources alone. Similar dynamics have been observed in MLB, where player mobility and salary constraints have been shown to dampen the influence of payroll on team success (Hall et al., 2002). As Hall and colleagues noted, “restrictive agreements that limit player spending, player mobility, roster sizes, the right to trade players, and so forth have made it less likely that teams can fully use their financial muscle to buy success in baseball” (p. 166). The IPL appears to follow a similar trajectory, with its structural design fostering balance and reducing the competitive advantages associated with financial aggression. Even the shortened format of T20 matches has been noted as having “created a more level playing field” within the sport (Ray and Roychowdhury, 2021, p. 156).
Layered atop this institutional parity may be the effects of what auction theorists term the winner's curse—a situation where the highest bidder pays more than the actual value of the asset, often due to overestimation in competitive settings (Bazerman and Samuelson, 2021). In the IPL, where marquee players frequently attract aggressive bids, franchises may find themselves overpaying relative to actual performance value. Similar concerns have been raised in broader sports economics research, where inflated player valuations under competitive pressure have been shown to undermine efficient resource allocation (Szymanski, 2014). This may explain why Cluster 1 teams, despite spending more and targeting players with strong historical metrics (Chittibabu and Sundararaman, 2023), did not consistently outperform their peers in the short term. Overvaluation, lack of fit, or diminishing marginal returns may dilute the expected advantage of acquiring top-tier players (Kahn, 2000; Gerrard, 2007). Given the historical sparsity of analytics and data in cricket, a lack of quality information on player skills and team tactics may be hampering clubs’ roster management efforts.
These dynamics reinforce the limited predictive value of financial strategies in this context. The regression models consistently showed no significant link between these features and short-term success. Even after incorporating Gini coefficients for salary concentration and accounting for lagged performance, model fit remained weak. Only longer-term cluster sequences provided modest explanatory power, suggesting that sustained strategic consistency may matter more than any single-year approach. This stands in contrast to findings in less regulated leagues, such as the English Premier League, where wage spending correlates strongly with team success (Hall et al., 2002; Humphrey et al., 2009). Rather, the IPL's auction format, salary cap, and constraints on player movement mirror systems seen in North American sports where more revenues are shared and talent is constrained (Zimbalist, 2001; Mondello and Maxcy, 2009). These mechanisms appear to reduce the ability of financial resources to directly influence outcomes, requiring teams to rely more heavily on intangible and often unmeasured factors such as scouting, player development, cohesion, and leadership. This again alludes to the possibility of less observable dynamic capabilities playing a more vital role in the performances of IPL teams relative to the more observable features associated with a resource-picking strategy (Makadok, 2001; Teece et al., 1997). Strategies that are deemed successful in an open auction could rightly be copied by other teams, whereas knowledge-based advantages reliant on features that are unobservable or difficult to quantify could be the true drivers of performance.
Ultimately, our findings underscore the limits of financial strategies in more highly regulated environments like the IPL. Despite meaningful variation in how teams approach the auction, the league's structure appears to level the playing field, reinforcing the broader parity observed across seasons. This supports Hall et al.'s (2002) conclusion that in tightly controlled labor markets, success cannot be “bought” in a straightforward manner. As the IPL continues to evolve, future research should explore how intangible elements—such as team culture, analytics-driven decision-making, and leadership—mediate the relationship between resource allocation and team performance. Our findings suggest that efficient performance, especially in the short run, cannot be guaranteed through spending patterns alone, and that structural factors and market inefficiencies, such as the winner's curse, deserve greater scrutiny in future research.
Limitations and recommendations for future research
This study faced several limitations that could be addressed in future studies. To start, there are alternative approaches to selecting k that could be used to determine an optimal number of clusters. In an unsupervised method like k-means clustering, there is a degree of subjectivity inherent to the technique as users set the initial start value and ultimately determine the number of clusters based on their observations. Future research could employ alternative methods for deciding k or undertake an approach that varies entirely from k-means clustering (e.g., partitioning around medoids or density-based clustering). The choice of features, though designed to encompass elements (e.g., age, cost, and experience) typically considered by teams in the labor market, could also be enhanced with more detailed information and statistics. For example, further differentiation could be introduced within each position, and other performance metrics could be considered in place of those that were used. The order of our approach—identifying strategies from the raw data and then linking those strategies to performance—could also be reversed to see which strategic elements impact performance before clustering. The post-hoc analysis involving the permutation tests of the individual features revealed some features (e.g., AboveBaseAR, SlryWghtAgeBo, and PctRtBt) that may serve as viable starting points for future inspections of this kind.
Continuing, the models built to address the second research question could incorporate additional controls beyond outcome lags from the prior season. For instance, the structure of the annual auction, which varies between a series of mini auctions with a mega auction every few years, likely introduced some noise to our methods; however, due to sample size limitations, we treated each auction the same after adjusting certain features (e.g., the AboveBase features). Furthermore, the relative novelty of the IPL to other sports leagues severely restricted the usable sample for this study. With just 127 possible team-seasons—several of which were interrupted by scandals and suspensions that further reduced the sample when lagged variables were included—to examine, statistical interpretations were limited. In addition, the scandals themselves may have blurred the relationships between labor market strategies and team performance, as match-fixing and other rule-breaking efforts can affect match outcomes. We further acknowledge that the 2020 season was affected by the pandemic. Due to rising COVID-19 cases, the season was suspended in April and rescheduled for October in the United Arab Emirates. Though we retained this season in our data, future studies could test whether the pandemic had any unique effects on IPL teams’ strategies and performances. Therefore, it is recommended that future studies take advantage of a growing sample size while considering the potential impacts of these interruptions on team performance. A shift toward methods that better analyze performance in relation to a synthesis of short- and long-term strategies is also advised.
Conclusion
This study clustered IPL teams according to features that align with labor market strategies and analyzed the links between the resulting clusters and team performance. The cluster analyses showed approaches that could be categorized as (a) assertive acquisition strategies (aggressive bids above base-price that favored high-performing batsmen), (b) conservative, development-focused strategies (emphasized bowling talent, younger players, domestic players, and moderate spending), and (c) continuity-focused, selective investment strategies (below-average spending relative to base prices, more concentrated salaries, more returning players, and a proclivity for targeting high-performing all-rounders). Nonetheless, a series of regression analyses found non-significant relationships between cluster assignment and team performance, as neither winning percentage nor playoff probability varied significantly across clusters. Although models including longer sequences of clusters displayed stronger fits to performance, alluding to the potential need for interactivity and longevity in strategy-building, it seems the labor market mechanisms and regulations (e.g., annual auctions, salary caps, and roster limits) imposed by the IPL, combined with imperfect information and the potential existence of a winner's curse, may prevent any singular team or strategy from dominating in the short-term.
Footnotes
Ethical considerations
There were no requirements for ethical considerations for this study.
Consent to participate
Not applicable.
Consent for publication
Not applicable.
Funding
The authors received no financial support for the research, authorship, and/or publication of this article.
Declaration of conflicting interests
The authors declared no potential conflicts of interest with respect to the research, authorship, and/or publication of this article.