
Abstract
Despite the large number of systems that have been developed for rating and ranking major college football teams in the United States, only two prior studies have attempted to identify an ensemble of those models – i.e., a metamodel – that is most predictive of future game results. Using 29 college football rating systems, data for 5925 games during 2016–24, and a k-fold cross-validation process focused on model predictiveness, a five-system metamodel is developed to predict the victory margin for games in the ensuing week. The model achieves strong results vis-à-vis the opening, midweek, and closing betting lines, and is statistically significant in the presence of the opening line in validation and test samples. The model is potentially useful for the College Football Playoff committee, media, fans, the betting market, and oddsmakers, and provides a benchmark against which future rating systems can be assessed.
Introduction
College football in the United States enjoys enormous popularity. Attendance at games in 2022 totaled 42.3 million, more than double that of the National Football League, with a television audience more than double that of the National Basketball Association and the National Hockey League combined (Playfly, 2023). In 2024, ESPN agreed to pay $7.8 billion for the media rights to the post-season College Football Playoff (CFP) national championship tournament through 2032 (Dinich, 2024a).
Partly as a result of that popularity, the rating and ranking of major college football teams has also been the subject of a substantial interest, including in the academic literature (Buchman and Kadane, 2008; Coleman, 2014; South and Egros, 2020). With each team playing only about 10% of the other (currently) 130 + teams over the course of a season, the only means by which teams can be assessed and compared nationally has been via opinion polls or so-called computer (i.e., mathematical) models. As a result, weekly rankings and/or predicted victory margins from well over 100 sources are regularly posted online during each season, with the vast majority of these being mathematical (Beck, 2025b; Massey, 2025b).
These methods have had and continue to have a major impact on the sport. Prior to 1998, the designated national champion was identified using the media opinion poll from the Associated Press, or the opinion poll from an array of head coaches across the nation. An average of the Associated Press and coaches polls, along with the trimmed mean of six computer rankings, were directly used during 1998–2013 by the former Bowl Championship Series (BCS) to determine the two teams that played in each season's designated national championship game (Buchman and Kadane, 2008). With the advent of the CFP in 2014, four championship playoff participants were identified by a selection committee – a list that expanded to 12 teams in 2024. Although the committee's selections are ostensibly opinion-based, the committee is provided a “wide variety of data and information” to assist in its decision-making, and “each committee member will independently evaluate an immense amount of information during the process” (College Football Playoff, 2025). Thus, it seems likely that various ratings and rankings might be employed by individual members and/or by the committee collectively during their deliberations.
The predictive accuracy of many such models is regularly evaluated by Beck (2025b) and Massey (2025b). Both sources report each model's accuracy at predicting games in the week immediately after the method's ranking or prediction is posted, and/or its collective accuracy over the course of the full season. Beck reports prediction accuracy both “straight up” and against the spread (i.e., against the closing betting line). In addition, both Massey and Beck report the predictive success of the consensus – i.e., the mean or median – of all models.
Notwithstanding the focus on the performance of individual systems, the predictive accuracy from combinations of forecasts – so-called ensemble or metamodels – are frequently superior to predictions from a single source (Coleman, 2014). Both Massey and Beck capture this in part using the consensus rankings or consensus predictions noted above. However, in their cases all models posted in each week are included, and each one is weighted equally. A more fundamental question is whether there is a subset of models that is collectively superior to others, and if so, what weight should be applied to each model to achieve the maximum possible prediction accuracy.
Despite the large number of college football rating and ranking systems, there are only two known published studies that have addressed that research question. Fair and Oster (2007) examined nine systems and data from 1998–2001 and identified an ordinary least squares (OLS) model including five systems. When compared against the closing betting line in 2002, all systems in their best model were found to be statistically insignificant in the presence of the line. Coleman (2014) assessed 36 systems and data from 2004–11 to develop a logistic regression model that included two systems that were shown to be statistically significant in the presence of the betting line for bowl games. Buchman and Kadane (2008) investigated a similar question of whether the three components of the BCS ranking should be weighted differently than the one-third that was applied to each one. However, that study did not examine a wide variety of additional math models as potential predictors, nor did it examine whether the weights applied to the six computer models that made up one component should be non-uniform.
The Fair and Oster (2007) and Coleman (2014) studies share several commonalities. For each game in the current week, the difference between a system's ordinal rankings of the two teams after the previous week's games was used as the predictor. To account for home field advantage (HFA), a global binary HFA factor applicable to all games was included. Statistical significance was used to guide variable selection in both studies. Sample sizes in both cases covered only games in roughly the latter half of the season, and both studies used the closing betting line as the comparative.
Research contribution
The research reported herein seeks to advance Fair and Oster (2007) and Coleman (2014) in several ways. More recent data from 2016–24 is used, along with much more precise predictors: the projected victory margins from each system, instead of the differences in team rankings. These projected margins factor in an HFA effect that is perhaps unique to each system and/or to individual home fields, thereby also enhancing precision. Instead of statistical significance, variable selection is performed using a k-fold cross-validation process focused on model predictiveness. Full seasons of games are used to enhance the sample size, but statistical testing is done to determine whether differing effects exist across each half of the season.
Finally, performance is assessed against the opening, midweek, and closing betting lines. The opening line is arguably the more appropriate and direct comparative when examining rating system predictiveness, as ratings are very likely based only on what is known immediately after the games of the previous week. The midweek and closing lines reflect any additional information introduced into the market in the ensuing time prior to the next game, which is likely not considered in any way by the rating systems. That information could include the market's digestion of the system predictions themselves, which likely are not fully public until after the opening lines are posted.
Findings are potentially of interest to a wide variety of constituencies, including the CFP committee. While many models might be available to the committee now or in the future, there is no known guidance provided as to which are necessarily superior, or guidance as to how each one should be weighted. Fans and media would be interested in using the research below to project game winners in the upcoming week, and/or to assess the strengths of teams as the season progresses. Obviously, the gambling public may be interested in assessing favorites and underdogs in upcoming games, and there could be interest from oddsmakers involved in setting opening lines. Finally, the metamodel identified below provides a potential benchmark against which researchers on rating and ranking systems in the field can assess future work.
Methodology
Data were collected from Beck (2025c) for the 2016–24 seasons, omitting the COVID season of 2020. Each week during every college football season over the last 25 years, Beck (2025a) has provided an a priori compilation of victory margin predictions for the upcoming games of that week from an expansive list of contributing sources, including the opening, midweek, and closing betting lines. He has also regularly posted the comparative performance of those sources (straight up and against the spread) each week as well as cumulatively during the respective season (Beck, 2025b). Further, Beck has archived all predicted margins for all weeks of each season during the same time span at Beck (2025c). Beck has been referenced by sources who contributed to the rankings used by the BCS (Billingsley, 2015; Massey, 2025a), and his site has been cited previously in the academic literature (Coleman, 2014; Pasteur, 2010a; Pasteur, 2010b). He was thus viewed as a reliable data source for the current study.
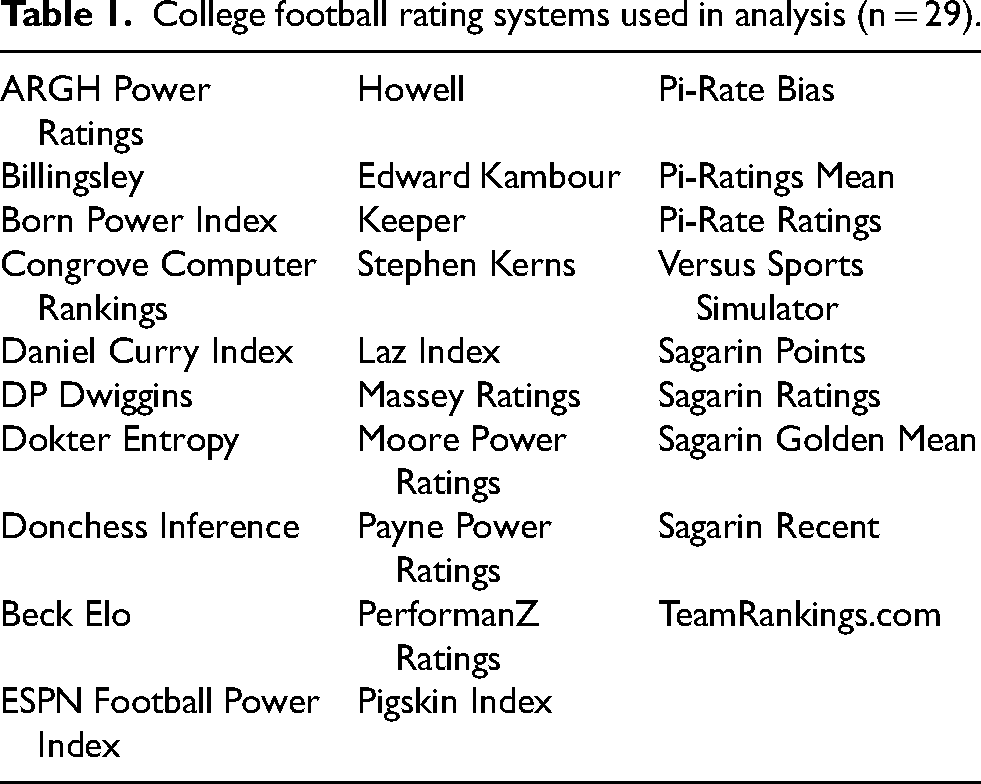
Five cases involving postponed games with obvious errors on team scores were deleted, and an obviously incorrect sign on a betting line was corrected for another game. Otherwise, the data were examined as collected from Beck. To assure that the metamodel employed systems currently in use, the sample was delimited to 29 systems (see Table 1) with predictions posted for at least 99% of the games in the Beck data between 2016 and 2022, and for at least 98% of the games in 2023–24. Because data availability eroded substantially for the same systems prior to 2016, the sample was limited to 2016–24. The total sample included 5925 games for which all 29 systems posted a prediction.
College football rating systems used in analysis (n = 29).
A total of 4416 games during 2016–22 (omitting 2020) was used for model training and validation, and 1509 games during 2023–24 were used for model testing. The victory margin in each game was used as the dependent variable, and the projected victory margins from each system were used as the predictors.
Model estimation and variable selection were performed via forward selection and six-fold cross-validation, and using the predicted sum of squares (PSSE) across the holdout samples from each fold as the selection criterion. At each stage, one of the six in-sample seasons was incrementally held out, no-intercept OLS models were estimated on the remaining data after adding each system individually to the incumbent model, predictions were made for the holdout season using the estimated OLS for each system, and each system's PSSE was computed for the holdout season. The system with the lowest PSSE across all six holdout seasons was then added to the incumbent model, and the process repeated until no additional system decreased total PSSE. After termination, the final metamodel was estimated over all in-sample data using the systems identified in the selection process.
Using PSSE as the selection criterion focused the process on the predictive capacity of each model, and not necessarily its statistical significance. Additionally, the use of cross-validation helped to reduce potential overfit to the training data, while also retaining a larger training sample size than would be available had the in-sample data been split into separate training and validation subsets. The predictions for the validation data also were obviously more likely to represent out-of-sample performance than predicted values on training data alone.
The only additional restriction was that any system coefficient had to be positive. While it's possible that the most predictive metamodel could include systems whose predictions offset others (Fair & Oster, 2007), such a restriction helped to promote potential model receptiveness by users. Systems with negative relationships to game results would be more challenging to explain to laypersons, and thereby potentially lead to less use of or trust in the results. This approach also likely helped to reduce model overfit.
Results and discussion
Table 2 contains a summary of the identified metamodel – heretofore referred to as model MM – which includes only five of the 29 systems. Although statistical significance was not a selection criterion, all five systems were significant at least at the 0.05 level in the hypothesized positive direction. There were four systems originally included in the best models from Fair and Oster (2007) and Coleman (2014) that were among the 29 examined herein. Fair and Oster's best model included the systems from Billingsley and Sagarin (as well as four others not among the current 29), with Sagarin having the strongest statistical significance, and Coleman's best model included the systems of Born and Edward Kambour, each with p-values less than 0.0001 in that study. However, none of those four systems identified by previous research were selected for model MM.
Ordinary least squares metamodel from forward selection (p-values one-tailed).
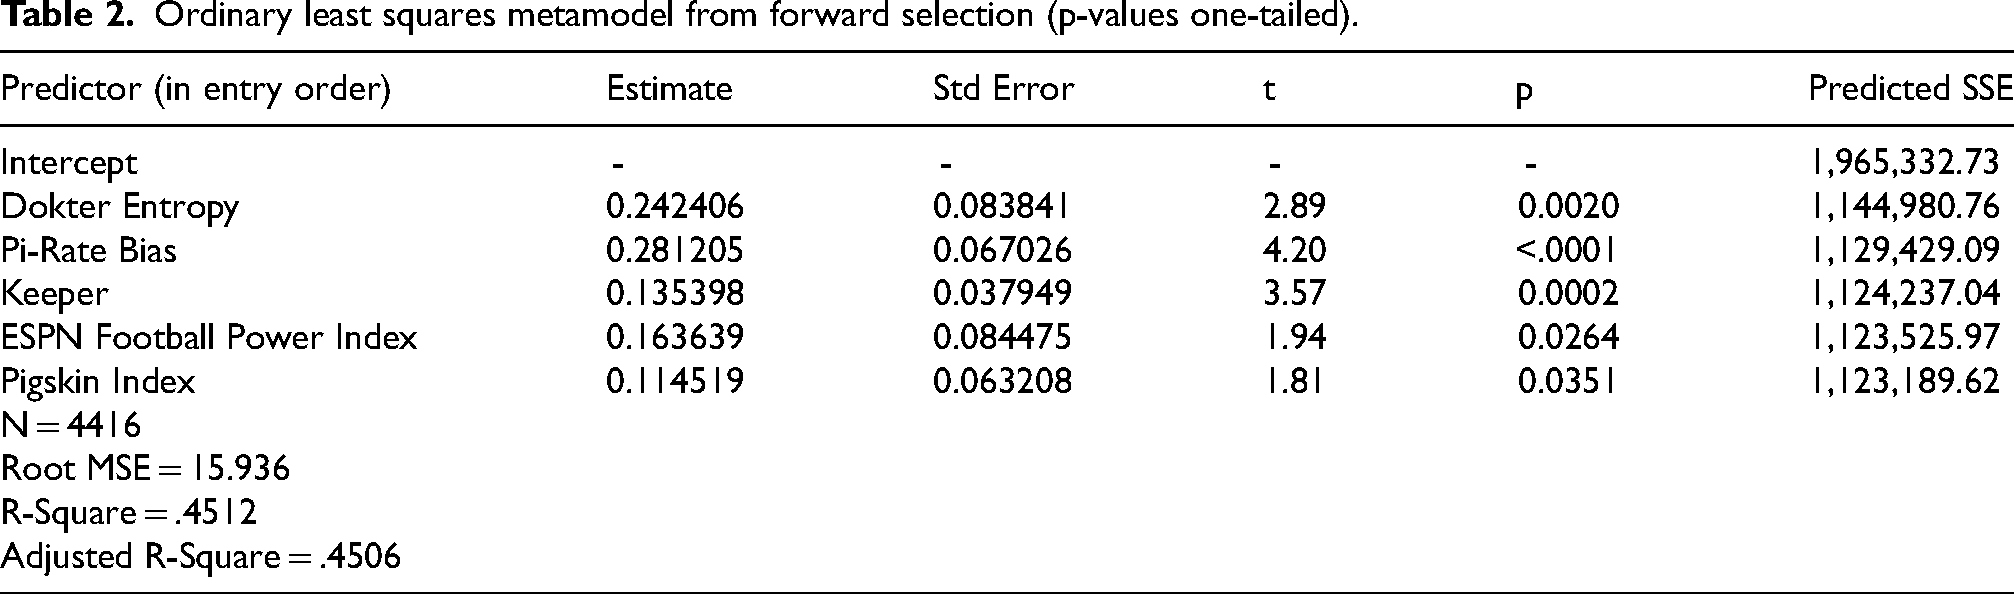
Table 3 contains the MM predictive performance across the six-season validation sample, as well as the test data of 2023 and 2024. MM predicted the same percentage of game winners in both samples (72.96%), with slightly better mean error (or bias) and mean absolute error measures in the test sample than in the validation sample.
Performance of metamodel (MM) and adjusted metamodel (MM*).
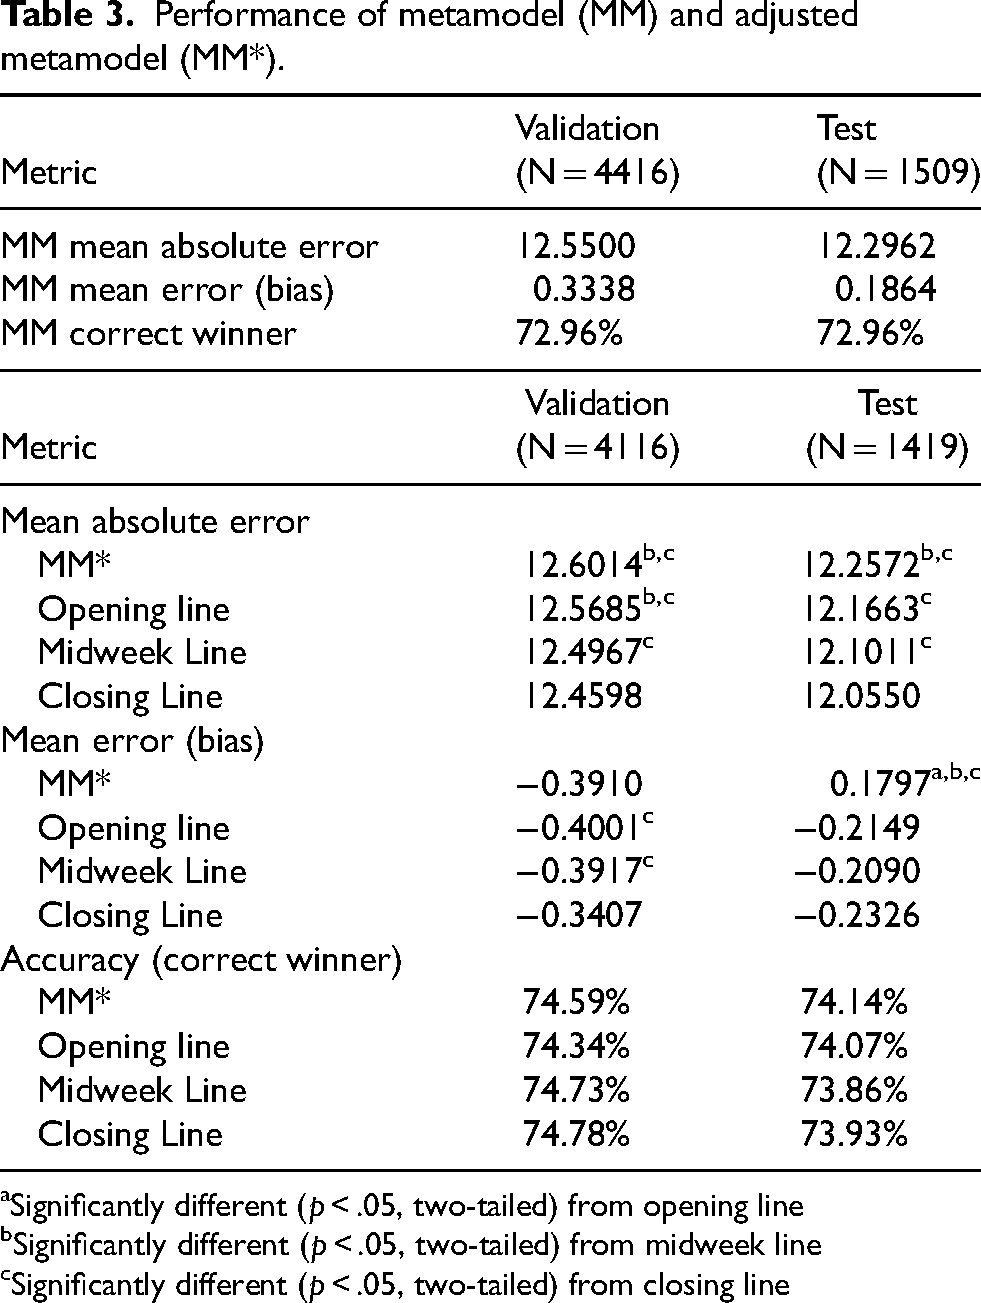
Significantly different (p < .05, two-tailed) from opening line
Significantly different (p < .05, two-tailed) from midweek line
Significantly different (p < .05, two-tailed) from closing line
To put that performance in context, Table 3 also includes the performances of the predictions from the opening line, the midweek line, and the closing line. To make comparisons to the lines more direct, predictions from MM were adjusted to “betting line-like” values (referred to as MM*) by rounding to the closest half-point. Because ties are impossible in college football, betting lines are never 0.5. Thus, MM* predicted margins that rounded to 0.5 were similarly truncated to zero. The games used in Table 3 include only those for which all betting lines were available and for which all lines and MM* made a prediction. A line or MM* was deemed not to make a prediction when it was zero (“pick-em”).
The MM* mean absolute error was less than a tenth of a point higher than that of the opening line in both the validation and test samples, a gap that rose to as high as two tenths versus the closing line in the test sample. In both samples, the difference versus the opening line was insignificant at the 0.05 level (two-tailed) using Wilcoxon tests, whereas the differences versus the midweek and closing lines were statistically significant. However, the mean error of MM* was slightly better than all three lines in the test sample, indicating a better centering of predictions. MM* accurately predicted 74.59% of the game winners in the validation sample, slightly better than the opening line, and slightly worse than the midweek and closing lines. However, the MM* accuracy in the test sample of 74.14% surpassed all three lines. McNemar tests indicated no statistically significant differences at the 0.05 level (two-tailed) in the accuracy of predictions between and among MM* and any of the three lines in both the validation and test subsets.
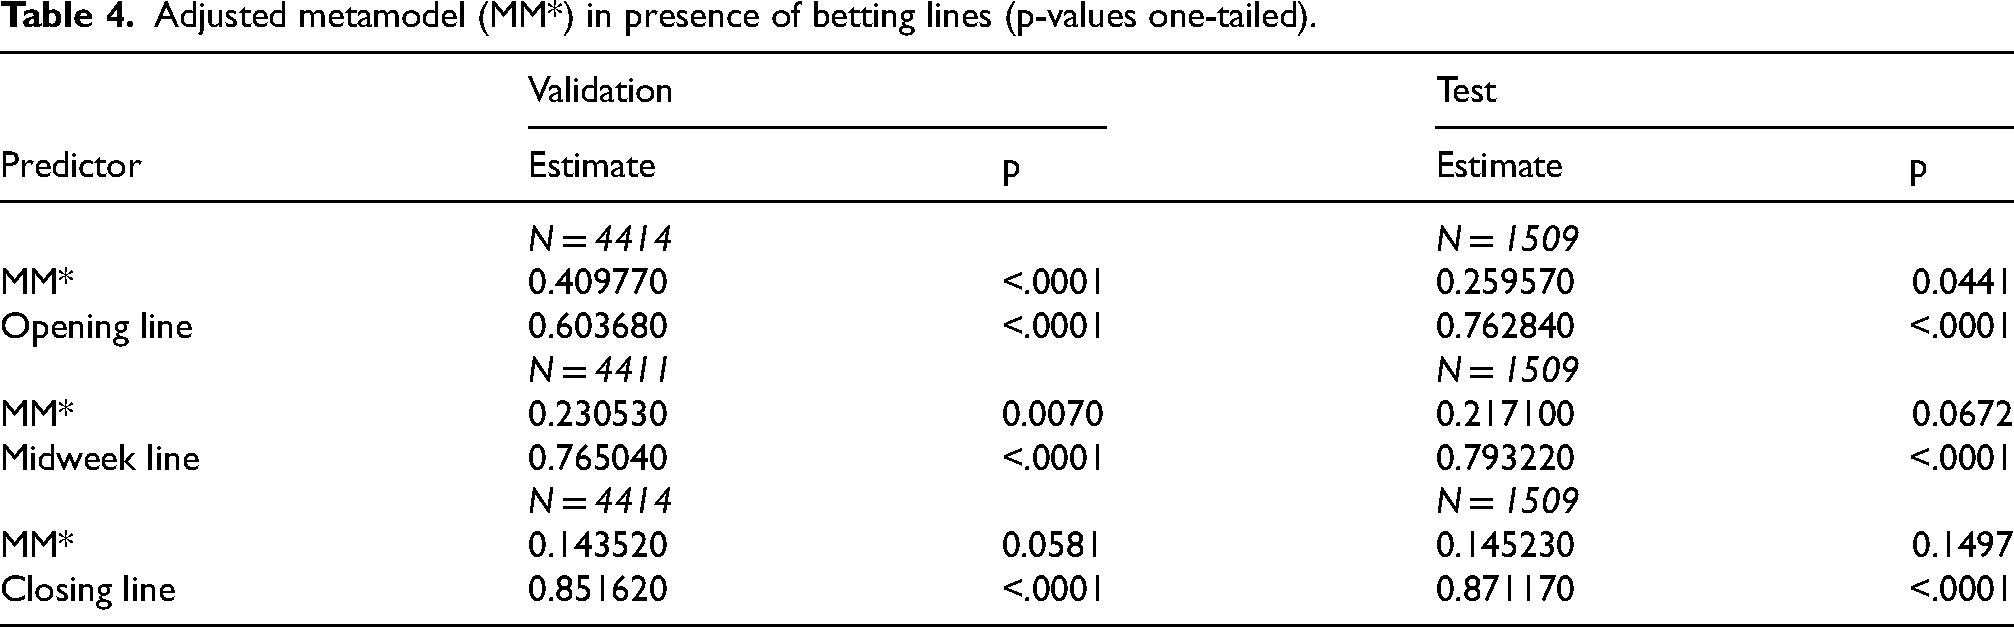
To further investigate MM* vis-à-vis the lines, no-intercept OLS regressions were estimated for both validation and test samples using the predicted values of MM* as one independent variable and each line as the only other. Results are shown in Table 4. MM* was significant in the presence of the opening and midweek lines in the validation sample, and nearly so in the presence of the closing line, with coefficient sizes and significance levels monotonically decreasing (as would be expected) from the opening to the closing line. MM* was also significant in the presence of the opening line in the test sample, albeit with a smaller coefficient than in the validation sample. MM* was insignificant in the presence of the midweek and closing lines in the test sample, although its coefficients were nearly identical to the validation sample coefficients. These findings illustrate the learning process of the betting market as additional information is digested during each week – information that is presumably not available to or analyzed by the math models.
Adjusted metamodel (MM*) in presence of betting lines (p-values one-tailed).
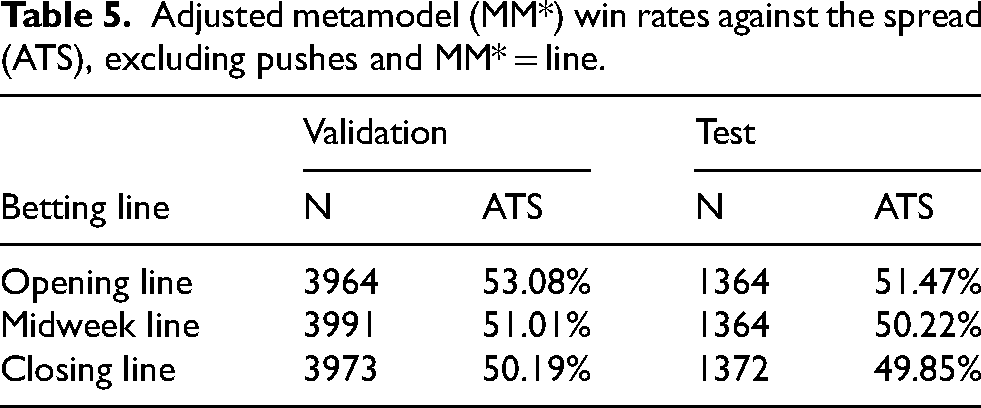
As a final examination of predictive accuracy vis-à-vis the lines – although not an evaluation of its feasibility as a profitable betting strategy – MM* was assessed against the spread using a target win rate threshold of 50%. (Assessment as a betting strategy would require using 52.38% as the benchmark to account for the typical 10% vigorish in legal outlets.) Table 5 shows the MM* win rate against all three lines, assuming a bet on the favorite when MM* exceeded the line, and a bet on the underdog when MM* was less than the line. Five of the six win rates reported in the table were at least 50%, with performance eroding with the temporal progression of the lines. As would be expected given the results above, performance against the opening line was strongest, with a validation sample win rate (53.08%) that was strongly statistically significantly greater than 50% (p < .0001). While the overall win rate against the opening line in the test sample was insignificant, when the gap between the MM* and the opening line was more than a field goal in that sample (n = 291), the win rate was a significant 55.33% (p < .05, one-tailed). Thus, when MM* and the opening line differed considerably, MM* was the better predictor, thereby providing further evidence of its validity as a predictor of college football games.
Adjusted metamodel (MM*) win rates against the spread (ATS), excluding pushes and MM* = line.
For all findings reported above and in Tables 3 through 5, the MM* performance versus the lines was insignificantly different in the initial eight weeks (first half) of the season versus the second half (weeks 9 and beyond) in both validation and test samples. This provided justification for the use of early-season data in addition to the late-season data that were used in prior literature.
Potential implementation in practice
An advantage of MM is that it can be implemented rather easily even by a casual observer, including any fan with a modicum of expertise. As aforementioned, Beck (2025a) regularly posts predicted margins from all contributing sources prior to the games of each week during the season, including in a downloadable CSV file format. Moreover, each of the sources included in MM also typically provide their predicted margins for each game on their respective web sites (Dokter, 2025; ESPN, 2025; Hawley, 2025; Keeper, 2025; The PiRate Ratings, 2025), which could be consulted if/when a given source's prediction is not posted on Beck's site. Determining the predicted margin from MM simply requires that the predicted margin from each of its input sources be multiplied by its respective coefficient in MM and then summed.
Researchers and developers of alternate models of college football team performance can easily apply MM to the archived data at Beck (2025c) and/or to the weekly predictions posted at Beck (2025a) to generate a high-performing benchmark against which their own models can be assessed. Similarly, Beck could include the MM predictions on his site as a standard against which the other compiled models can be measured.
Oddsmakers within the betting market who are involved in setting opening lines might have interest in MM as an input. MM predictions could be referenced by media in conjunction with and/or as comparatives to the lines to generate viewer interest; e.g., as projections from the best of the computer models.
The MM results are potentially useful for any parties (such as some media) who may not wish to cite betting lines, but who nevertheless want to discuss favorites and underdogs for upcoming games, or to assess team performances in retrospect; e.g., to assess the magnitude of upsets, or the over- or under-performance of teams versus expectations. Such parties might include even the College Football Playoff selection committee. Whereas the committee would be presumably loathe to use or cite betting lines either formally or informally in its discussions, MM could be used instead to generate what is essentially a substitute for the betting line.
Additional potential uses by the CFP committee include using MM to generate a composite ranking from the five sources in MM. Although those sources provide game-by-game predictions such as those used herein (which also account for ancillary effects such as home field advantage), they also regularly produce rankings of team strengths as well. The ranking from each source could be weighted using the coefficients in MM, with the resulting sums then rank-ordered to generate a composite ranking. Each team's composite ranking could be included on the team sheets that are provided to the committee members to assist in their deliberations (Dinich, 2024b).
Such a composite ranking could even ultimately be used by the CFP as a direct input into determining the teams selected to participate in the playoff. As noted earlier, the CFP's predecessor, the BCS, used rankings from six advanced analytics models (none of which were selected for MM) as primary and direct inputs into determining its overall composite ranking (Buchman and Kadane, 2008). The CFP currently has nothing remotely similar to that arrangement. Indeed, present stipulations issued to the committee by the CFP restrict any committee member from using data from any source that are not fully understood by the committee member (Dinich, 2016) – which could preclude even some of the potential uses cited above. However, recent remarks from coaches and administrators across the sport have called for a return to the use of an “objective computer-based ranking system” and advanced analytics models such as those used by the BCS (Bahns, 2025; Dellenger, 2024; Dinich, 2025). At a minimum, the CFP is mulling the inclusion of additional new or different data to provide to the committee, including enlisting the aid of external mathematicians and data analysts in the process (Dellenger, 2025), with various noted analytics experts in the sport suggesting that a combination of rankings should be considered (Russo, 2025). If so, and if predictive performance is a quality desired by the CFP, then MM identifies the five systems that arguably should be used, and the relative weights that should be applied to each.
Conclusion
The five-factor metamodel presented above appears to be an excellent predictor of major college football games. The model is quite strong against the opening betting line, which is arguably the fairest comparison that captures similar market information. Operationally, the model can be easily communicated to laypersons as a weighted average of five systems. The model is potentially useful for the College Football Playoff committee as an assessor of team strengths, as well as a strong proxy for the betting line, the use of which by the committee would be presumably verboten. The metamodel also holds strong potential interest from media, fans, the betting market, and oddsmakers, and provides a benchmark against which future rating systems can be assessed.
Footnotes
Author contributions
All elements of the research and manuscript construction were performed by the author.
Funding
The author received no financial support for the research, authorship, and/or publication of this article.
Declaration of conflicting interests
The author declared no potential conflicts of interest with respect to the research, authorship, and/or publication of this article.
Data availability
All data are publicly available at the sources cited in the references.