
Abstract
Predicting the outcome of cricket matches prior to their start is challenging due to the inability to generate real-time information from the thousands of data points generated by each match. Twitter (now “X”) and other social media sites have demonstrated their capacity to produce content in real time. This study proposes a machine learning-based method for predicting the results of T20 international matches (before they begin) using historical and Twitter data. A sentiment analysis was carried out to create a feature by considering three leading methods, revealing that the fine-tuned RoBERTa-based model outperformed those using LSTM and VADER with an F1 score of 95.3%. Three datasets were formulated, with historical, Twitter, and both data types. The XGBoost classifier produced the best models for all three datasets, and it was found that removing correlated and least important variables enhances their performance. Models using Twitter data outperformed those using historical data, while models using both data (with a 73.7% F1 score) outperformed both individual data models. Moreover, this best model performed better than the bookmakers’ predictions and could generate a profit by accurately predicting 11 matches out of 14 for the T20I World Cup 2022 data.
Introduction
Sentiment analysis on social media has become an essential task for understanding public opinion and sentiments regarding various topics (Omar and Abd El-Hafeez, 2023). Recent studies have demonstrated that social media crowds, especially those using Twitter (“X”) tweets (posts), have the ability to predict real-world events (Cheng et al., 2021). The popularity of Twitter has increased since its launch in 2006. Of the 556 million active users of the platform, 61.2% use it to stay up to date on news and current events (DIGITAL 2023: GLOBAL OVERVIEW REPORT, 2023). Unlike Facebook postings, which can be private to specific viewers, tweets are public by default. Even though Twitter doubled message length to 280 characters in 2017, tweets continue to be shorter and more to the point than other social media posts. The Twitter hashtags allows users to search for and categorize specific topics, allowing for sentiment sorting. Moreover, researchers and analysts have shown that social media data, particularly tweets, can be a valuable addition to historical data when making predictions.
Football, considered the most popular sport in the world, has been the subject of a significant amount of research of this kind (Kampakis and Adamides, 2014). For a real-world example, in 2021, Phil Lynch, head of media at Manchester United Football Club, disclosed that the club uses fan sentiment graphs based on social media content for each player (“Phil Lynch on Manchester United's media strategy and ‘the Ronaldo effect,’” 2021). However, when it comes to cricket, a limited number of studies have been conducted to predict the match outcome compared to football.
With more than 2.5 billion estimated fans, cricket is the second most popular sport in the world behind football (World Atlas, 2020). It is popular primarily in the United Kingdom and certain former British colonies, such as India, Pakistan, and Sri Lanka. Cricket has three main formats: International Level - Test, One Day International (ODI), and Twenty20 International (T20I). Test format, the oldest format, consisted of four innings and played up to five days, while ODI matches consisted of fifty overs (300 deliveries) per side. T20 is the shortest format of cricket, with each team getting to bat for 20 overs (120 deliveries) and usually lasting around 3–4 h. T20 cricket matches do not have much history. The first T20I was played on February 17, 2005, between Australia and New Zealand. There is a tremendous interest in cricket, especially T20 matches, due to its high-scoring, energetic, and shorter nature, both socially and commercially. Based on this format, many cricket-playing countries now have their own franchise-based cricket tournaments. For example, India has the most famous premier league, the Indian Premier League (IPL), Australia has the Big Bash League (BBL), and Sri Lanka has the Lanka Premier League (LPL). These leagues also support the development and popularity of cricket internationally.
According to ICC Men's Twenty20 International Playing Conditions, 2022, between 30 and 15 min prior to the planned start time, the toss for the decision of bat first or field first is conducted under the supervision of an ICC match referee. Before the toss, each captain must provide a written list of 11 players, along with a maximum of four substitutes. Because of these reasons, team management, coaches, and players always try to prepare well in advance before a match. If they can get an idea of what's going to happen in the match and the result even before the toss, it will be a great help in making their decisions. On the other hand, companies and franchises want to know about public sentiment toward each team so they can decide which team to invest in. Even broadcast channels invite experts to their studios to discuss, analyze, and predict the match winners to boost viewership and ad revenue. Moreover, cricket has a large pre-match betting industry, and millions of dollars are wagered on cricket matches. Due to these reasons, developing an accurate model to predict the outcome of a T20 match before it begins will be extremely beneficial to many parties.
However, due to the complexity, predicting and obtaining high accuracy rates in cricket matches, particularly in the T20 format, is still one of the most difficult tasks. When it comes to predicting the match outcome before the match starts, it becomes even more difficult. Every cricket match generates numerous data points, but extracting certain real-time information like players’ injuries, sentiment towards the teams, and match-banned players, which plays a crucial role, from those historical data points is not possible. The prediction models developed in earlier cricket research have either focused on historical features or Twitter data. To the best of the author's knowledge, this study is the first effort to develop a model to predict the winners of T20I cricket matches before starting, utilizing both historical and Twitter data.
The study's main objective is to build a suitable model using machine learning to predict the winner of the Twenty20 International Cricket matches before the match starts by considering both historical data and features derived from Twitter. In addition, there are several secondary objectives: to build a model for classifying the pre-match tweets as positive or negative using an efficient sentiment analysis technique, to study whether Twitter-derived features can provide useful information to predict match outcomes, and to check whether there is any potential profit from pre-match betting using the proposed model.
The paper is divided into five sections. The second section, Literature Review, reviews the relevant literature on the study's subject. Section three describes the research design, the data collection, sentiment analysis, data analysis, and model building. Section four provides the results of the study. The last section summarizes the study's main findings, identifies the limits, and provides suggestions for further research.
Literature review
Studies on machine learning regarding cricket have slightly increased since 2010. Around 35% of those research studies have focused on game outcome prediction, while only 4% of studies have considered cricket commentary or media for the studies (Wickramasinghe, 2022). When predicting the outcome of a cricket match, past studies focused on two main approaches: using historical data and using collective (social) knowledge (Hatharasinghe and Poravi, 2019). Out of those two approaches, the first one is the most popular among researchers.
The objective of Kaluarachchi and Varde (2010) was to predict the chances of victory in the ODI matches and to develop a tool for that prediction. They considered Naïve Bayes, Decision Tree classification using C4.5, Bagging, and Boosting. Naïve Bayes was the best classifier for the concerned dataset. Further, they observed that winning the toss does not significantly affect the outcome. However, they didn't consider the previous match results and statistics of the two teams. Sankaranarayanan et al. (2014) used historical data and the instantaneous state of an ongoing match to predict the ODI match outcome and progression of a match. According to the findings, accuracy was between 68% and 70%. They not only considered past data but also instantaneous features.
When considering the T20 format, Kampakis and Thomas (2015) carried out a study to predict the outcome of the English County twenty-over cricket matches before the commencement of the match. This study considered only statistically-based historical data. They developed two main models: the first consisted only of team data, and the second consisted of both team and player data. Out of Logistic Regression with PCA, Naïve Bayes, Random Forest, and Gradient Boosting, the Naïve Bayes classifier produced the best results for both models, with the first model, which used solely team data, having an accuracy of 62.4%. They concluded that, from their second model, which consisted of both team and player data, it was possible to predict the match outcome in almost two-thirds of instances. Since they didn't consider external data, such as social media comments, they think that if they did, they could increase the accuracy of the models.
Lamsal and Choudhary (2018) considered the most famous franchise-based premier league of all time, the Indian Premier League (IPL), and trained six machine-learning models to predict the outcome of the 2018 IPL matches 15 min before the match started, after knowing the toss decision. They got more than 60% accuracy for SVM, Logistic Regression, Random Forest, and Multilayer Perceptron Models. The best F1 score came from the Multilayer Perceptron model (72%). Since the model considers the toss decision, it is not useful to parties who are interested in knowing the outcome before the toss.
Ul Mustafa et al. (2017) evaluated how well machine learning models performed in predicting the outcome of a cricket match before the start using pre-match tweets gathered from Twitter pages. After creating a list of nicknames along with the most popular hashtags for each team, they scraped tweets and calculated three features: tweet volume, aggregated fans’ sentiment score, and average predicted score. To find the sentiment of a tweet, they selected a set of linguistic features using the TF-IDF score and used it to group the tweets into positive or negative categories. However, when meeting a new linguistic feature, it will not be possible to find the sentiment of tweets since this analysis is based on a pre-defined set of features. Support Vector Machine, Naïve Bayes, and Logistic Regression were considered and got up to 75% correct predictions for the large-scale data analysis and verified them on CWC15 and IPL2014 data. The final results showed that SVM performed better than the other two classifiers.
All the studies discussed above were conducted by considering either historical data or social media data, but not both. Wickramasinghe and Yapa (2018) considered both statistical data and social media data. By considering the complete dataset for the considered IPL matches, three models were built: one based only on natural variables, the second based only on features retrieved from Twitter, and the last based on both natural parameters and tweets. A second set of models was built to investigate how prediction accuracy changed after every ten overs with only tweets. Up to 85% accuracy was obtained from the proposed sentimental model. Logistic Regression, SVM, Naïve Bayes, and Random Forest were considered when training the prediction models. Logistic regression was the best classification approach for both tweet-based and natural parameter-based models, and SVM was the best for the combined model. The combined model performed better than the other two individual models. However, this study merely took into account IPL data and was not specifically designed to predict the T20 match outcome before the commencement.
Unlike cricket, football is subjected mostly to this kind of study. Kampakis and Adamides (2014) investigated whether features derived from tweets can be used to predict whether an English Premier League game will end in a home team win, an away team win, or a tie before the game begins. For the study, they considered three datasets: the Twitter dataset, the historical dataset, and the combined dataset merged from the two initial datasets. Tweets were gathered using the Twitter streaming API. They made a list of hashtags closely related to the respective teams, along with any possible nicknames. When creating the dataset, they didn’t consider the tweets that contained hashtags for more than one team. A bag of unigrams or bigrams represented the home and away features of the Twitter model, and each club's statistics represented the features of the historical model. Finally, they were able to prove that it is possible to predict the outcome of English Premier League games with features extracted from Twitter. The Twitter-based model performed better than the historical statistics model, while the combined model outperformed both individual models. For both the Twitter model and the combined model, Random Forest gave the best results, and for the historical model, Naïve Bayes gave the best result. However, the study conducted by Schumaker et al. (2016) for match and point spread prediction only using Twitter used another way to deal with the tweets that contained hashtags for more than one team. They labeled tweets with more than one hashtag with the first club hashtag. They believed that when two or more clubs are mentioned in a tweet, Twitter may have wanted to place more focus on the first club mentioned. Godin et al. 2015 also wanted to predict the winner of soccer games in the English Premier League (EPL) 2013–14 before the match began, utilizing both statistical data and collective wisdom that was extracted from the tweets. The top 10,000 unigrams were used to create a sentiment classifier for this study using SVM, which was trained on 3400 manually annotated tweets. Then, using this classifier, they classified the filtered tweets out of the 50 million scraped tweets posted 24 h before the game into three categories: positive, negative, and neutral. Naïve Bayes, Logistic Regression, and SVM were applied to this dataset. Finally, they came to the conclusion that a mix of statistical and Twitter-based information could outperform expert and bookmaker predictions.
Almost every study that utilized tweets to predict the match outcome considered a rule-based or traditional machine-learning approach to find the sentiment of tweets. In order to find a fresh and more accurate approach to finding the sentiment of tweets, different study domains were taken into consideration. Lay et al. (2019) noticed that in most of the studies related to sentiment analysis, researchers use manual data labeling, which takes a lot of time and money. Therefore, they suggested a semi-supervised learning strategy using mostly unlabeled data and only a small portion of labeled data from the IMDB dataset. The outcomes demonstrated that the unlabeled data did assist in model training without having a negative effect on the model's performance. Al-Shabi 2020 focused on five of the most significant lexicons: VADER, SentiWordNet, SentiStrength, Liu and Hu opinion lexicon, and AFINN-111. They made an effort to assess the most significant lexicon utilized in the field of sentiment analysis using data from Twitter. Their findings indicated that VADER has the highest accuracy for classifying tweets as positive or negative. Ghasiya and Okamura (2021) classified headlines using the cutting-edge RoBERTa sentiment classification algorithm. They achieved 90% validation accuracy with that model, which outperformed the other traditional models.
In conclusion, many studies on cricket focused on the ODI format. Out of the few studies done on Twenty20 matches, the majority of them have been based on league matches. These studies considered either historical match data or social media opinions, and most of them have taken into consideration instantaneous features and ongoing match status as well. Among the studies carried out to predict the match outcome before the match starts, predict the match winner after the toss. Therefore, the study addresses these research gaps by developing a more accurate model to predict the winner of T20 international matches even before the toss based on both historical and social media data. Moreover, the previous studies developed their sentiment analysis models using a rule-based approach or traditional machine learning models with limitations. Therefore, in this research, a new approach is introduced for sentiment analysis as well.
Methodology
Research design
The study involved three phases to develop prediction models: first phase, focusing on historical and basic statistical data; second phase, incorporating features from tweets; and finally, building combined models with both historical and Twitter-derived attributes (Figure 1).
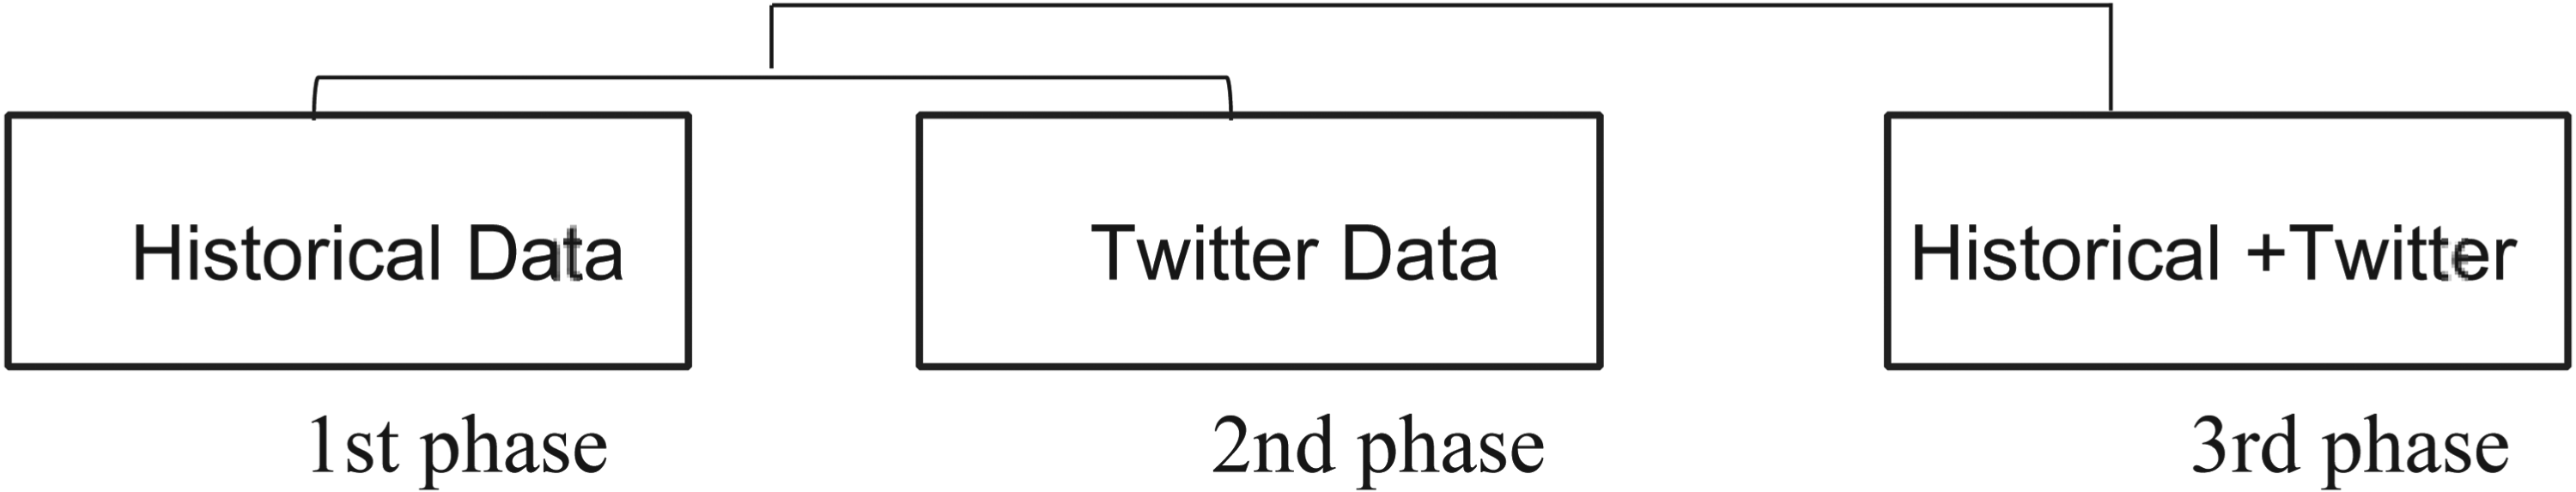
Three phases of the research design.
Each of these phases primarily consisted of the steps outlined in Figure 2.
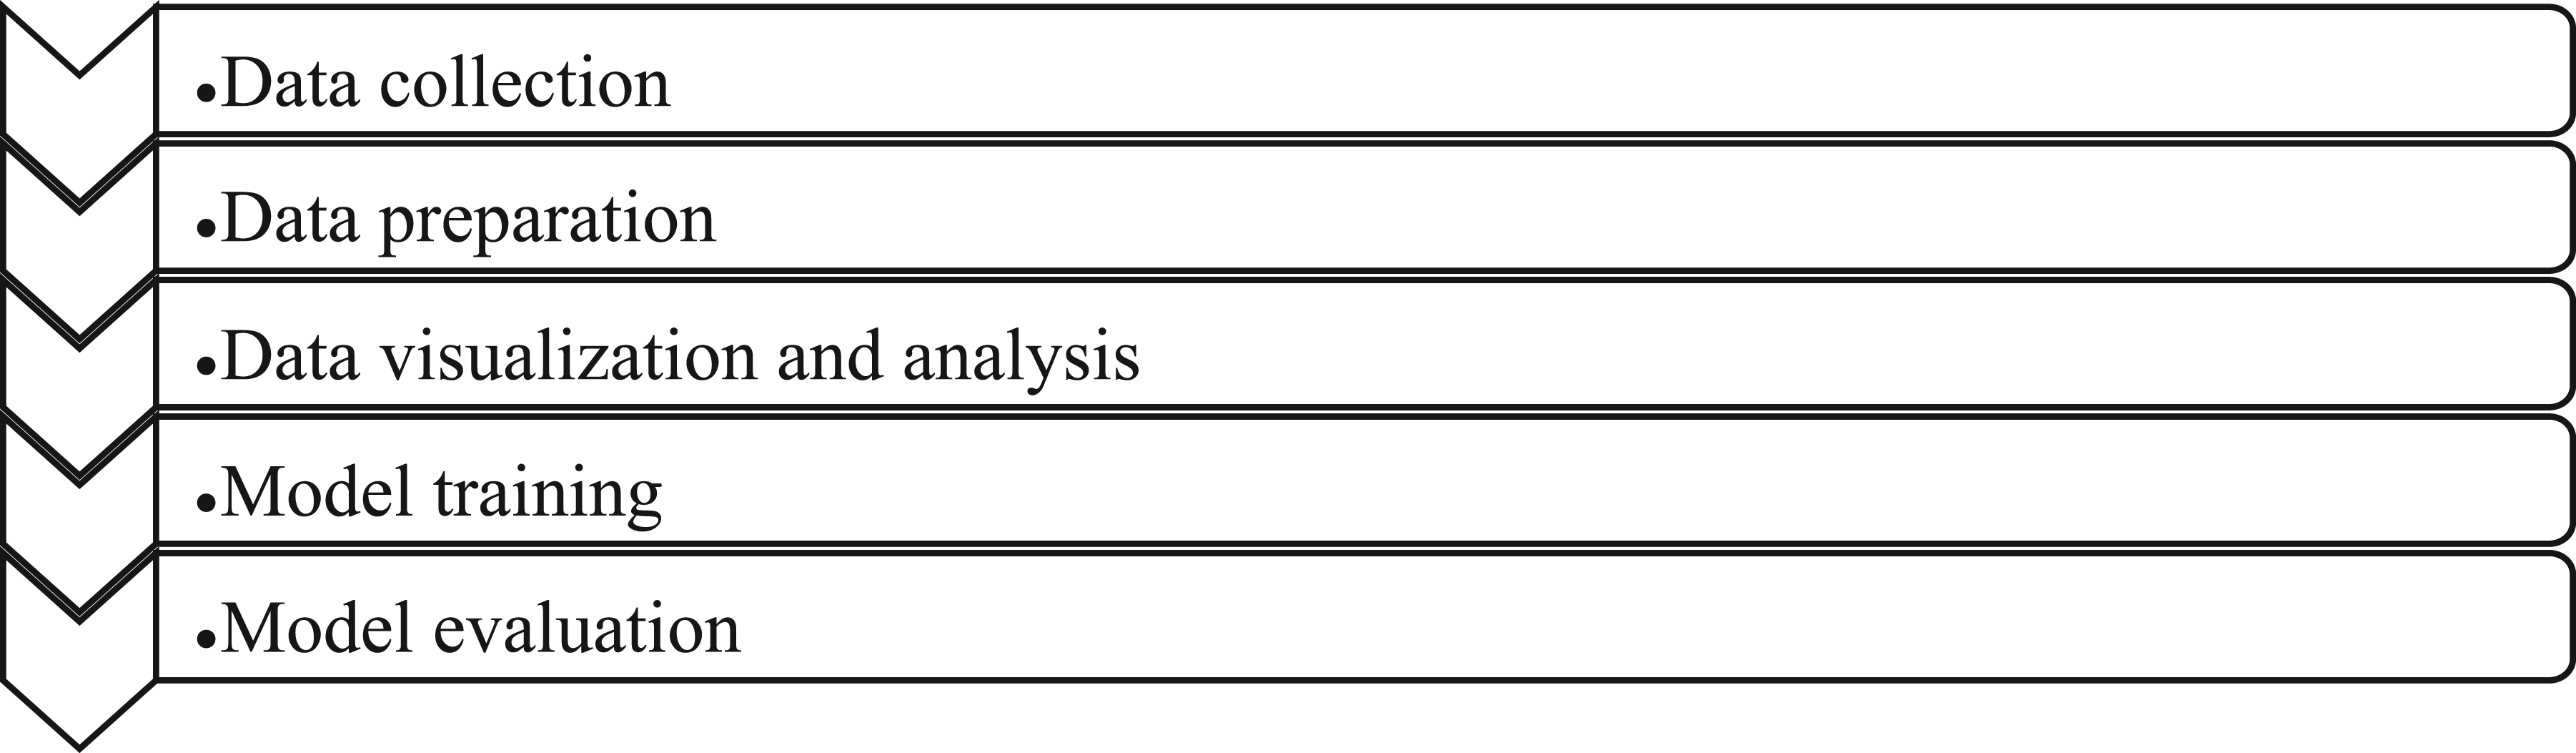
Steps in phases.
Data collection
The datasets were created by considering 519 matches played among the top 9 teams (as of October 14, 2022) from the 1st of January 2011 to the 14th of October 2022. The study only considered matches with a clear outcome (won or lost); tied matches, matches with no results, and abandoned matches were excluded. Afghanistan (10th team as of October 14, 2022) had only played 29 matches, which was a very low count compared to the other teams in the top 10. Therefore, only the top nine teams—India, England, the West Indies, Pakistan, Australia, Sri Lanka, South Africa, New Zealand, and Bangladesh—were taken into consideration for the study.
Historical dataset
The historical dataset consisted of 16 variables, as detailed in Table 1.
Variables in the historical dataset.
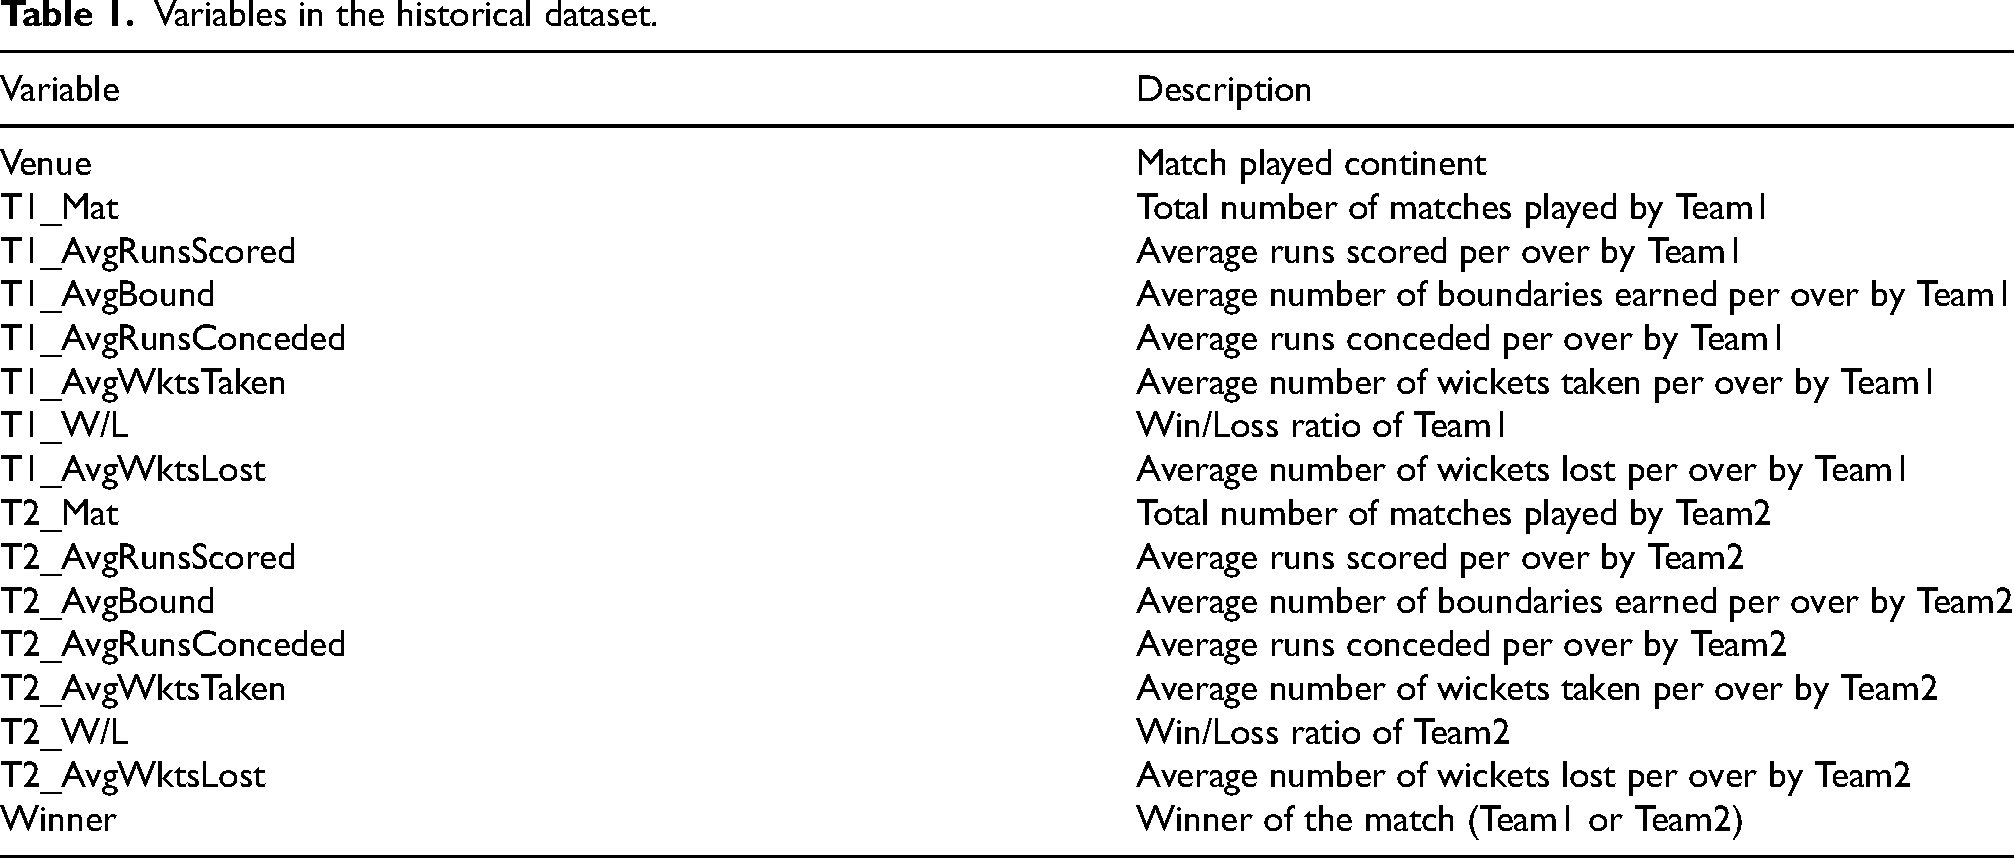
To create the above variables, a cricket statistics database accessible through ESPNCricinfo, Statsguru (Statsguru | Searchable Cricket Statistics database | ESPNcricinfo.com, 2000) was considered.
Each instance of the historical dataset represented a match, and the instance was mainly split into three parts: Team1 features, Team2 features, and the target variable. In addition, the dataset also contained the venue variable. This study was to predict the outcome of a match as a win for Team1 or a win for Team2. Most studies in this field consider the home team or the away team as either Team1 or Team2. However, this study was for international matches and contained data not only for the bilateral series. Therefore, Team1 is the team with the highest win/loss ratio for past matches. Team2 is the team with the lowest win/loss ratio.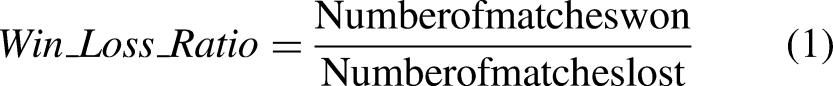
Twitter dataset
A Python library called Snscrape was used to scrape the tweets. The employed search query for scraping tweets had four main inputs: (1) Hashtags related to a particular match, (2) User handles related to a particular match, (3) Language of tweets, and (4) Dates and time range.
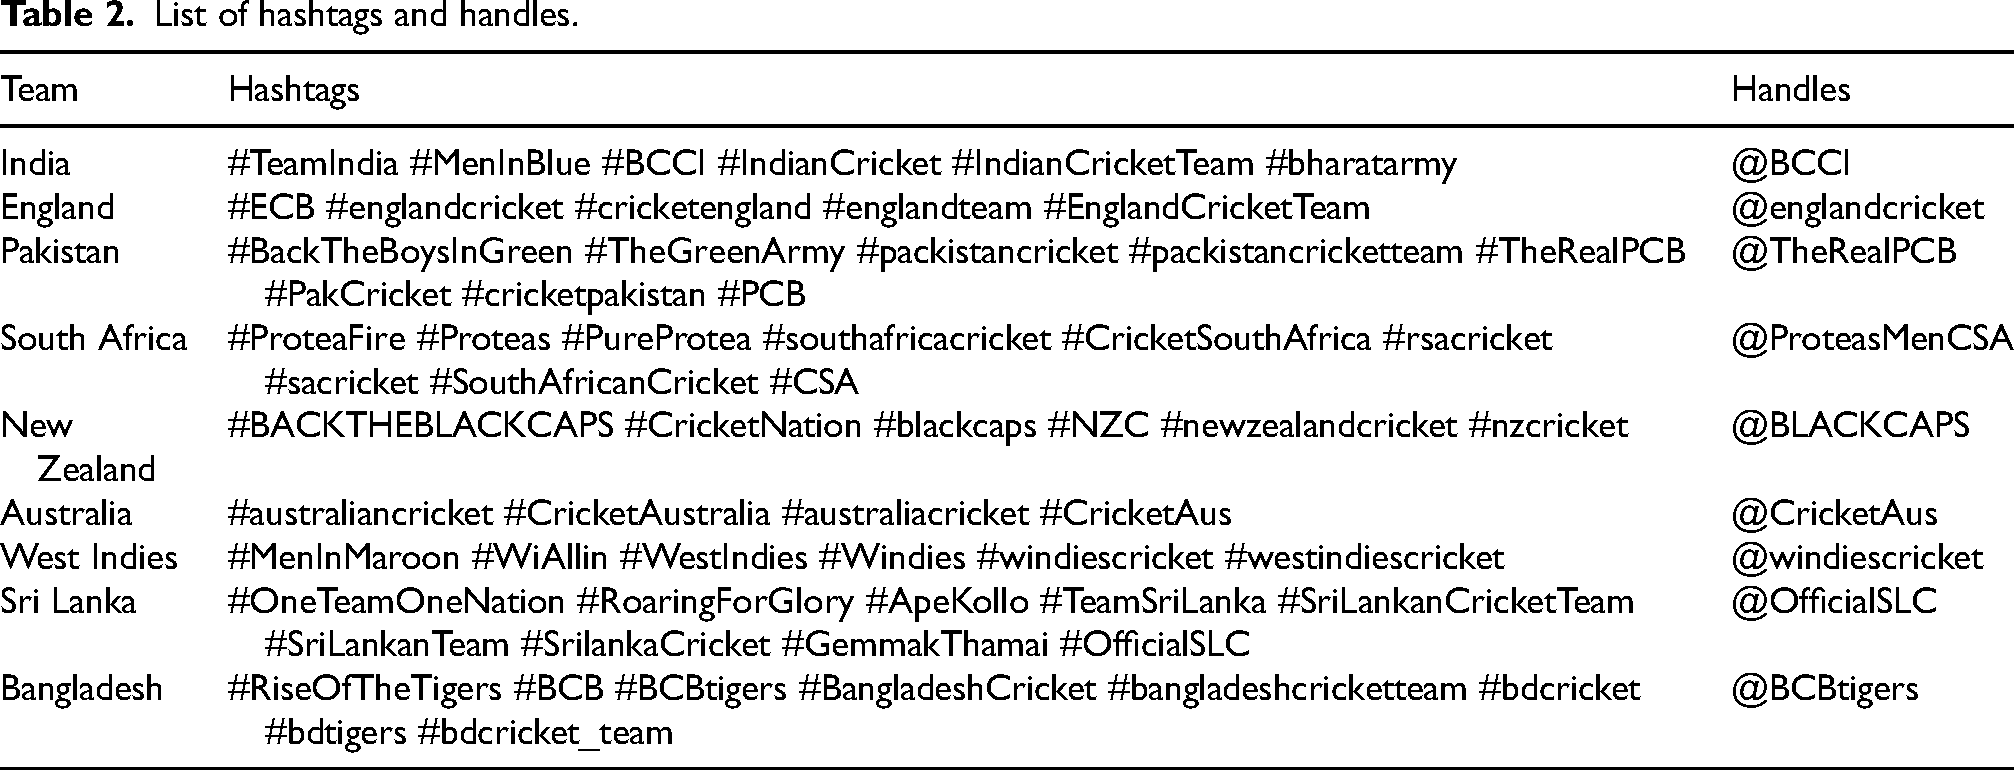
To fill in the first two inputs, a list of hashtags and user handles associated with each team, depending on familiarity, was manually created and verified using search queries on Twitter. The user handles were extracted from each team's official Twitter accounts (Table 2).
List of hashtags and handles.
When considering the third input of the search query, English was taken as the preferred language due to the limitations of other languages. The fourth input to the query was added to include that specific time range. For this study, tweets that were posted between 24 h and an hour prior to the match were considered. The starting time of each previous match was manually extracted using the archived schedule reports provided by Cricbuzz.
The scraped tweets were converted to lowercase and duplicates were removed. There is no benefit to this kind of task from tweets that raise a question. With the use of a regular expression pattern, a function was defined to recognize and remove tweets that raise a question.
<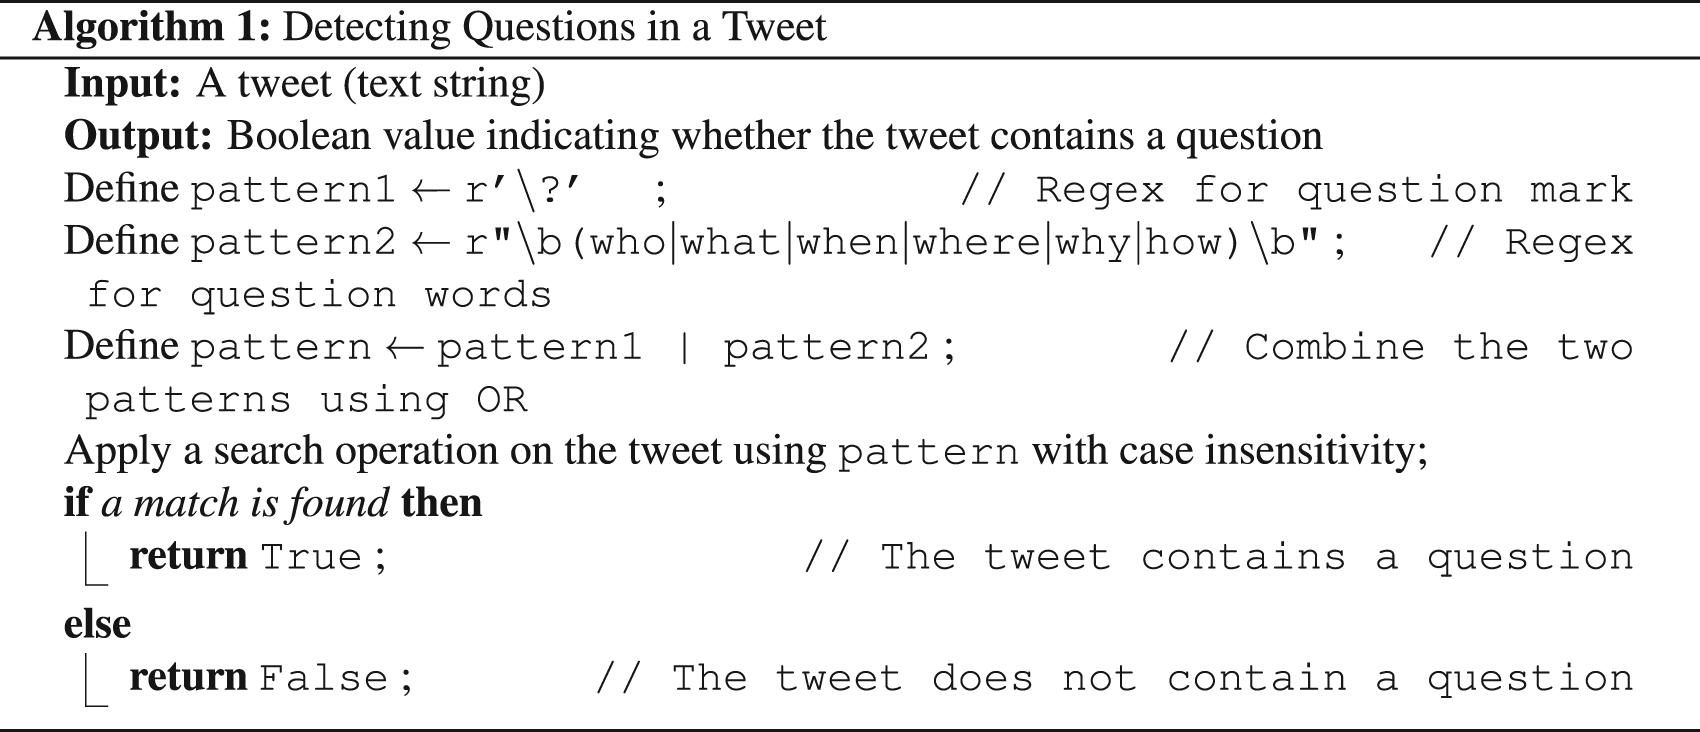 >
>
The dataset analysis also revealed that the majority of tweets contained several hashtags. Therefore, tweets with multiple hashtags and handles were classified according to the first hashtag or first handle.
<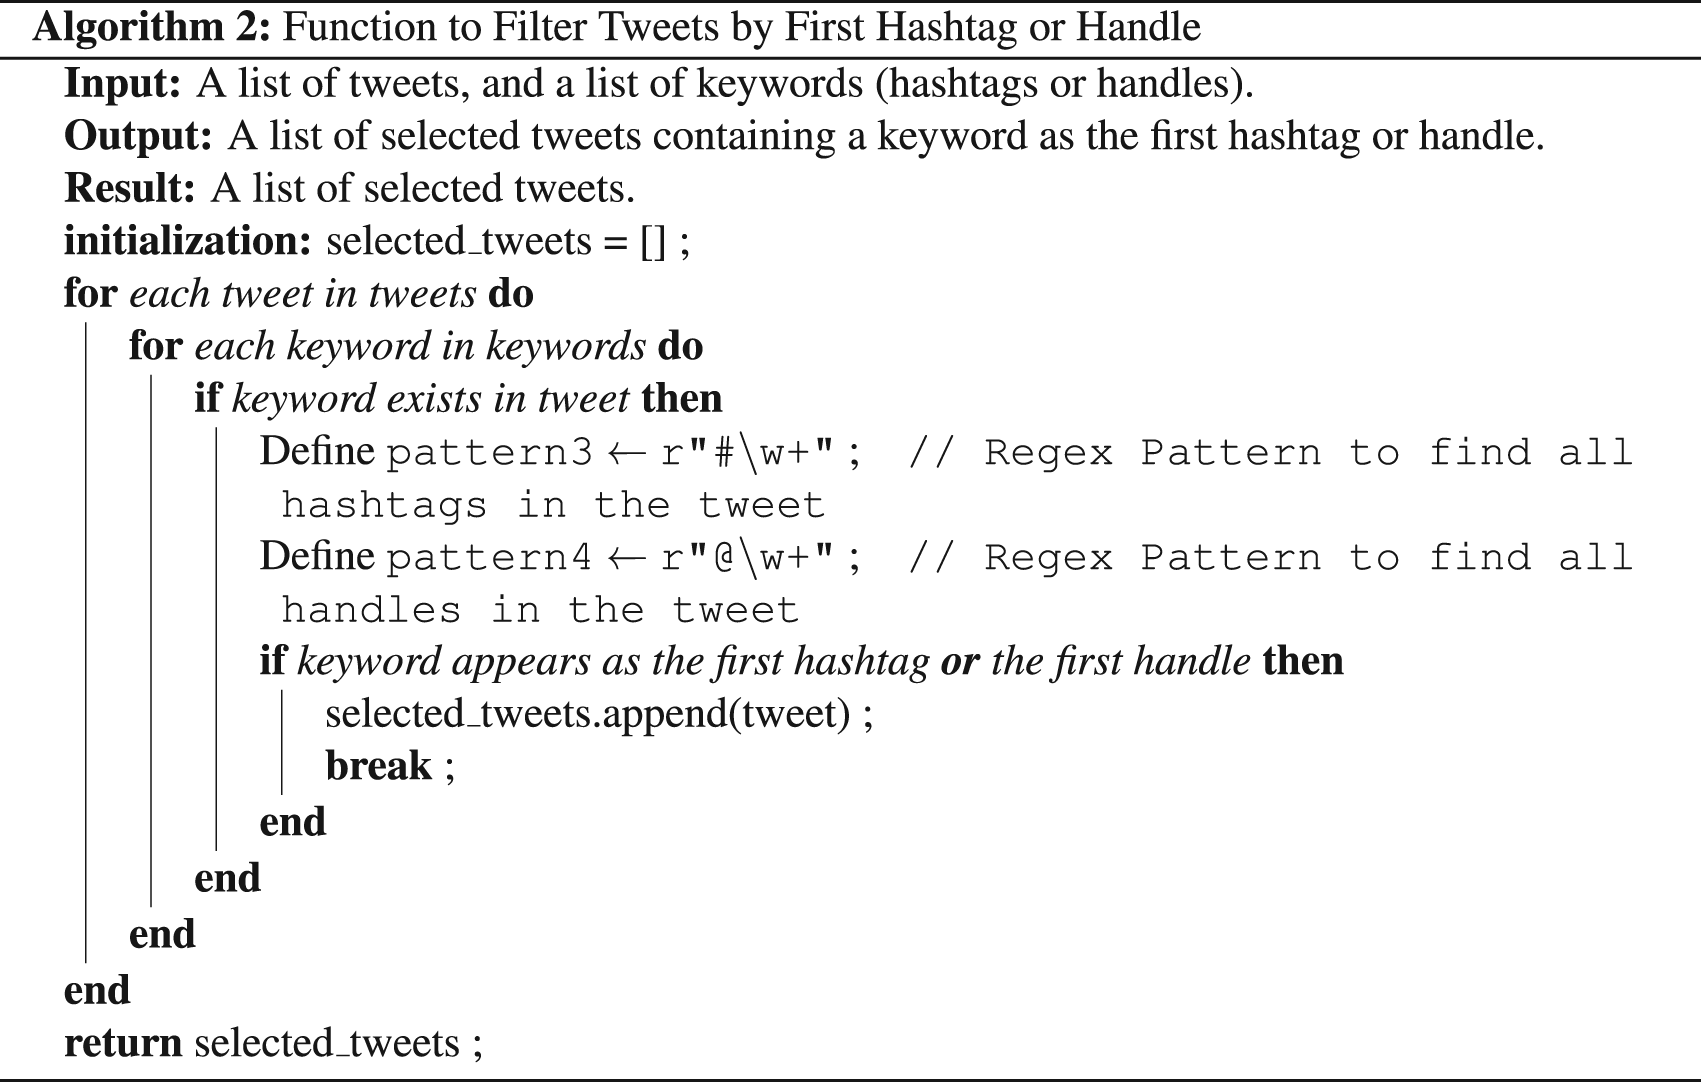 >
>
Like in the “Historical” dataset, in this dataset, a record was mainly split into three parts: Team1 features, Team2 features, and the target variable. Table 3 presents the variables included in the final "Twitter" dataset.
Variables in the twitter dataset.
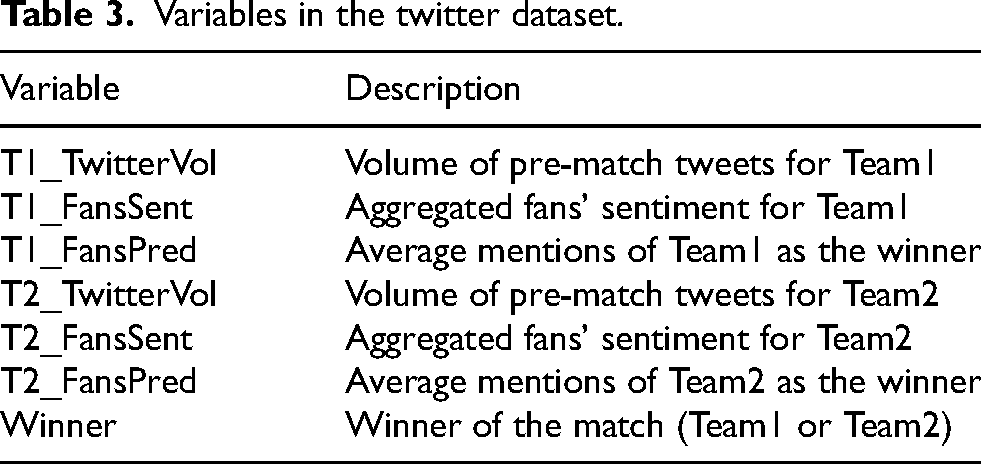
The volume of pre-match tweets and aggregated fans’ sentiment variables for each team were calculated based on the study of Ul Mustafa et al. (2017).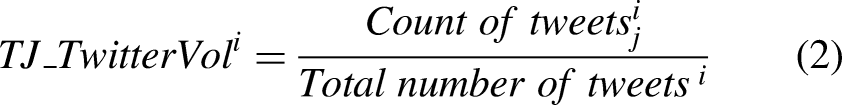
The variable 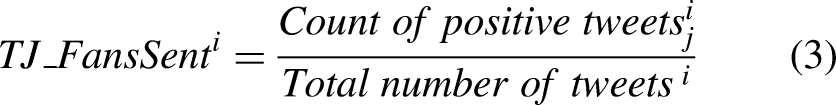
This variable indicates the sentiment score of Team j for
A sentiment analysis was carried out to create the two variables T1_FansSent and T2_FansSent.
The fans’ prediction variable (average mentions as the winner) for each team was newly introduced in the study. While analyzing the scraped tweets, it was noticed that fans primarily use two patterns (“Team j win” or “Team j will win”) to express their predictions. The variable was calculated by dividing the number of tweets containing the selected patterns for Team j (“Team j win” or “Team j will win”) in the 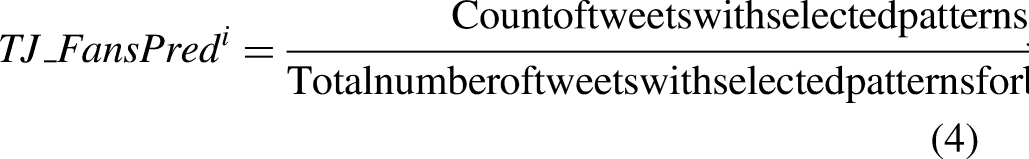
The “Historical + Twitter” dataset was created by combining the above two datasets (Table 4).
Overview of datasets.
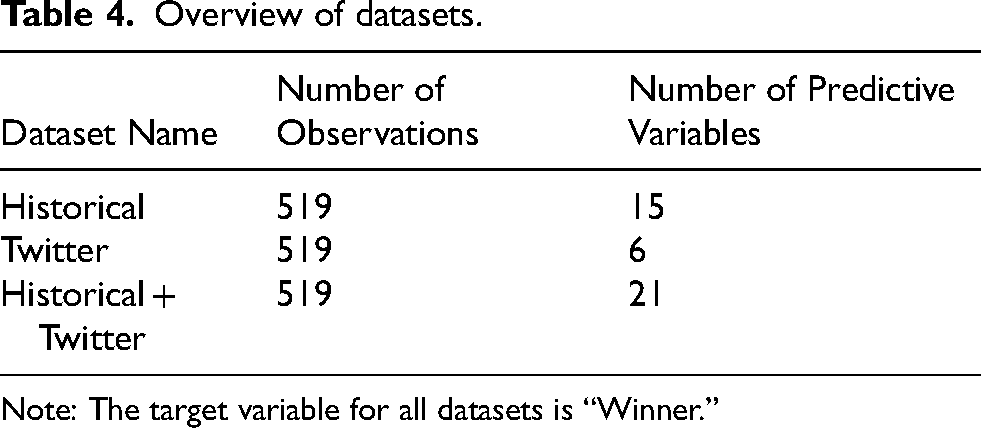
Note: The target variable for all datasets is “Winner.”
Dataset summary
Sentiment analysis
Due to a lack of resources and time constraints, only 3000 tweets were randomly selected from the collection, and those tweets were labeled to perform and evaluate the sentiment analysis. For this job, three annotators were employed, and final labels were assigned based on the majority vote. The objective of following such a procedure was to reduce subjectivity and human bias to some extent. Labeled tweets were then split into three sets called training (70%), validation (15%), and testing (15%). When carrying out the sentiment analysis, a RoBERTa-based model was mainly considered, and its performance was compared with VADER and LSTM.
The whole study was conducted using the Python programming language, with the majority of the code written and executed in Jupyter notebooks within the Anaconda environment (conda version 22.11.1). Google Colab with GPU acceleration was used to guarantee effective processing for more computationally demanding operations, such as training the RoBERTa model.
RoBERTa-based model
“Twitter-roberta-base-sentiment-latest (https://huggingface.co/cardiffnlp/twitter-roberta-base-sentiment-latest)” was chosen as the appropriate RoBERTa model from the hugging face model hub for this analysis. It is based on RoBERTa (Robustly Optimized BERT Pretraining Approach), proposed by Liu et al. (2019), which is a variation of BERT (Bidirectional Encoder Representations from Transformers). BERT, a pre-trained transformer model introduced by Devlin et al. (2018), can be used to perform sentiment analysis on a new dataset using transfer learning. There are so many improvements in the RoBERTa models compared to the BERT. Employing more training data, eliminating next-predict loss, and expanding the batch size are some of them (Zhao et al., 2021). Under the preprocessing step, a tokenizer called “AutoTokenizer” was used for the padding and truncating. After fine-tuning this selected model on the dataset, the fine-tuned model was uploaded to the hub (Hugging Face, 2022) for later usage. This model can be accessed by using this link: https://huggingface.co/sppm/cric-tweets-sentiment-analysis/.
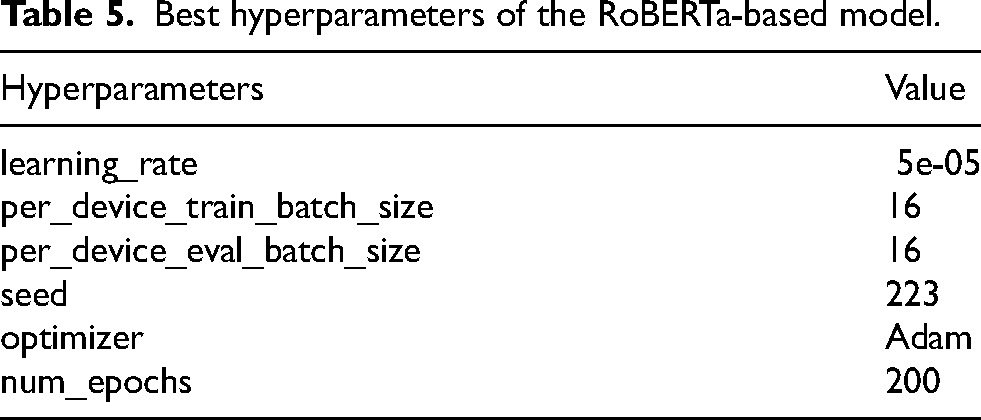
The hyperparameters used for model training are listed in Table 5.
Best hyperparameters of the RoBERTa-based model.
VADER
VADER (Valence Aware Dictionary and sEntiment Reasoner) is a rule-based sentiment analysis tool and is well suited for short and informal text data in social media, like tweets (Chiny et al., 2021). Based on its compound score, predictions were made in this study. When the score was greater than or equal to zero, tweets were labeled as positive; otherwise, they were labeled as negative. Lastly, the predictions were compared to the ground truth labels provided by annotators.
LSTM
LSTM (Long Short-Term Memory), an updated version of RNN, is widely utilized when building models from scratch for NLP applications like sentiment analysis, and it overcomes the vanishing gradient problem in RNN (Hochreiter and Schmidhuber, 1997). For this study, the training, validation, and test sets were cleaned using the “neattext” library for the task. WordNetLemmatizer was used for lemmatization, and NLTK's RegexpTokenizer was taken into consideration for tokenization. Only the words from the 400,000-word GloVe embedding list were retained after all of these steps. The 50-dimensional GloVe model was selected for the study. Simple data analysis was performed on the training set to identify the maximum number of tokens in a tweet, and that value was 50. The length of each tweet was equalized by taking that value into account. If a tweet didn’t have the defined number of tokens, that was padded with zeros. Then the architecture of the LSTM model was defined, and the model was trained on the training set using suitable hyperparameters.
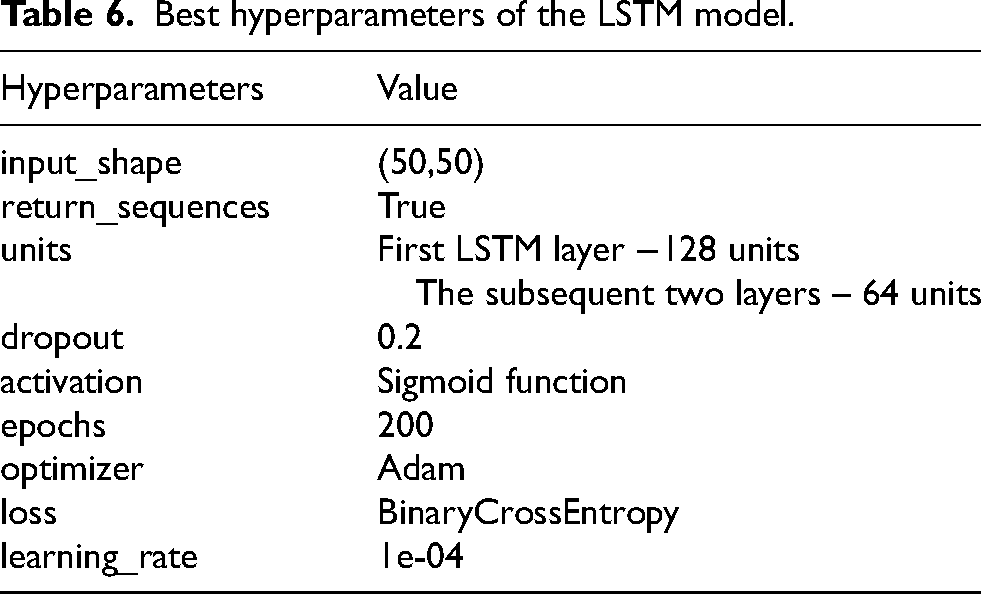
The hyperparameters and their corresponding values are presented in Table 6.
Best hyperparameters of the LSTM model.
An immediate evaluation was done on the validation set, and the final performances were calculated on the test set.
The optimal technique for sentiment analysis was then found by comparing the test-set metrics of these three models, and the scores were as given in Table 7.
Final results comparison of sentiment analysis.
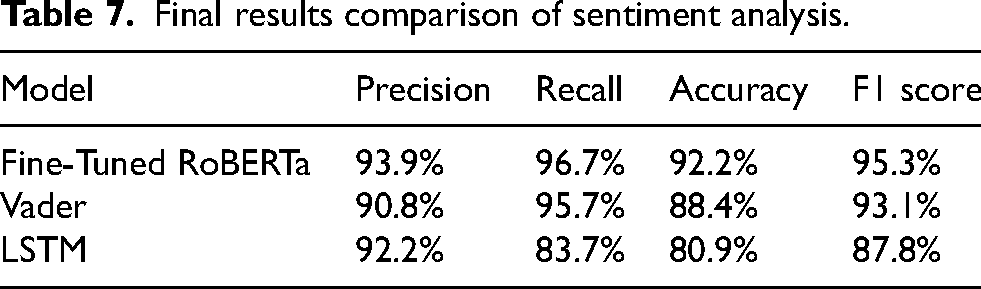
The fine-tuned RoBERTa model worked better than the other two models. The class-wise F1 scores of this model were 95.3% for the positive class and 76.8% for the negative class, respectively.
The RoBERTa model was trained on Google Colab using an NVIDIA Tesla T4 GPU and its free-tier resources. It took 244.82 s (around 4 min) to complete.
Finally, the RoBERTa model was applied to determine the sentiment of the entire collection of tweets. Then, the values for the T1_FansSent and T2_FansSent variables were calculated by dividing the count of positive tweets of each team for a particular match by the total number of tweets posted for that specific match.
Data analysis
When considering the number of matches won, more than half of the matches (58.55%) were won by Team1. Therefore, the dataset was imbalanced. The correlation-association plot, shown in Appendix A, suggested that multicollinearity exists in all three datasets. Factor analysis groups highly correlated variables together into factors in order to reveal the underlying concept of a set of variables (Gie Yong and Pearce, 2013). Therefore, factor analysis was carried out to identify the highly correlated variables group-wise and to provide a solution for the multicollinearity. For that, both Bartlett's test and the KMO test should be satisfied. If the p-value in Bartlett's test is less than a specified significant level (e.g., less than 0.05), the correlation matrix is not an identity matrix, and factor analysis can be performed. The KMO Test evaluates if the sample size is adequate for factor analysis. Usually, if KMO is greater than 0.6, it is considered adequate (Sharma, 1995). The Bartlett's p-values for both the Historical and Historical + Twitter datasets were zero, and the overall KMO for the Historical and Historical + Twitter datasets were 0.68 and 0.73, respectively. However, the overall KMO value for the Twitter dataset was 0.54. These values indicated that the Historical and Historical + Twitter datasets were appropriate for factor analysis, but the Twitter dataset was not. Therefore, factor analysis was not performed for the Twitter dataset.
Model building
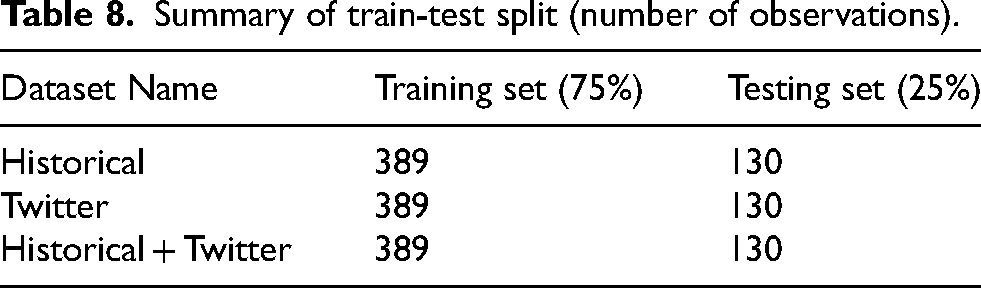
Categorical variables were encoded using one-hot encoding, and all the variables were standardized using StandardScalar(). Since the dataset was imbalanced, SMOTE was applied to each dataset. After that, each dataset was split into training (75%) and testing (25%) (Table 8).
Summary of train-test split (number of observations).
Prediction models were developed under three steps:
● Step 1: Models were trained with all variables available. ● Step 2: Models were built after removing unimportant variables. ● Step 3: The most important variables from every factor were chosen, and models were created.
After Step 1, the feature importance plot for the best-performing model was generated. In Step 2, models were built by removing the three least important variables, the two least important variables, and the least important variable sequentially according to that feature importance plot. In Step 3, the two most important variables from each factor were selected based on the importance plot of the best model in Step 2. Then various possible combinations of those variables were taken into consideration, and the combination of variables that gave the best results was identified. This process was carried out for all three datasets.
For Random Forest and XGBoost models, feature importance plots were generated based on the Mean Decrease in Impurity (MDI). For Support Vector Machine models, feature importance plots were created using the absolute values of the coefficients. The feature importance plots for the best models at each step for each dataset are provided in Appendix B.
Results
Performance of the final models
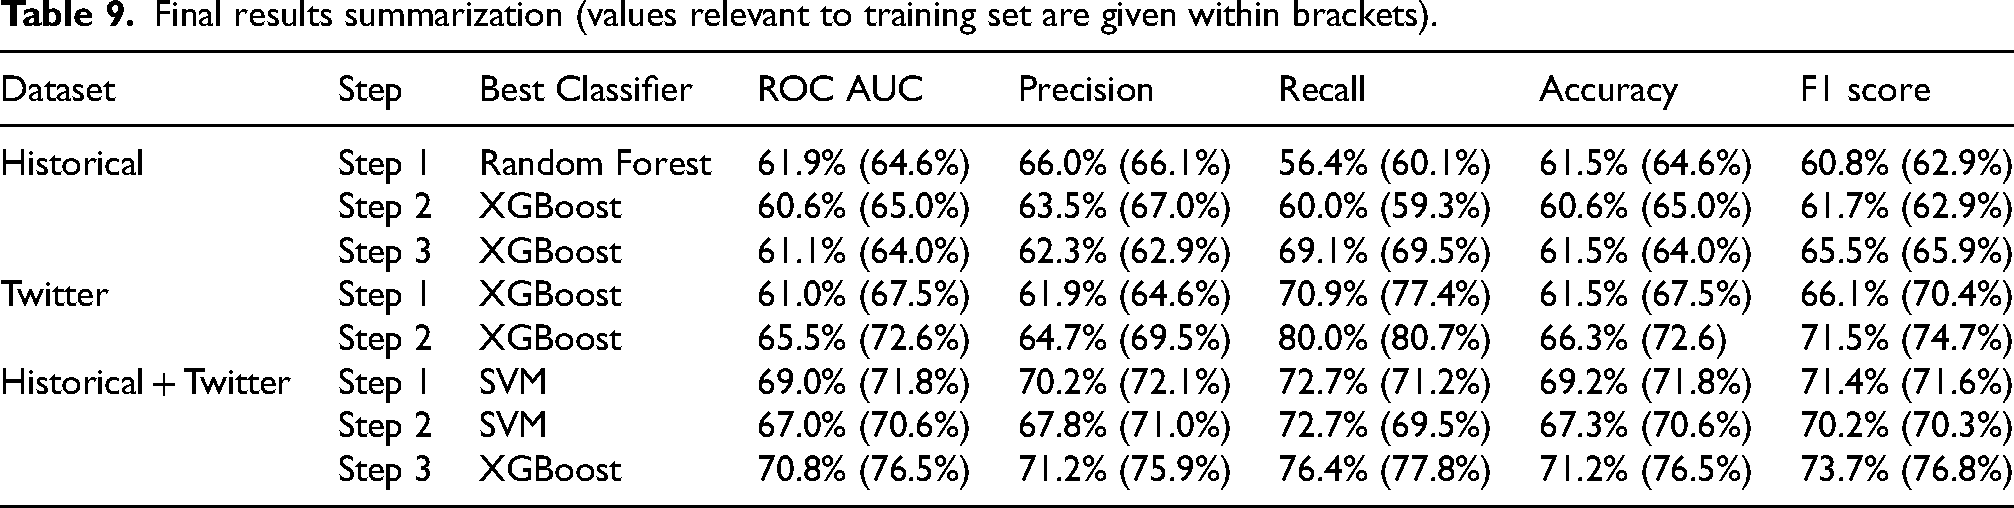
The final findings of the three datasets are provided in Table 9.
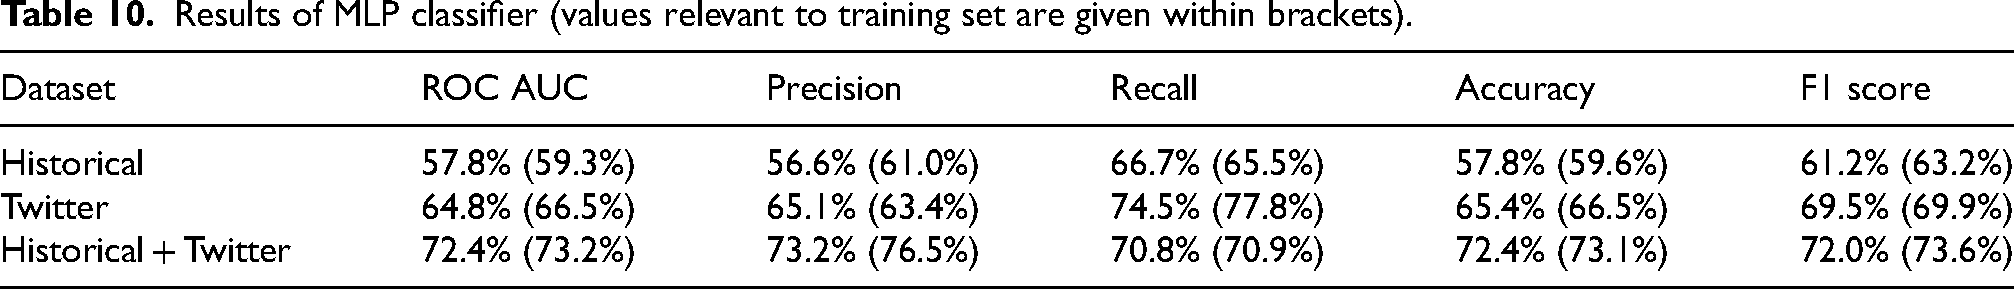
In addition, a Multi-Layer Perceptron (MLP) classifier was trained on each dataset with the most important variables to determine whether or not the results could be further improved, but there was no improvement. The results are presented in Table 10.
By looking at both tables, it can be noticed that models built using the Historical + Twitter dataset gave the best results compared to the other two. The best results for the Historical and Historical + Twitter datasets were given by Step 3 (Table 9), while for the Twitter dataset, the best result was given by Step 2 (Table 9). It is important to note that when comparing the models, the F1 score was primarily taken into account due to the imbalance in the dataset. The Twitter data model performed better than the Historical data model with a F1 score of 71.5%, and the Historical + Twitter data model surpassed both the Historical data model and the Twitter data model with a F1 score of 73.7% (Table 9).
Final results summarization (values relevant to training set are given within brackets).
Results of MLP classifier (values relevant to training set are given within brackets).
T1_FansSent, T2_FansSent, T2_AvgBound, T2_W/L, T1_AvgBound, T1_Mat, and T2_AvgRunsConceded variables were the input variables for the best Historical + Twitter model.
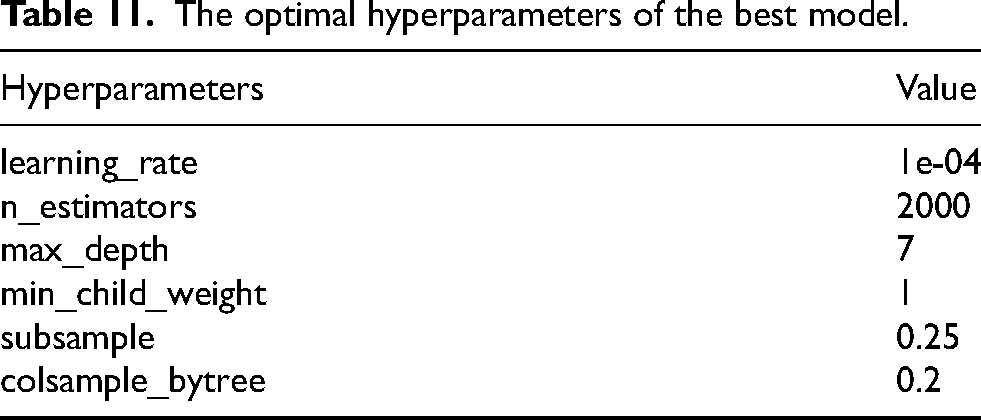
The best model was trained based on the optimal hyperparameters given in Table 11, obtained through GridSearchCV.
The optimal hyperparameters of the best model.
Moreover, the feature importance plot for this best model indicated that the newly created two features using sentiment analysis are the most important variables.
The marginal impact of one or two variables on the outcomes predicted by the machine learning model can be displayed by presenting partial dependence plots (PDPs/PD plots) (Friedman, 2001). Selected partial dependence plots for certain variables are shown in Figure 3.
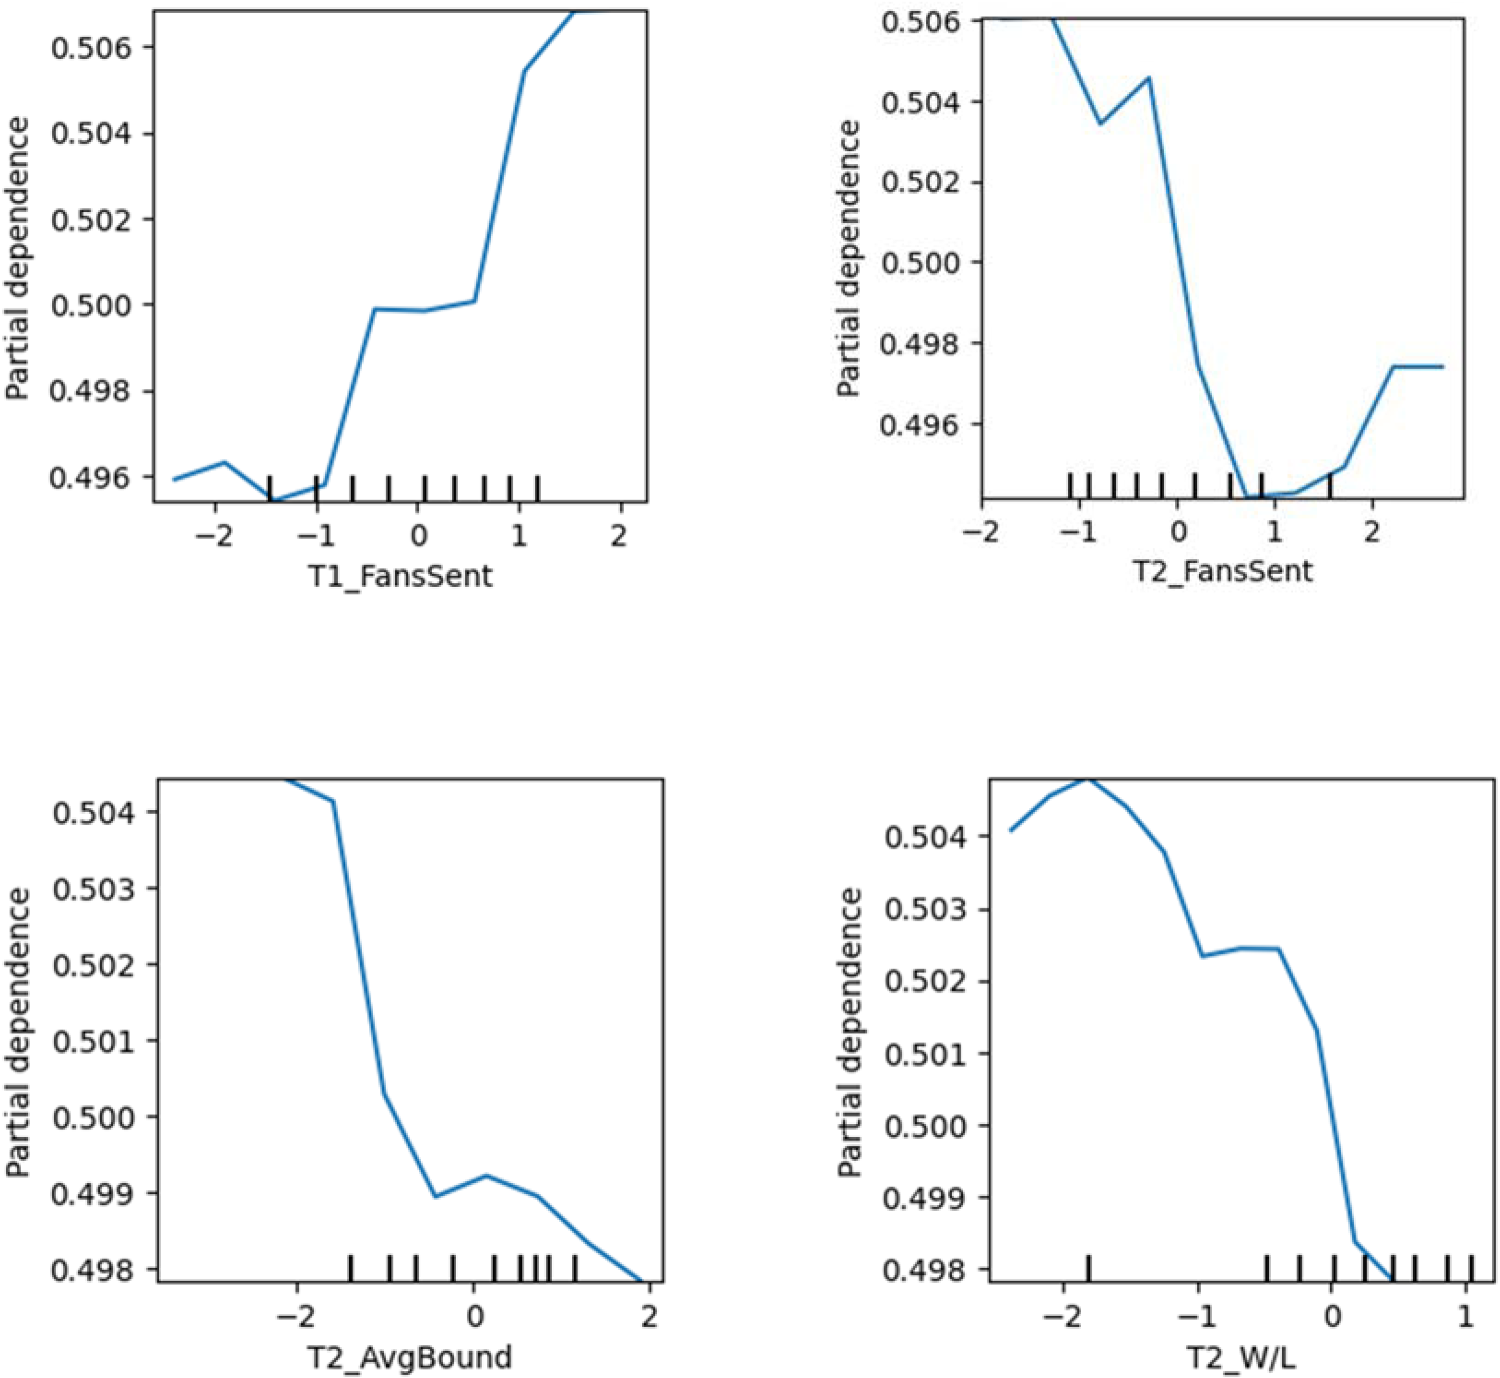
Partial dependency plots.
Note that the X-axis of these graphs shows the standardized values.
According to the partial dependency plot of the T1_FansSent, when Team1 has higher values for their sentiment score, they have a high chance of being the winner. The second partial dependency plot, which is for the Team2 fans’ sentiment score, shows that, up to nearly 0.9, if the T2_FansSent value increases, then the winning chance of Team1 decreases. But after that, it begins to increase. When looking at the reason for this, it was noted that it was due to a lack of data. Therefore, it can be concluded that overall, when the T2_FansSent increases, the probability of Team1 winning decreases. When considering the historical variables, there seems to be a negative association between T2_AvgBound and the winning probability of Team1. Another negative association exists between T2_W/L and Team1's winning chance. If Team2 had a higher win-loss ratio and took more boundaries per over, then Team1 would have a lower chance of winning.
Check the effectiveness of the proposed methodology
To check the effectiveness of the proposed methodology, predictions from the best model for the T20 World Cup 2022 matches were compared with the bookmakers’ pre-match predictions for those matches. On a daily basis, one hour before the start of each T20 World Cup 2022 match, the pre-match betting odds were manually gathered from oddsportal.com (https://www.oddsportal.com/). Just 14 of the matches contested among the top nine teams had a clear winner. Out of those 14 matches, only nine were successfully predicted by bookmakers, but 11 matches were correctly predicted by the best model proposed in this study. However, rather than the number of matches that were accurately predicted, bookmakers make their predictions based on the odds (Ul Mustafa et al., 2017). Therefore, evaluating the two approaches by comparing the profit/loss amounts is better. Suppose $1 was bet for each match; that means for all 14 matches, a total of $14 was placed for betting. Based on the bookmakers’ predictions, only a total payout of $12.13 could have been obtained, so the bettor has to face a loss. However, a total payout of $16.96 (a profit of $2.96) could have been earned by following this proposed methodology. This implies that the model proposed by this study follows a different prediction approach than that of the bookmakers.
Discussion and conclusion
Discussion
Wickramasinghe and Yapa (2018) achieved 85% accuracy in sentiment analysis for cricket tweets, while our fine-tuned RoBERTa model achieved 92.2% accuracy and a high F1 score of 95.3%, making it a better model for sentiment detection in cricket tweets. In contrast to their research, our model pre-trained on a sizable tweet set to precisely identify tweet sentiment. That might be the reason for the improved performance.
The primary goal of this study was to use historical and Twitter data to predict the outcome of T20I matches before they began. The summary of the study's final findings for those predicting best models is displayed in Table 12.
Predictive model comparison using F1 scores.
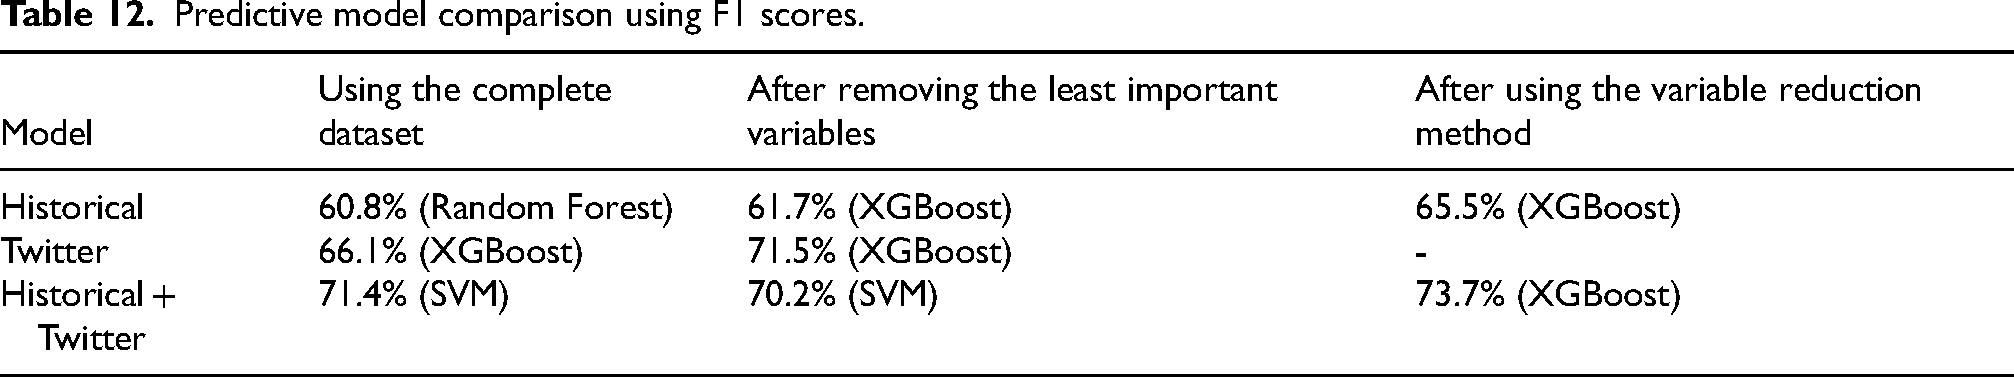
According to the author's knowledge, no study up to now has built a model to predict the T20I match outcome before it starts by integrating both Historical and Twitter data. The proposed best model in this study achieved ROC AUC, precision, recall, accuracy, and F1 score values of 70.8%, 71.2%, 76.4%, 71.2%, and 73.7%, respectively, for the Historial + Twitter model by surpassing both individual data models.
Limitations
The study used ESPNcricinfo Statsguru's vast collection of historical data (Statsguru | Searchable Cricket Statistics database | ESPNcricinfo.com, 2000), but it was challenging to gather every data point. Only batting, bowling, and team statistics tables were scraped, and features were chosen based on previous works. Due to time and cost limitations, only 3000 tweets were used for training and evaluating sentiment analysis models. The study was limited to a short time period due to unavailability and shortage of tweets.
Future work
Future research could involve adding more features to the historical dataset, labeling more tweets for sentiment analysis, and adding new features to the Twitter dataset, considering metrics like retweet count and likes. Creating a web or mobile application for the prediction model would be beneficial, and a prediction model that uses historical and Twitter data might be used for various cricket formats and sports.
Conclusion
This study aimed to predict match outcomes for the T20I matches. The combined model outperformed each model, with the Twitter model performing better than the historical model. The models used data collected one hour before the match, allowing them to predict match outcomes even before the toss. This can be really helpful for team management when deciding their final squad. The transfer learning-RoBERTa-based model surpassed VADER and LSTM + GloVe for sentiment analysis. The final prediction performance improved when the two datasets were combined. The fans’ sentiment score variables for the two teams were the most important variables in the best model, indicating that Twitter data provides information that historical data does not. The best model was applied to the data from the T20 World Cup 2022. It was found that this model could outperform bookmakers’ forecasts and generate profits.
Footnotes
Author contributions
Pavanthi Sudasinghe performed data collection, developed the models, carried out coding and analyses, and wrote the manuscript. Supervisors, Sameera Viswakula and Pemantha Lakraj, provided guidance throughout the project, including conceptual design, methodology, and critical revisions of the manuscript.
Funding
The authors received no financial support for the research, authorship, and/or publication of this article.
Declaration of Conflicting Interests
The authors declared no potential conflicts of interest with respect to the research, authorship, and/or publication of this article.