
Abstract
In this paper, we analyze seasonal transactions between Major League Baseball teams over the years 1922–2021. Our approach is to create a weighted network for each season: each team is a node and the link weight between two teams corresponds to their seasonal transaction frequency. Furthermore, we classify teams (nodes) into three different binary groupings to study the amount of inter- and intra-group transactions. We first group teams according to National or American League membership to consider the historical changes in inter-league transactions. Second, we group teams according to winning record and observe a consistent aversion to transactions between winning teams. Finally, we group teams according to payroll size and observe that transactions between/among higher and lower payroll teams all occur close to expected levels. This network theory approach of measuring inter- and intra-group links relative to expected levels is broadly known as dyadicity. Dyadicity has been well studied for unweighted networks, however, our analysis requires a weighted analogue which we develop and apply. To our knowledge, this is the first definition and use of weighted dyadicity.
Introduction
Player transactions in major league baseball
Over the past 100 years Major League Baseball (MLB) has evolved dramatically while retaining its essential character. Significant changes include the development of farm systems, integration, the draft, free-agency, the creation of divisions and introduction of playoffs, the introduction of inter-league play, and league expansions. But the motivation to win has remained constant and any team’s success inherently depends on the players that fill its roster. Thus, player transactions, specifically player trades and purchases, are a significant focus of any MLB front office. In this paper, we analyze MLB player transactions over the 1922–2021 seasons in order to assess how certain factors relate to transactional behavior. Moreover, we aim to consider observed transactional behavior in the bigger context of MLB history, strategy, and economics.
Our approach is based in network theory but only requires basic concepts of networks. In particular, we build a transaction network for each season where nodes are teams and the link weight between any two teams depends on the number and type of transactions between the teams. Then placing teams (nodes) into groups, we consider intra- and inter-group transactions relative to what would be expected from a random network comparable in node and link size. We do this for three separate groupings in order to study how the group membership affects transactional behavior within baseball. First, we group teams according to American or National League membership in order to study historical trends in inter- and intra-league transactions. The 1922–1960 time period shows lower than expected inter-league transactions. But we also observe a consistent increase in inter-league transactions over that same time period. Next, we group teams as either competitive or non-competitive in terms of being reasonably positioned to be in post-season contention. Through this we observe that inter-competitive team transactions consistently occur at lower than expected levels, indicating that there is a strategic aversion for competitive teams to transact with each other. Last, for the seasons 1988–2021, we group teams as either a higher or lower payroll team. Through this, we observe inter- and intra-group transactions all occurring at expected levels, suggesting that another team’s payroll is not a significant factor when considering possible transaction partners.
Related research
This paper relates to existing work in two distinct disciplines: baseball analytics and network theory. In the domain of baseball analytics, this is not the first paper to consider influences on MLB transactions, although, to our knowledge, it is the first to consider transactional relationships through network theory and is the most historically expansive. Horowitz (1993) considered only intra-league transactions during the different tenures of team management over the years 1903–1959. He used chi-squared tests for independence to determine when and with whom transactions occurred at greater than expected levels. Significant relationships were examined historically for personal connections between those in influential roles with the teams in question.
Additionally, Hersch and Pelkowski (2014) created multi-variable negative binomial regression models to explore the effects of many different social, structural, and financial factors on player transaction frequencies between MLB teams over the years 1985–2011. The primary emphasis of their work was the influence of social factors on transactions. Examples include whether general managers worked together in the past, which teams managers had worked for in the past, and family ties between managers. Pertinent to our work, they also considered the influence of league membership, win differential (the absolute difference in winning records of two teams), and payroll differential (the absolute difference in team payrolls). Their models predict that playing in the same league and a larger win differential both increase transactions. No effect was seen from payroll differential, which agrees with our analysis. Their finding on win differential agrees with our computations in Figure 1, although our observed increase in inter-group transactions (relative to the competitiveness grouping) is so slight we do not mention it outside of referencing this previous finding. Their findings on league membership would agree with our pre-1960’s observations (Section “League-based dyadicity analysis”). However, we see a more complicated picture over the 1985–2011 period of their analysis. Over this shorter time span, we see slightly higher than expected intra-league transactions in the National League (which agrees with their models) and slightly lower than expected intra-league transactions in the American League (which disagrees with their models) for most years. Since we do not lump the two intra-league transactions into a single summary statistic, a more direct comparison is not possible. Also, our models differ slightly from theirs as we weigh multi-team transactions differently.
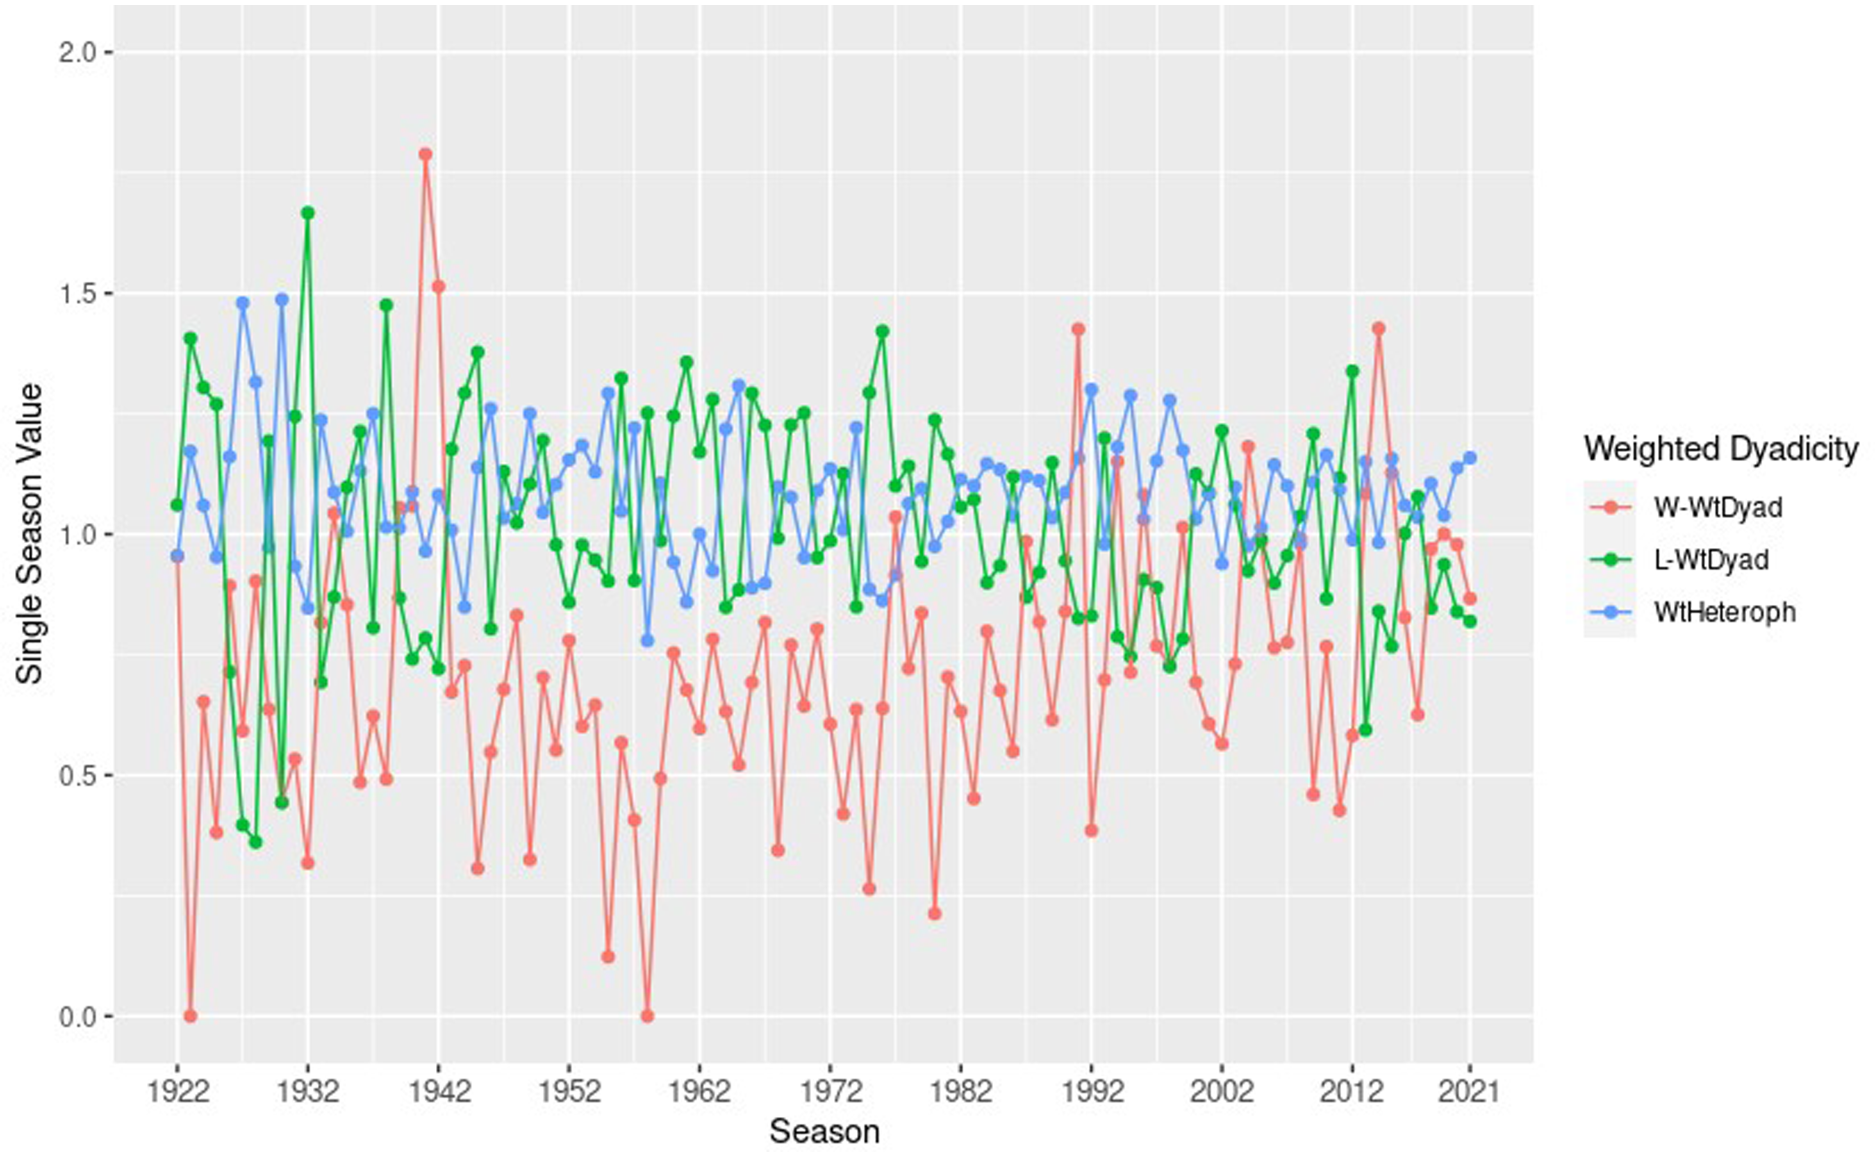
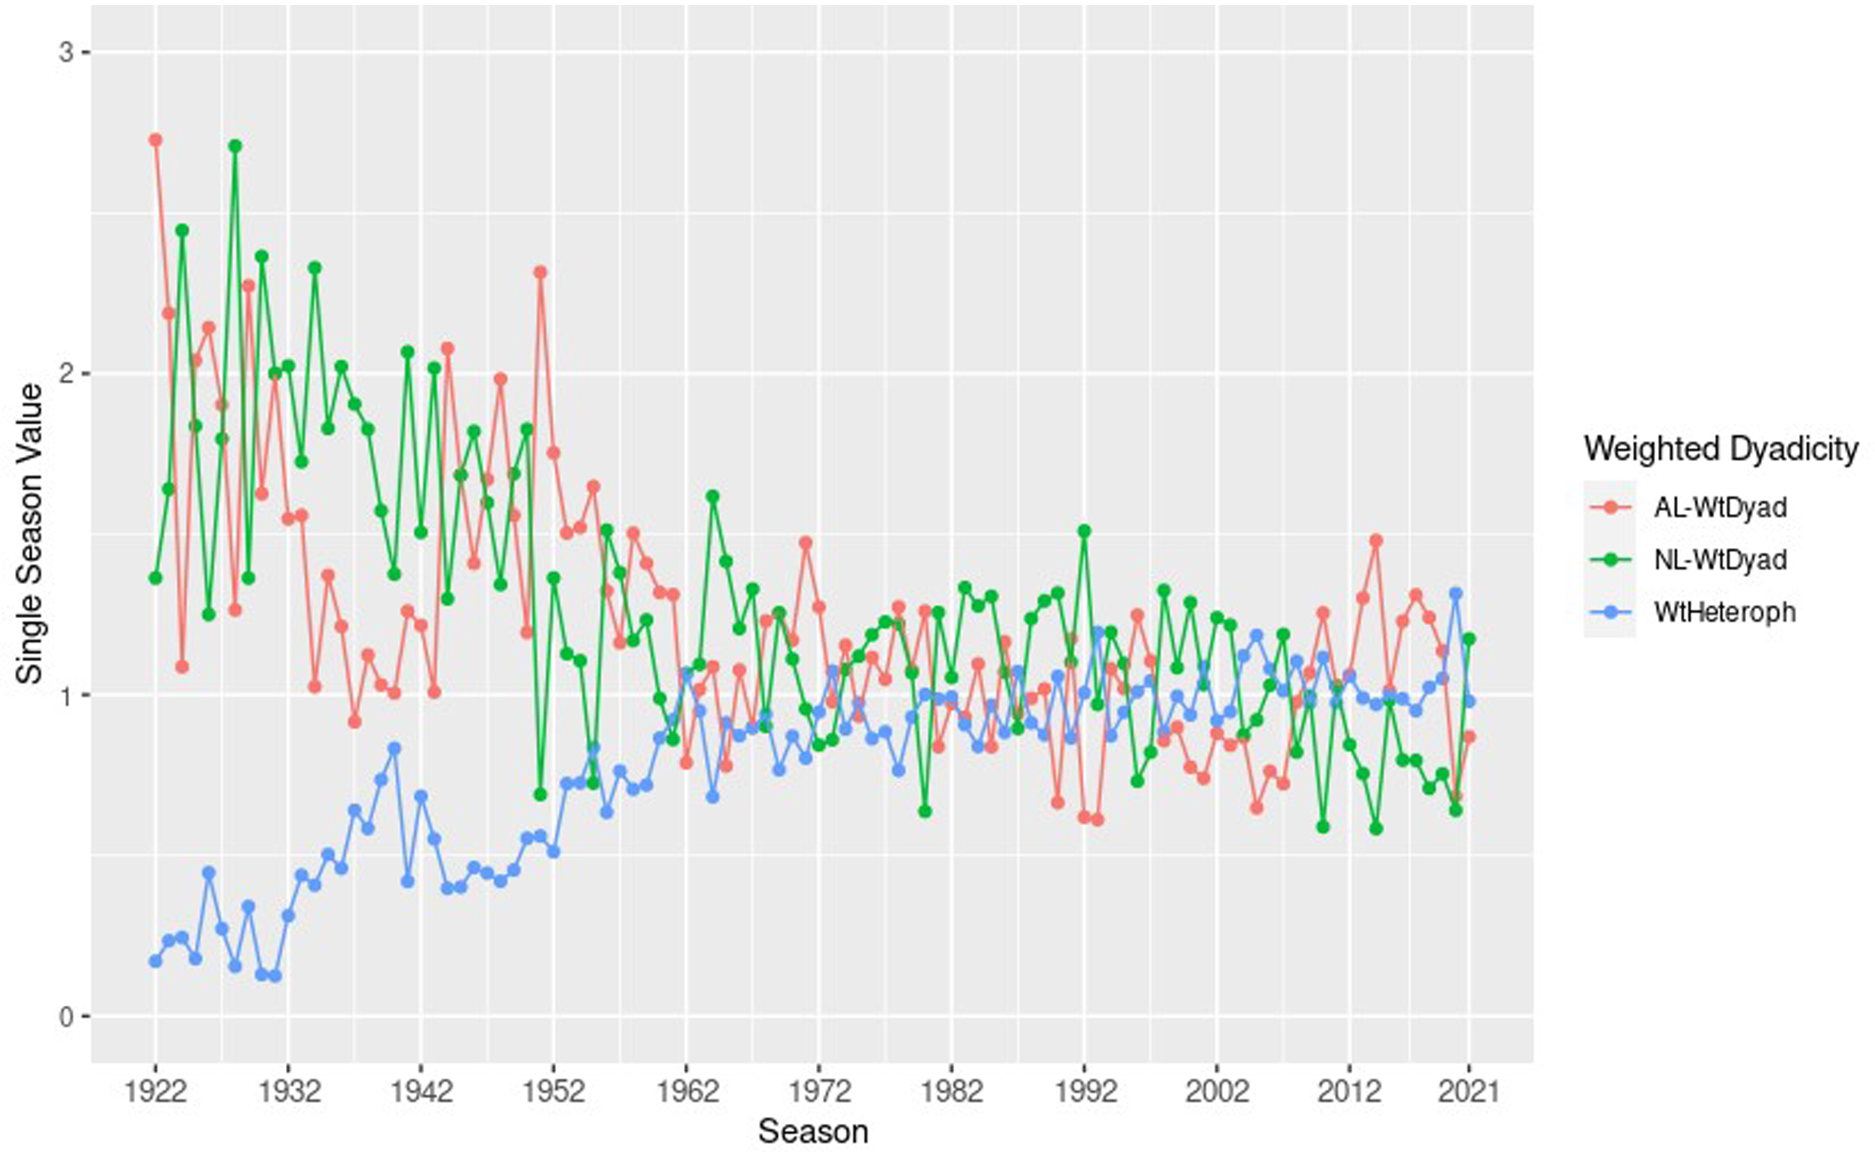
This shows competitiveness-based weighted dyadicity values by season, as discussed in Section “Competitiveness-based dyadicity analysis”. W-dyadicity is given in orange, L-dyadicity is given in green, and W/L-heterophilicity is given in blue. Lines connecting annual values are not for interpolation.
The work presented here also pertains to significant contributions in network theory. Most generally, one might consider our transaction networks similar to collaboration networks with an added dose of competition (Basole, 2016; Grossman, 2002; Newman, 2001). More specifically, the approach we use of comparing intra-group links with the links of a comparable random network is called dyadicity, with the comparable notion for inter-group links termed heterophilicity. These ideas were presented in Park and Barabási (2007) for unweighted networks, studied further in Cinelli et al. (2017) and Hu et al. (2015), and can be thought of as extensions of homophily in social networks (McPherson et al., 2001). Since our transaction networks are weighted, we must extend their definitions to weighted networks. To our knowledge, this paper is the first extension of dyadicity to weighted networks.
This paper proceeds as follows. In Section “Data sources, transaction networks, and team groupings” we explain our data, network constructions, and team groupings. In Section “A preliminary analysis” we take a first look at our transaction networks and motivate the need for weighted dyadicity. In Section “Weighted dyadicity” we present an intuitively based definition of weighted dyadicity, revisit the transaction networks from this perspective, and interpret our observations in terms of baseball history, strategy, and economics. In the Appendix (Section “Appendix: Development of weighted dyadicity”), we recall the dyadicity definitions of Park and Barabási (2007) for unweighted networks, give a theoretical justification of our extension to weighted networks, and present a short example calculation.
Network constructions and preliminary analysis
Data sources, transaction networks, and team groupings
The MLB player transaction data set was downloaded in its original form from Retrosheet (https://retrosheet.org/) and filtered down to the seasons 1922–2021. A transaction belongs to a particular season if it occurred between November 1 of the previous year and October 31 of the season’s year. We will use the term season to refer to this specific year long period. The original data set contains all player transactions between major league organizations, unaffiliated minor league teams, and international teams. Any transaction involving an affiliated minor league team is assigned to the affiliated major league organization. As a result, throughout this paper we use the term MLB team to refer to the entire parent organization. We reduced the data to transactions that could be considered a player-for-player trade, player purchase, or conditional trade between two or more MLB teams. Notably, this excludes draft and expansion draft acquisitions as well as free agent signings. This leaves a total of 21,318 transactions over the 100 year time frame. A small number of transactions were made by expansion teams before the first of November prior to the team’s first season. These transactions were excluded from volume and dyadicity measurements when the team could not be assigned group membership (e.g., winning percentage) for the season prior to the team’s first. We supplemented transaction data with seasonal winning records for seasons 1922–2021 and with team payrolls for seasons 1988–2021. MLB win record data was obtained from Baseball Reference (https://www.baseball-reference.com/) and was aligned with the transaction data. Team payroll data was provided by The Baseball Cube (http://www.thebaseballcube.com/) as a custom data request.
For each season, we compile a weighted adjacency matrix from the player transaction data as follows. Each node corresponds to an MLB team in existence and with at least one transaction during the season in question. Then the weight between team
The diagonal entries of every adjacency matrix are always zero as no team can trade with itself. Note that since we only include teams with transactions in a particular season, seasonal adjacency matrices are not guaranteed to have all MLB teams in existence. We base this decision on an assumption that any team who requires a player transaction will eventually find a suitable partner; a team without any transactions suggests a lack of need. Most seasons have all teams present in the network.
For each seasonal adjacency matrix, we group teams (nodes) according to three different criteria. First, we group teams according to league membership: National (NL) or American (AL) League. Second, we consider a team’s winning percentage for the season in question and and group the team as competitive (W) if its winning percentage is at least 52% and non-competitive (L) if not. The full regular season winning percentage is used and the 52% cutoff is intended as a surrogate for teams that are in possible playoff contention. While the 52% threshold will not perfectly align with the teams that actually make the playoffs during a given season, it is important to note that our goal is replicate the mindset of management while trades are being made; we want the teams that think they might make the playoffs, not necessarily the teams that actually make the playoffs. Finally, for the seasons 1988–2021, we consider whether a team’s total payroll exceeds the MLB median payroll for that specific season or not. The shortened time span is due to limited payroll data availability. We label teams which exceed the median as above median (A) and those who do not as below median (B), any team on the border is assigned group B. We also consider a small variant to the payroll analysis by increasing the criteria for group A membership to be in the upper quartile of seasonal payroll.
A preliminary analysis
In considering how league, competitiveness, and payroll influence whom teams trade with, a natural approach is to look at transaction volume between teams within and across the groupings. Given two groups of teams, we take seasonal inter-group volume to be the sum of weights of all inter-group links for that season. Similarly, for each group we take the seasonal intra-group volume to be the sum of weights of all intra-group links within the given group for that season. For example, during any particular season the inter-league volume would be the sum of weights of links between all pairings of one NL and one AL team. Similarly, there would be two intra-league volumes, one for the NL and one for the AL; each would be the sum of weights of links between all pairings of NL teams, or AL teams, respectively.
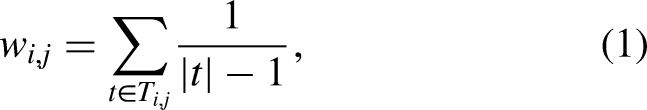
We consider volume by league-based grouping in Figure 2, volume by competitiveness-based grouping in Figure 3, and volume by payroll-based grouping in Figure 4. In all three, the total volumes are the same, the difference is how a season’s total volume is distributed between the two intra-group volumes and the one inter-group volume. From 1922 to 2021 there is a considerable increase in total volume. Significant and explainable dips occur during World War II (1941–1945) and the onset of COVID-19 (2020). Vertical dashed lines are placed in expansion years. Expansion years are theoretically significant when considering volume as expansion increases the number network nodes, which increases the number of possible links. In the context of baseball, having more teams implies more possible transactions. Other moments in MLB history which conceivably might influence total volume include the formalization of the farm system in 1931, the implementation of the draft in 1964, and the institution of free agency in 1975. Integration is another important change in MLB history beginning in 1945 with Jackie Robinson playing for the Dodgers, however the process took decades to unfold (Armour and Levitt, 2015). Consideration of these influences is beyond the scope of this paper.
For each season’s transaction network, this shows the total volume (purple), intra-AL volume (green), intra-NL volume (blue), and inter-AL/NL volume (orange). Vertical dotted lines are included for each expansion year. Lines connecting annual values are not for interpolation.
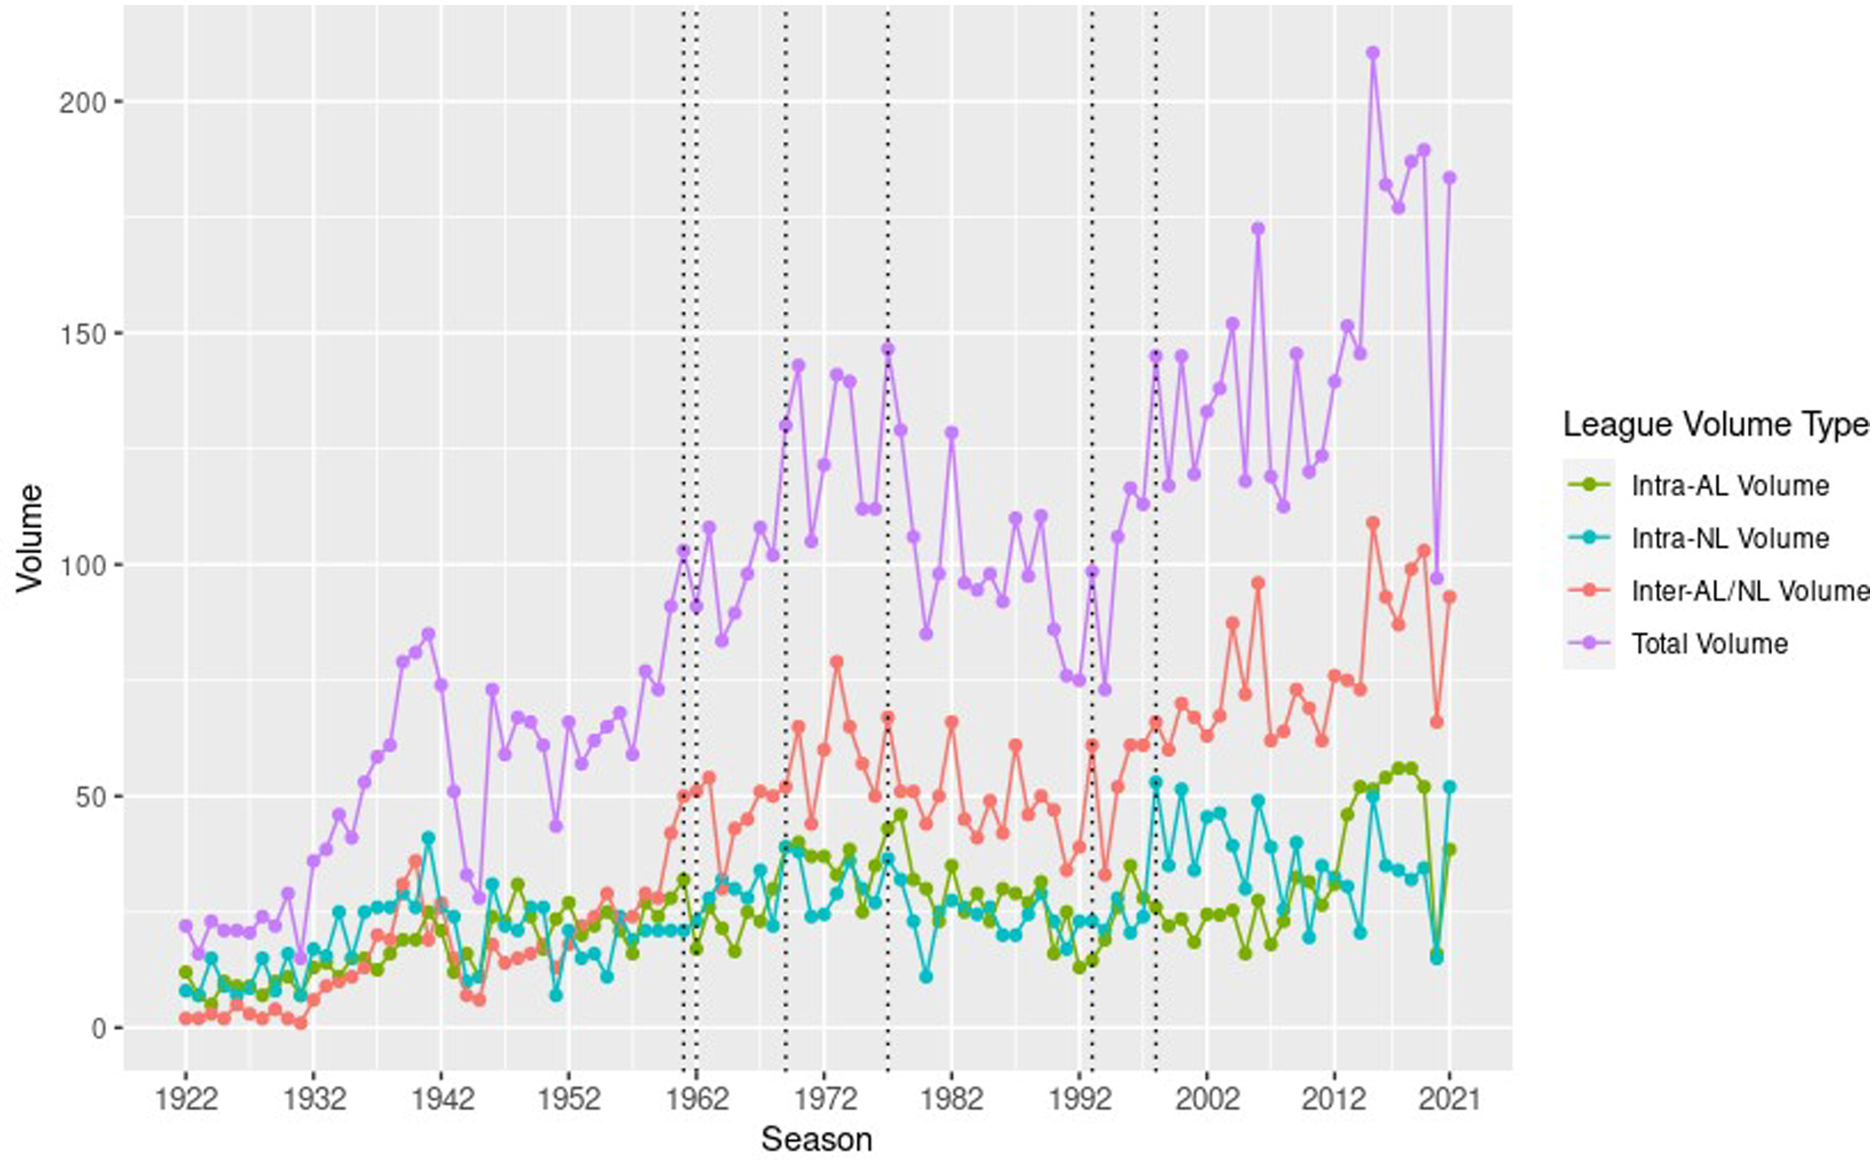
For each season’s transaction network, this shows the total volume (purple), intra-W volume (green), intra-L volume (blue), and inter-W/L volume (orange). Vertical dotted lines are included for each expansion year. Lines connecting annual values are not for interpolation.
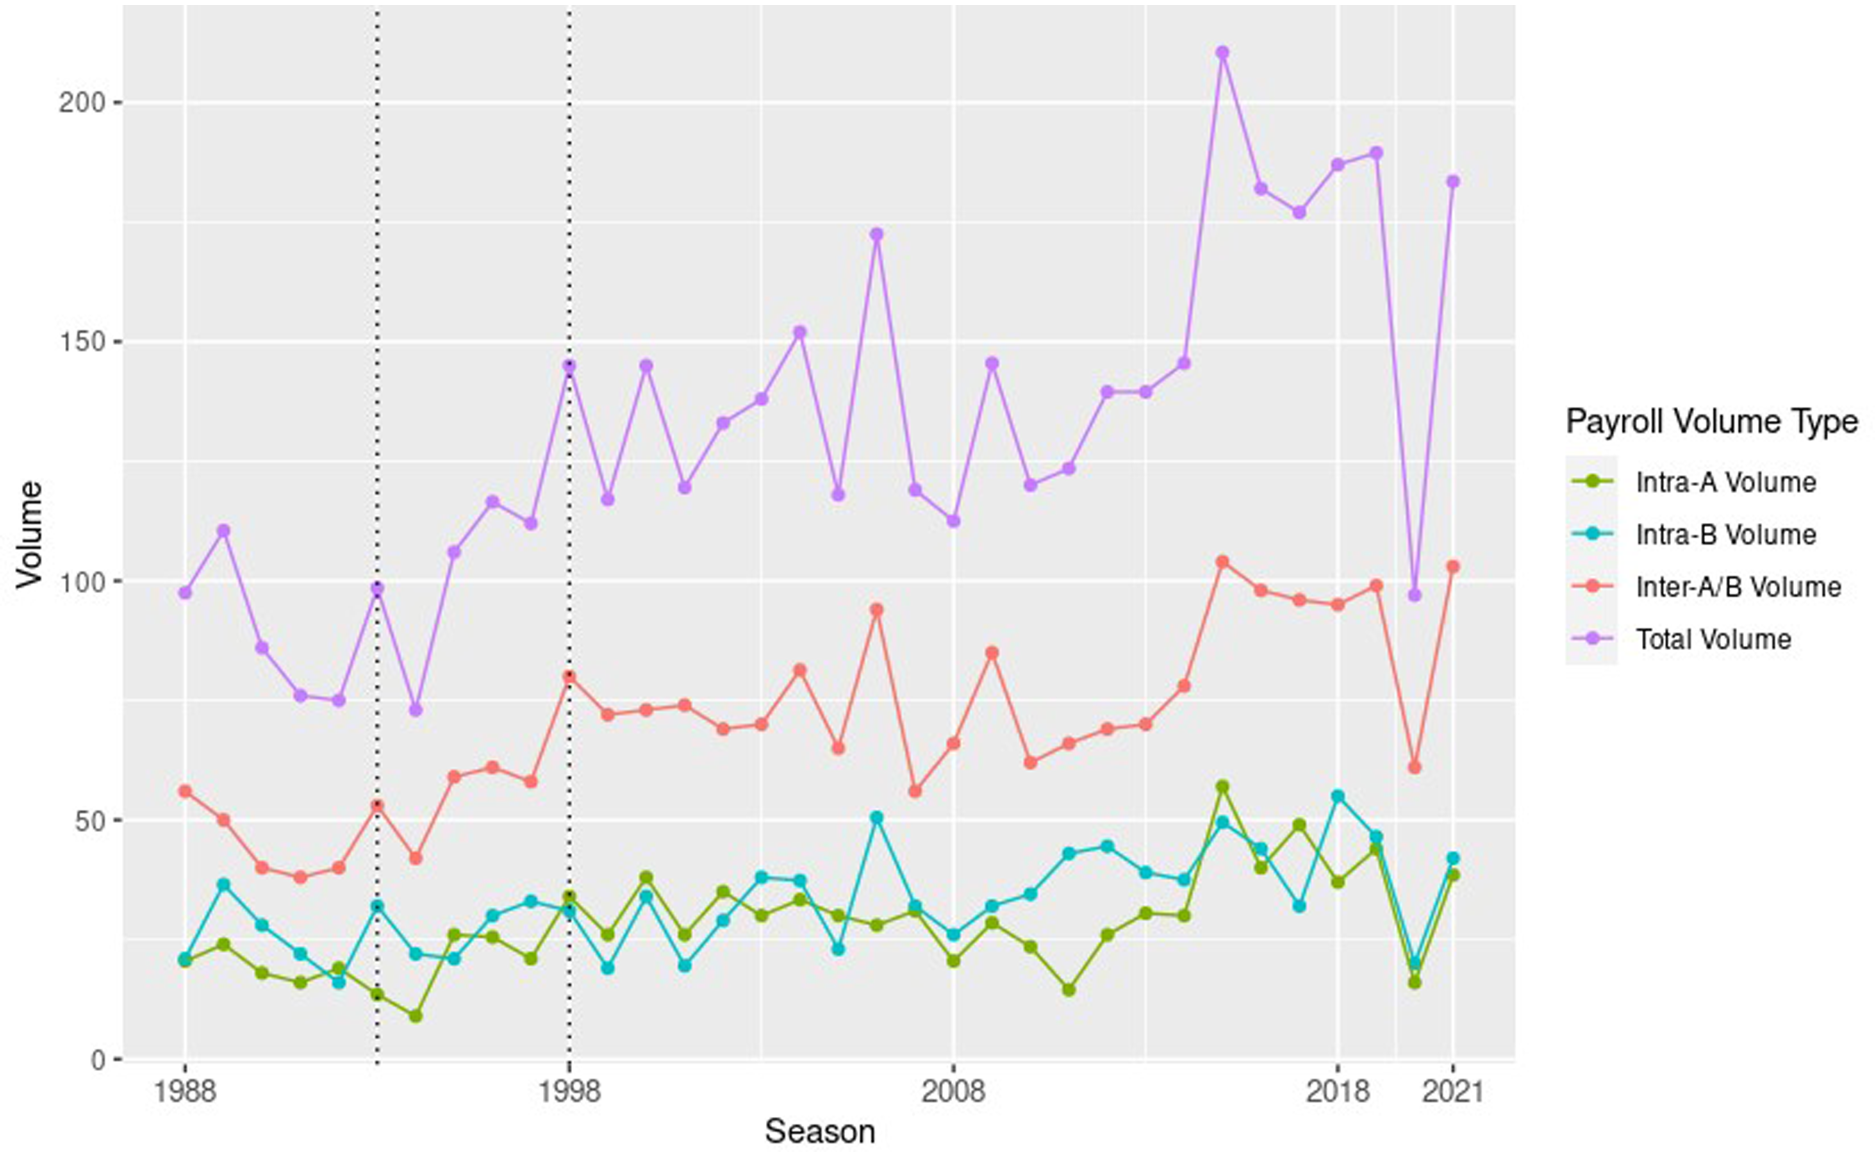
For each season’s transaction network, this shows the total volume (purple), intra-A volume (green), intra-B volume (blue), and inter-A/B volume (orange). Vertical dotted lines are included for the two expansion years over the shortened time span. Lines connecting annual values are not for interpolation.
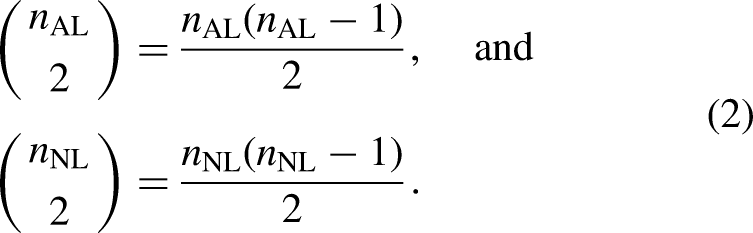
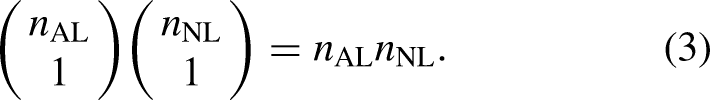
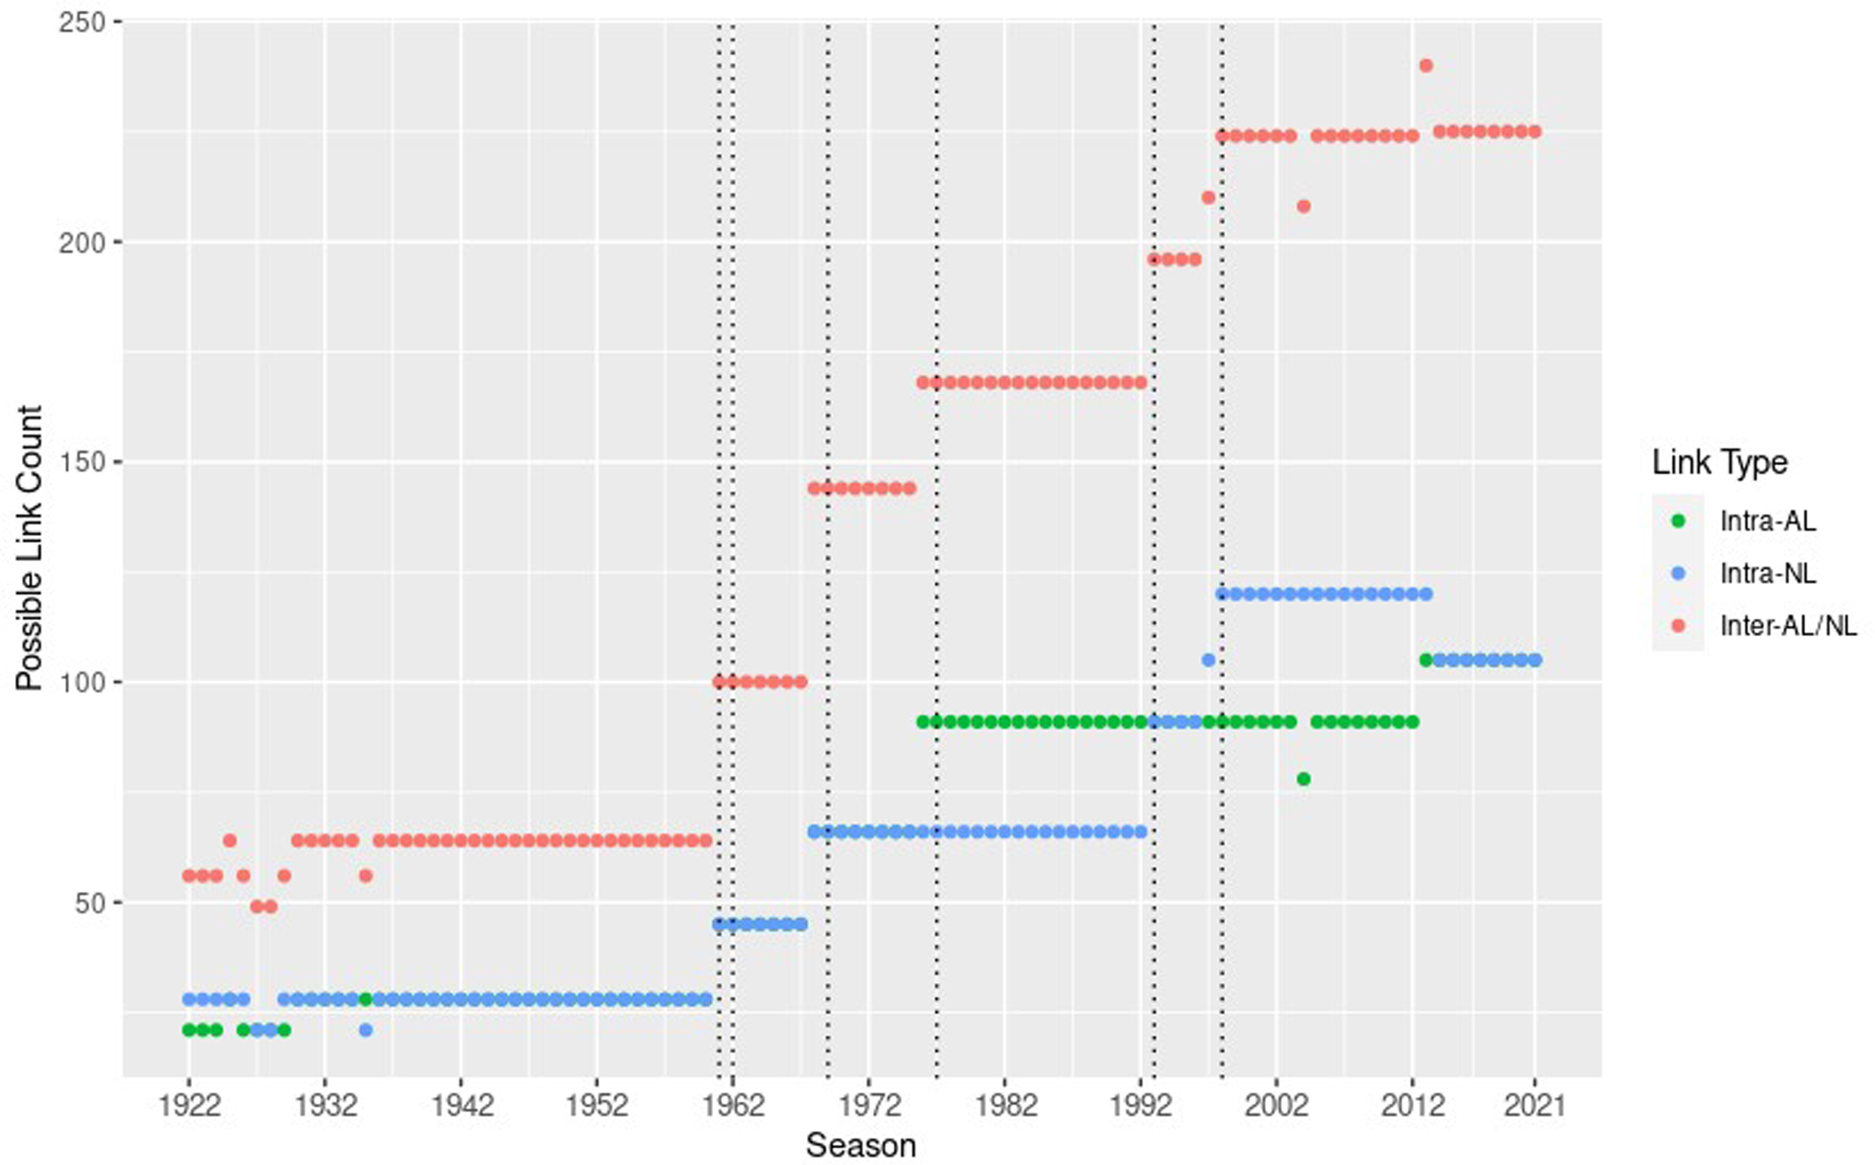
First, let us consider league-based volumes in Figure 2. Our focus is how inter-league volume compares with the two intra-league volumes over time. There is a noticeable shift around 1960. Prior to 1960, inter-league volume was comparable to or below the two intra-league volumes. After 1960, inter-league volume exceeded the two intra-league volumes. However, inter-league volume is positively correlated with total volume and total volume increases over time. Additionally, the number of teams (nodes) increases over time due to expansion, which increases the total volume potential. Since the number of possible inter- and intra-group links depends on node counts, it is unclear whether the increase in inter-league volume relative to the intra-league volumes is noteworthy or whether it is simply due to expansion. To better understand this, we can consider the number of possible inter- and intra-links depending on the number of teams (nodes). If
Next, we consider competitiveness-based volumes in Figure 3. For most years, we see that inter-W/L volume is greater than intra-L volume, which is greater than intra-W volume. Similar to equations (2) and (3), we can determine the number of possible intra-W, intra-L, and inter-W/L links for each season. These values are plotted in Figure 6. Unlike the previous case of league-based volume, the comparative differences between inter-W/L volume, intra-L volume, and intra-W volume matches the comparative differences in the number of possible links for each type. If we ask whether winning teams avoid trading with each other, it is not clear whether the lower intra-W volumes are attributed to transactional behavior or simply because there are less teams (nodes) in the W group. More generally, it is unclear whether the comparative differences between inter-W/L, intra-L, and intra-W volumes are different from what would be expected from a random network with an similar number of nodes in each group.
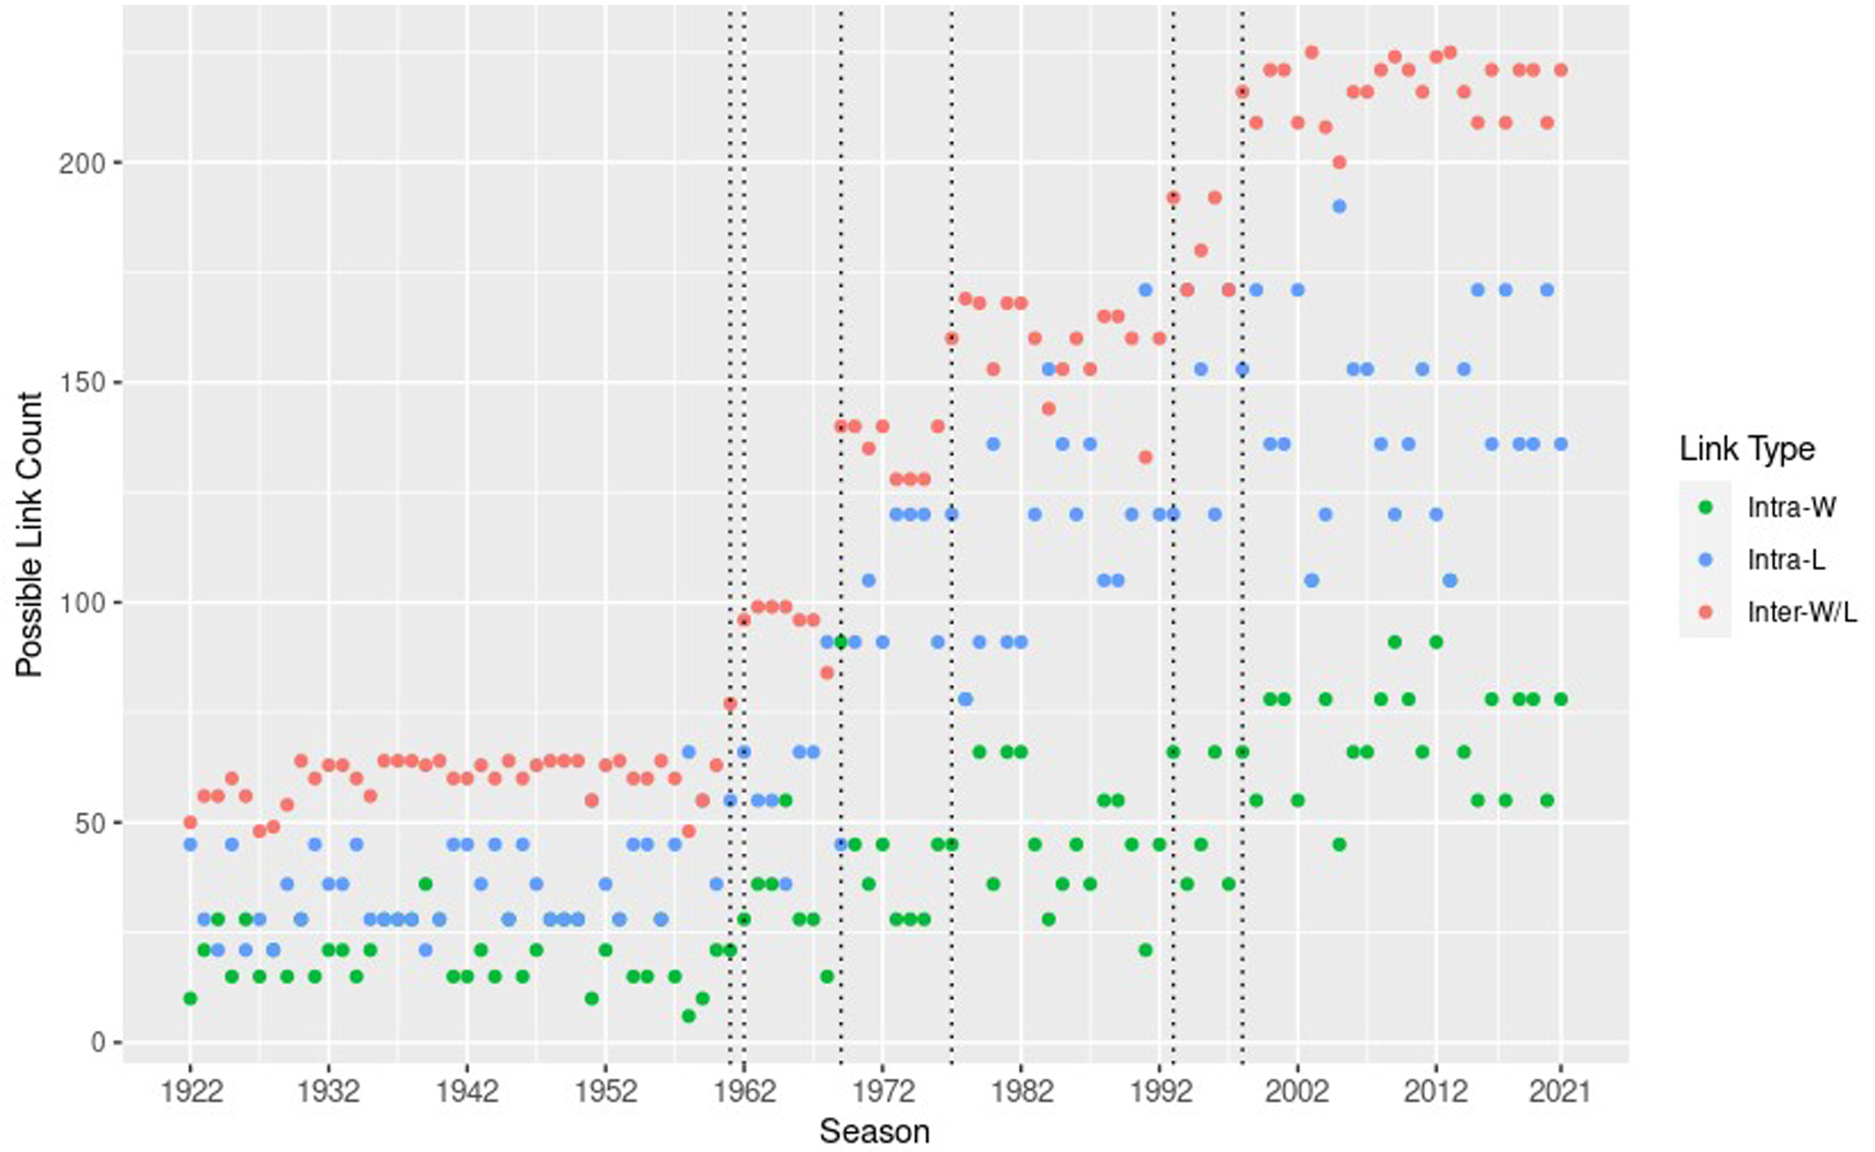
This shows the number of possible intra- and inter-group links relative to competitiveness by season, as determined by equations analogous to (2) and (3). Possible intra-W links are in green, possible intra-L links are in blue, and possible inter-W/L links are in orange. Vertical dotted lines are included for each expansion year.
Finally, we consider payroll-based volumes in Figure 4. Again, we have analogues to equations (2) and (3) from which we determine the number of possible intra-A, intra-B, and inter-A/B links for each season. These values are plotted in Figure 7. For most seasons, inter-A/B volume exceeds both intra-A and intra-B volumes and the latter two remain comparable on average. But these observations align with the higher number of possible inter-A/B links and nearly equal numbers of possible intra-A and intra-B links. Thus we gain no insights into transaction behavior related to payroll. Again, we see the need for a better way to compare inter- and intra-transaction volumes to what would be expected at random.
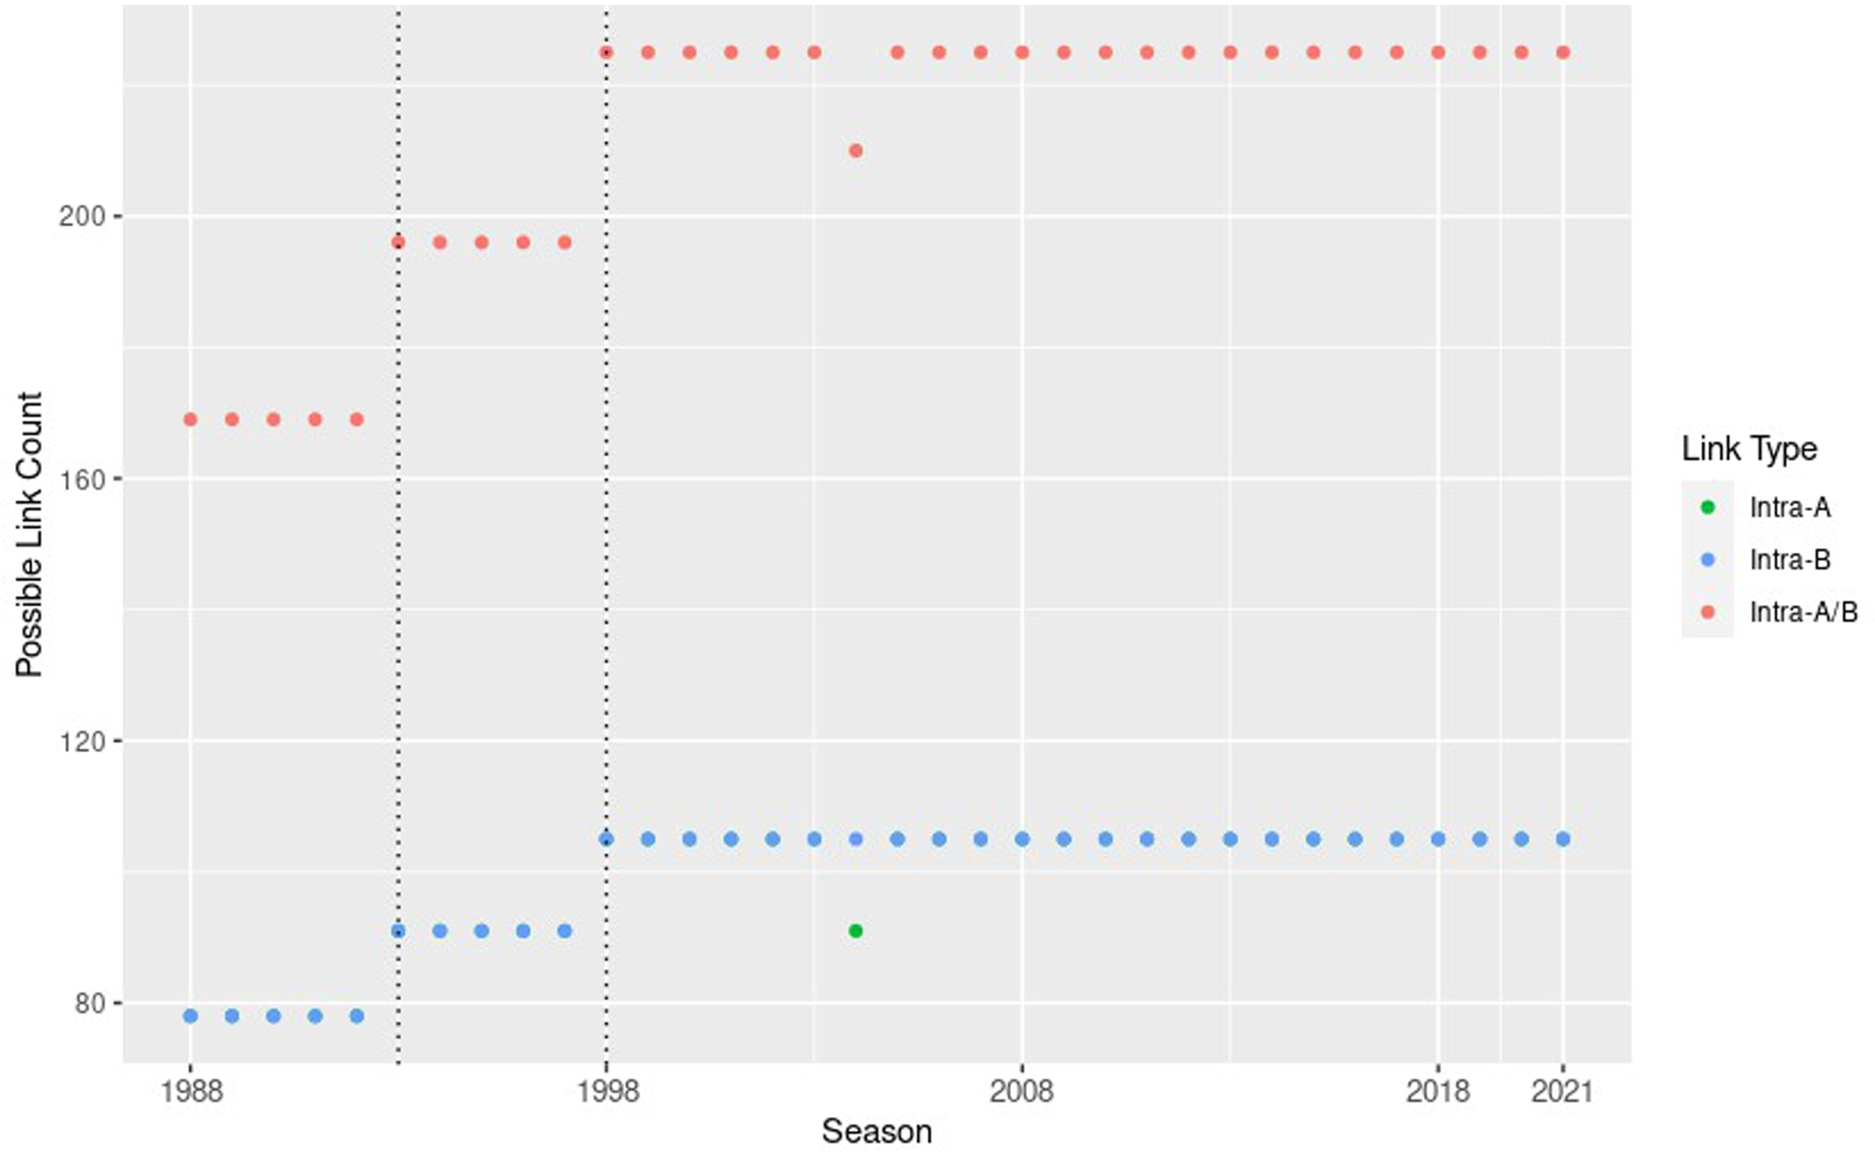
This shows the number of possible intra- and inter-group links relative to payroll by season, as determined by equations analogous to (2) and (3). Possible intra-A links are in green, possible intra-B links are in blue, and possible inter-A/B links are in orange. Vertical dotted lines are included for the two expansion years over the shortened time span.
Weighted dyadicity
In this section we revisit the analyses presented in Section “A preliminary analysis”, but now from the perspective of dyadicity. First, we give a brief definition of weighted dyadicity. Then we reconsider MLB transaction networks when grouped according to league, competitiveness, and payroll.
Definitions
We give a brief and non-technical definition for weighted dyadicity here, a more thorough treatment is given in Section “Appendix: Development of weighted dyadicity”. In Section “A preliminary analysis” we saw that considering intra- and inter-group volumes alone was insufficient for understanding transactional behavior relative to a particular grouping. We were able to slightly improve our understanding by comparing volume to the number of possible intra- and inter-group links a network could allow, but this was also incomplete. What we needed was a common baseline to compare any intra- or inter-group volume to, this is the expected volume.
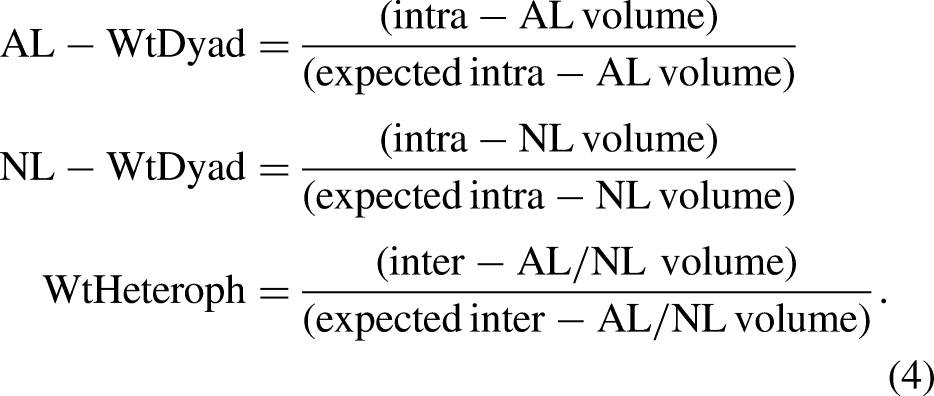
In what follows, we give weighted dyadicity definitions for the league-based grouping. One can easily replace the AL/NL group labels with either W/L or A/B group labels to obtain analogous definitions. Define weighted AL-dyadicity (AL – WtDyad), weighted NL-dyadicity (NL – WtDyad), and weighted heterophilicity (WtHeteroph) as All links on
When a transaction network has
League-based dyadicity analysis
In Section “A preliminary analysis” and Figure 2, we observed a steady increase in inter-league transactions. Additionally a shift was observed around 1960 when inter-league volume began to exceed both intra-league volumes. It was unclear whether the 1960 shift was due to suppressed inter-league volumes or inflated intra-league volumes prior to 1960. Moreover, it was unclear whether the comparative difference between inter-league and intra-league volumes was as expected in the post 1960 years. A dyadicity analysis provides answers to these questions.
Values for AL-dyadicity (
This shows league-based weighted dyadicity values by season, as discussed in Section “League-based dyadicity analysis”. AL-dyadicity is given in orange, NL-dyadicity is given in green, and AL/NL-heterophilicity is given in blue. Lines connecting annual values are not for interpolation.
The notable increase of inter-league transactions over the first 40 years followed by decades of relative stability begs possible explanations. One might point to the agreement at the 1959 summer owners meeting allowing waiver-free inter-league transactions (Henry and Kritzler, 2017); prior to this agreement inter-league trades were “seriously inhibited” by waiver requirements (Horowitz, 1993). While the 1959 agreement might explain the stability in post-1960 inter-league transactions relative to expected levels, it fails to account for the consistent increase of inter-league transactions relative to expected levels over many years well before 1959. A closer look at Figure 8 shows a steady increase in inter-league transactions relative to expected levels (increasing WtHeteroph) over the years 1932–1940 and 1952–1962. Interestingly, two other significant rule changes for inter-league transactions occurred in 1934 and 1952; both intended to make inter-league transactions more restrictive (Blau, n.d.; Drebinger, 1952). Yet inter-league transactions continued to increase, both in absolute terms and relative to what would be expected at random. It seems reasonable that the 1934 and 1952 restrictions were responses intended to curb otherwise increasing inter-league transactions. Indeed the 1952 rule change was in part a response to Yankee (AL) dominance that was supported by player purchases from NL teams (McGowen, n.d.). Inter-league attitudes have shifted over time, from being distinct rivals in the earliest days to being two parts of a single MLB organization (Nowlin, 2019). It is reasonable to think that consistent increases in inter-league transactions are as much due to gradual cultural and strategic shifts as to any single rule change and that the rule changes were responses to these larger cultural shifts.
Competitiveness-based dyadicity analysis
In Section “A preliminary analysis” we were unable to establish whether competitive teams are averse to trading with each other. While Figure 3 did show intra-W transaction volumes lower than all other volumes, one possible explanation was the comparatively lower number of possible intra-W links in Figure 6, leaving us with an incomplete understanding. We can now resolve this question. Values for for W-dyadicity (
In contrast, both intra-L transactions and inter-W/L transactions all occur near expected levels (
Payroll-based dyadicity analysis
In Section “A preliminary analysis” we considered transaction volumes when teams were grouped according to payroll. We observed in Figure 4 that for most seasons, inter-A/B volume exceeds both intra-A and intra-B volumes, and the latter two remain comparable on average. But this difference agreed with the higher number of possible inter-A/B links in Figure 7. It remained unclear whether the significantly larger inter-A/B volumes were expected or due to transactional behavior. However, in Figure 9 we observe neutrality for A-dyadicity (
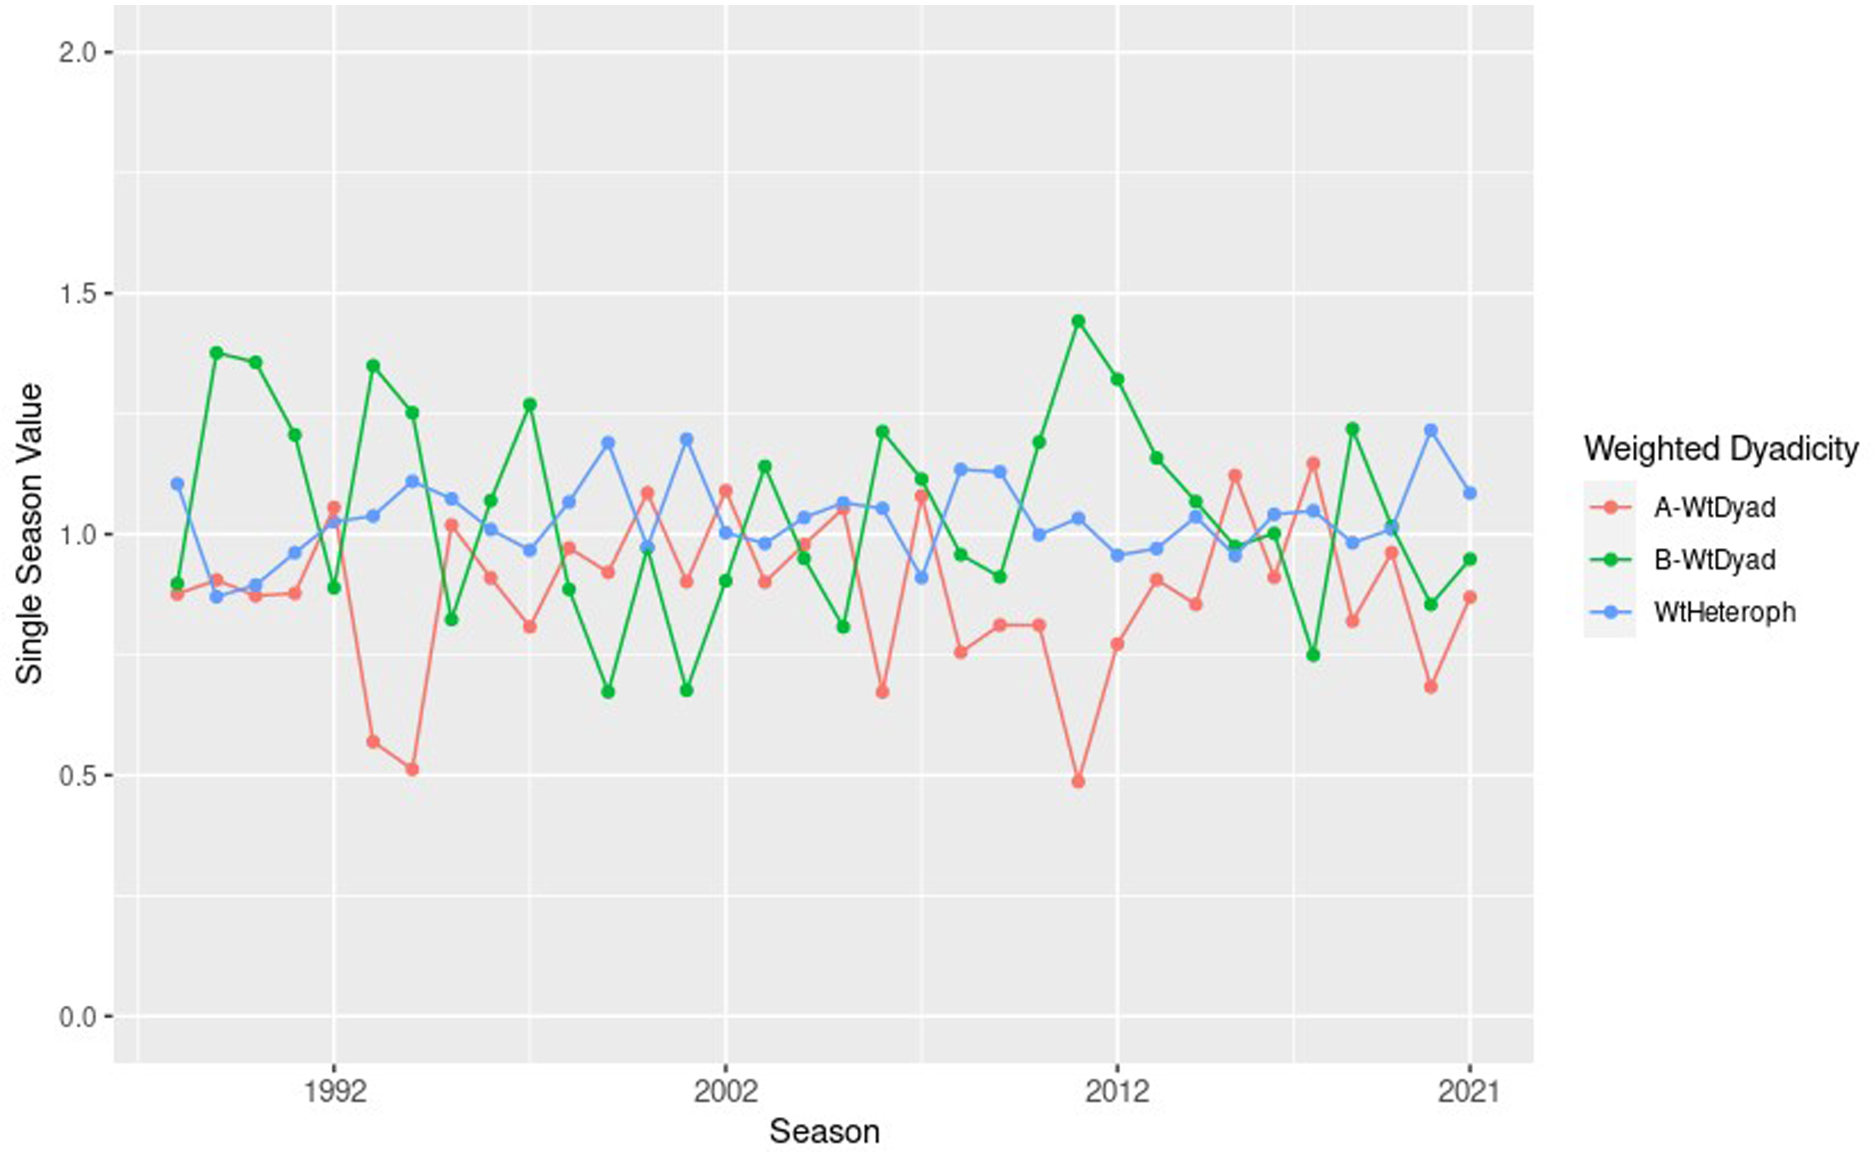
This shows payroll-based weighted dyadicity values by season, as discussed in Section “Payroll-based dyadicity analysis”. Above median payroll (A) dyadicity is given in orange, at or below median payroll (B) dyadicity is given in green, and A/B-heterophilicity is given in blue. Lines connecting annual values are not for interpolation.
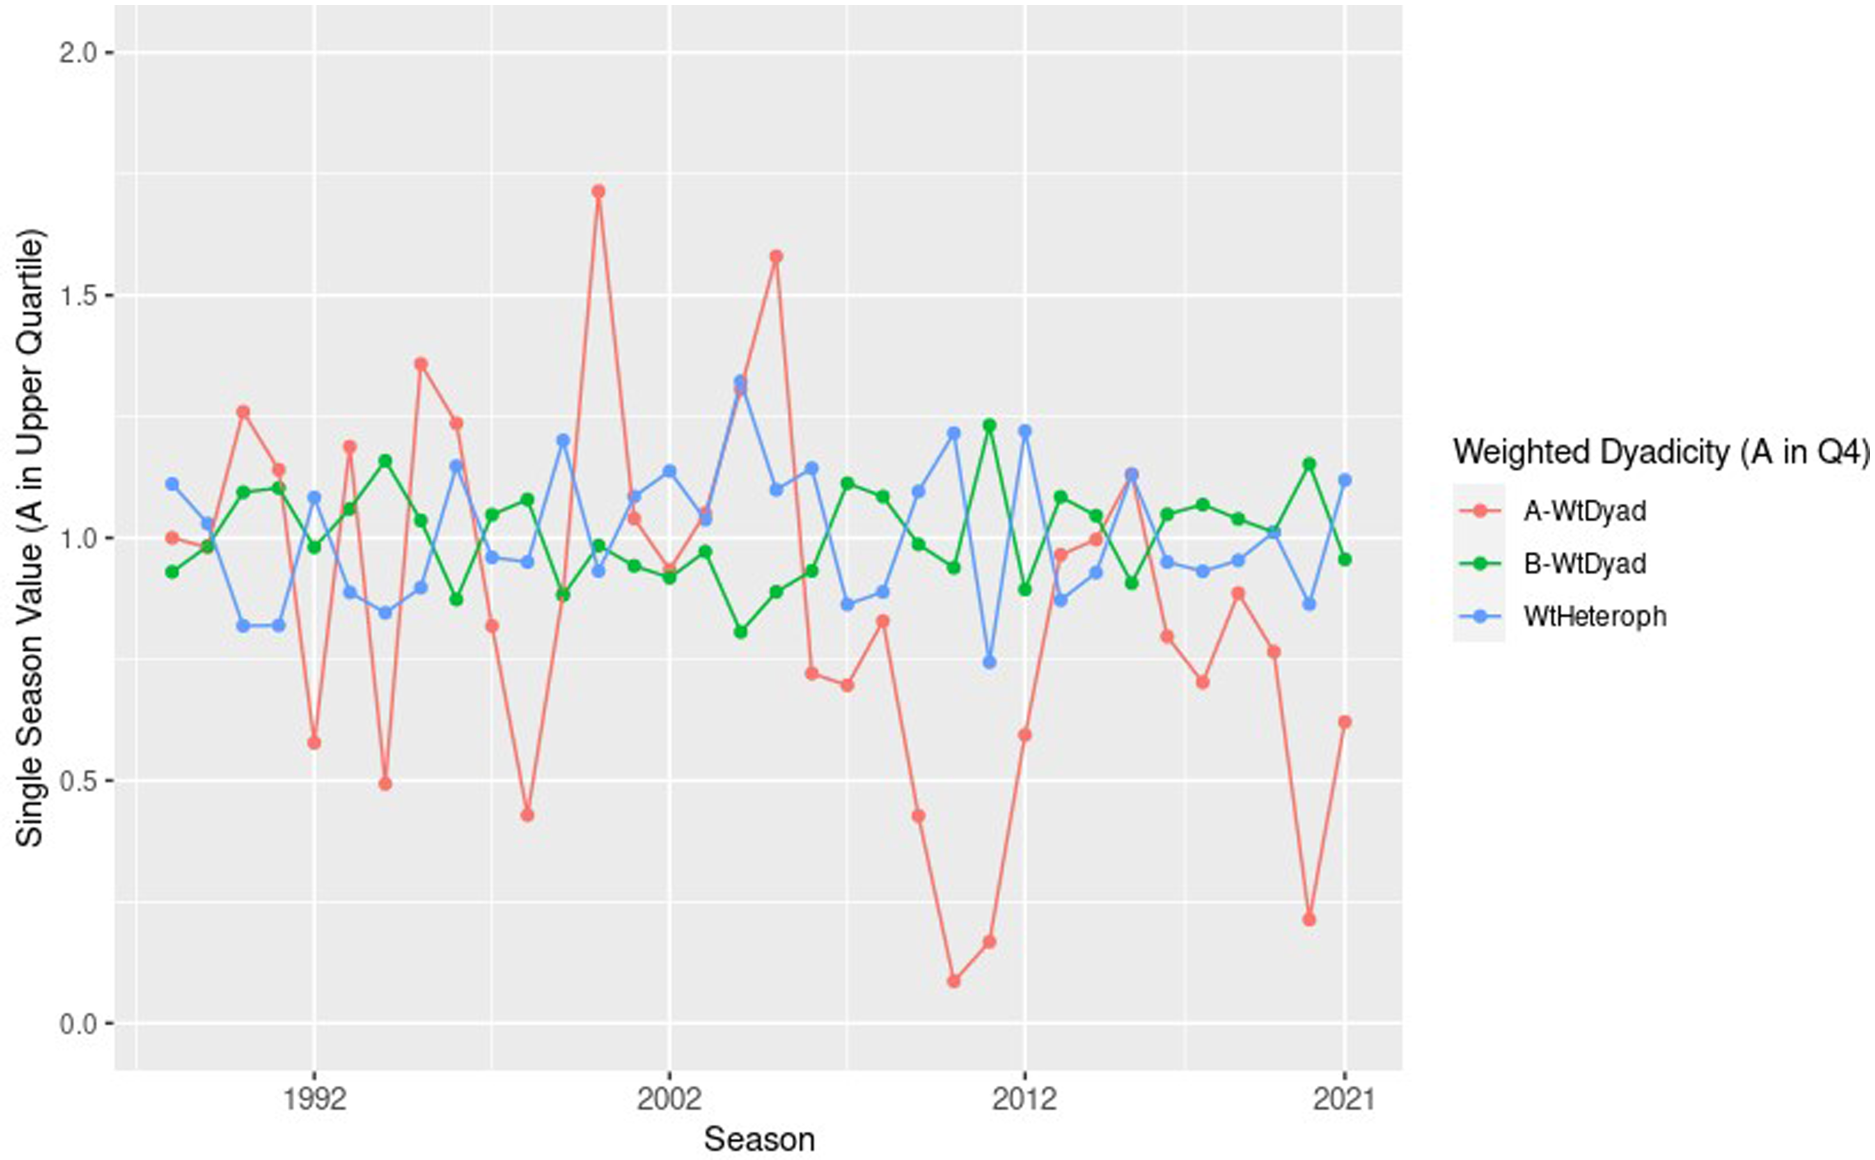
This shows payroll-based weighted dyadicity values by season when using the upper quartile threshold, as discussed in Section “Payroll-based dyadicity analysis”. Above upper quartile payroll (A) dyadicity is given in orange, at or below upper quartile payroll (B) dyadicity is given in green, and A/B-heterophilicity is given in blue. Lines connecting annual values are not for interpolation.
Our payroll-based analysis is relevant to the question of competitive-balance, which asks whether superior purchase power results in significant on-field advantage (Levin et al., 2000; Veach, 2010). We do not attempt to address this complicated question with the above observations, but we do offer small insights. Since inter-A/B, intra-A, and intra-B volumes all occur near expected levels, distinct classes in the player transaction market are not formed within MLB based purely upon payroll. For example, we do not see consistent trends of A-group teams primarily trading high payroll players among themselves. If anything, we see slightly lower than expected intra-A transactions for some seasons. Also, the fact that inter-A/B transactions hold very close to expected values throughout suggests a healthy amount of player movement between high and low payroll teams. It is important to note that the data considered here are entirely in the era of free-agency but free-agent purchases are not included in our data. Studies such as Maxcy (2002) focus on payroll imbalance in the free-agent market; our analysis cannot be compared with these works. Moreover, while our analysis has some relevance to the competitive-balance question, understanding the economic causes of our observations is beyond the scope of this work.
Conclusion
We presented weighted networks for seasonal transactions between Major League Baseball teams over the seasons 1922–2021. Then we grouped teams according to three attributes: league, seasonal competitiveness, and seasonal payroll. Each grouping was relevant to a question in baseball history, strategy, or economics. First, we tried an overview analysis by considering inter- and intra-group volumes, but found this approach to be inadequate. In response, we defined weighted dyadicity, which included an expected volume baseline for comparison. With dyadicity we were not only able to confirm consistent growth in inter-league transactions over the decades leading up to 1960, but also to observe stable and expected levels of inter- and intra-league transactions in the decades that followed. Additionally we were able to confirm the strategic reasoning that competitive teams avoid transactions with each other. Finally we applied weighted dyadicity to a payroll-based grouping and observed that payroll does not generally have a significant influence on who teams transact with. While these baseball specific findings are interesting in their own right, they also highlight the broader potential of weighted dyadicity for examining the impact of binary groupings on any complex relationship that can be modeled with weighted networks.
Footnotes
Acknowledgments
This research was supported by a research grant from the College of St. Scholastica School of Sciences.
Funding
The authors received no financial support for the research, authorship, and/or publication of this article.
Declaration of conflicting interests
The authors declared no potential conflicts of interest with respect to the research, authorship, and publication of this article.