
Abstract
In the run-up to any major sports tournament, winning probabilities of participants are publicized for engagement and betting purposes. These are generally based on simulating the tournament tens of thousands of times by sampling from single-match outcome models. We show that, by virtue of the tournament schedule, exact computation of winning probabilties can be substantially faster than their approximation through simulation. This notably applies to recent FIFA World Cups and is independent of the model used for individual match outcomes.
Introduction
Predicting sports tournament winning probabilities is not just a popular pastime and an academic proxy competition, but also sets expectations and thus informs bookmakers’ betting odds and gamblers’ placement of wagers (Winston et al., 2022). Hence, a flurry of predictions is published before each major tournament. Our focus here is on association football (soccer), and specifically the most recent FIFA World Cups, but the technique we introduce is more generally applicable.
Winning probabilities are commonly obtained via tournament simulations sampling from single-match outcome prediction models. While attention-seeking media tend to use cute animals to sample match outcomes (see also Horvat 2020 for their proper naming), machine learning and other statistical models (Horvat and Job, 2020; Tsokos et al., 2019) enable repeated sampling to stabilize predictions. Prominent examples of simulation-based predictions include those of Website FiveThirtyEight, 1 the Alan Turing Institute, 2 Joshua Bull, 3 the DTAI Sports Analytics Lab, 4 and other groups of academic forecasters. 5
We do not attempt to add to the rich list of outcome prediction models, but rather facilitate the replacement of a shared feature – the use of tournament simulations to extend single-match predictions to overall winning probabilities – by a computationally more efficient and precise algorithm. Published probabilities would often be based on 100 000 simulation runs, and almost never on less than 10 000. Our algorithm computes the exact probabilities (relative to the single-match model) in time equivalent to a few hundred simulation runs.
As has been discussed multiple times, probabilities are efficiently computed in a bottom-up traversal of the tournament bracket, if the seeding of teams is fixed (Bettisworth et al., 2023; Edwards, 1991; Schwertman et al., 1991). However, for a variety of reasons including a guaranteed minimum number of matches for each participating team, bracket seeding is generally not fixed, but determined in a preceding group stage. For tournaments such as the most recent FIFA World Cups the number of possible bracket seedings is in the hundreds of millions and therefore prohibitively expensive to enumerate. Koning et al. (2003) propose a hybrid approach in which winning probabilities are calculated conditional on group rankings sampled via simulation.
Our approach differs from the above in that we enumerate outcomes for each group separately, and propagate probabilities of advancing through the bracket while considering dependencies created by teams on intersecting trajectories, especially those that already originate from the same group. By making these dependencies explicit we are able to exploit independence among the remaining outcomes.
Our approach therefore relies on the limited mixing of team trajectories in current world cup formats. There are several other tournament formats that allow for the exact computation of probabilities. Among them are single-elimination tournaments with random seeding (David, 1959; Hartigan, 1966), double-elimination tournaments with a given seeding (Edwards, 1996), a variant of single- and double-elimination in which a team must win two matches against an opponent to advance (Searls, 1963), and a random knockout tournament for the case that the number of participants is not a power of two (Narayana and Zidek, 1969).
In addition to the scenarios above, exact winning probabilities can further be used to assess seeding criteria empirically (David, 1988). The issue of effectiveness, i.e., whether the highest rated team is most likely to win, has been studied for various tournament designs (Appleton, 1995; Chung and Hwang, 1978; Glenn, 1960; Hwang, 1977; Marchand, 2002; Maurer, 1975; McGarry and Schutz, 1997; Schwenk, 2000). This includes, in particular, FIFA World Cups (Cea et al., 2020; Scarf and Yusof, 2011; Sziklai et al., 2022).
The remainder is organized as follows. In Section Preliminaries, we define terminology and the tournament format considered. The computationally efficient and exact extension of any single-match outcome model to tournament winning probabilities is described in Section Tournament winning probabilities. For concreteness, we introduce two exemplary outcome models in Section Single-match outcome probabilities and apply both to the FIFA Men’s World Cup 2022 and the FIFA Women’s World Cup 2023 in Section Results. We conclude in Section Conclusion by discussing limitations and possible extensions.
Preliminaries
We consider tournaments in which
Tournament schedule and notation
Denote by Group stage: participants compete in Knockout stage: the remaining
As shown in Figure 1, the fixtures of our two focal tournaments differ in the way teams can meet in the elimination rounds. We will see below that this matters also for computation time, because the mixing of team trajectories creates dependencies among winning probabilities.
Tournament schedules for
Assumptions
We assume knowledge of the outcome distribution of individual matches on the level of wins, draws, and losses, i.e., we do not consider score-lines. The basis on which match outcome probabilities are determined varies. Proposed models often include past performance, but also player roster and market value, match location and weather conditions, betting behavior and social media signals, and for international sides even country characteristics and stock market trends (Batarfi and Reade, 2021; Groll et al., 2015; Hubáček et al., 2022; Kuper and Szymanski, 2022; Lepschy et al., 2020; Schauberger and Groll, 2018).
Our computational scheme is independent of the particular choice of model used to predict match outcomes. We only require the following conditions to be met.
Match-level predictions must not change after the start of the computation, i.e., they may not be updated with evidence that becomes available later. Match outcomes are independent from each other, i.e., based only on information about the two teams playing each other. The only outcomes distinguished are winning, drawing, and losing, i.e., tie-breaking to determine a ranking at the end of the group stage (based on goal differences, direct comparisons, fair-play etc.) as well as extra time and penalty shootouts in the knockout stage are not considered and instead treated as fair coin flips.
The first two assumption are violated, for instance, if a team attempts to engineer a result to prevent a specific team in their group from entering the knockout stage, or to avoid a specific opponent from another group by finishing second.
While most of the above assumptions can be weakened or dropped altogether, they are instructive and simplify the exposition.
Tournament winning probabilities
It is important to note that in the tournaments we consider, fixtures are determined in advance, i.e., the trajectory of a team is known by the end of the group stage. In contrast, many national and international cup competitions for clubs feature additional draws after group stages and between elimination rounds.
Group stage
The group stage is organized into separate round-robin tournaments within each group. Whether a team advances through this stage is thus determined by the results of all matches in the group, including those between other teams. These within-group dependencies require us to enumerate all possible combinations of match outcomes, but since probabilities of ranks in the final group standings are independent of matches in other groups, we can do so separately for each group.
Hardness results for round-robin tournaments suggest that there is no substantially more efficient alternative (Bernholt et al., 1999, 2002; Kern and Paulusma, 2001).
Knockout stage
With half of the
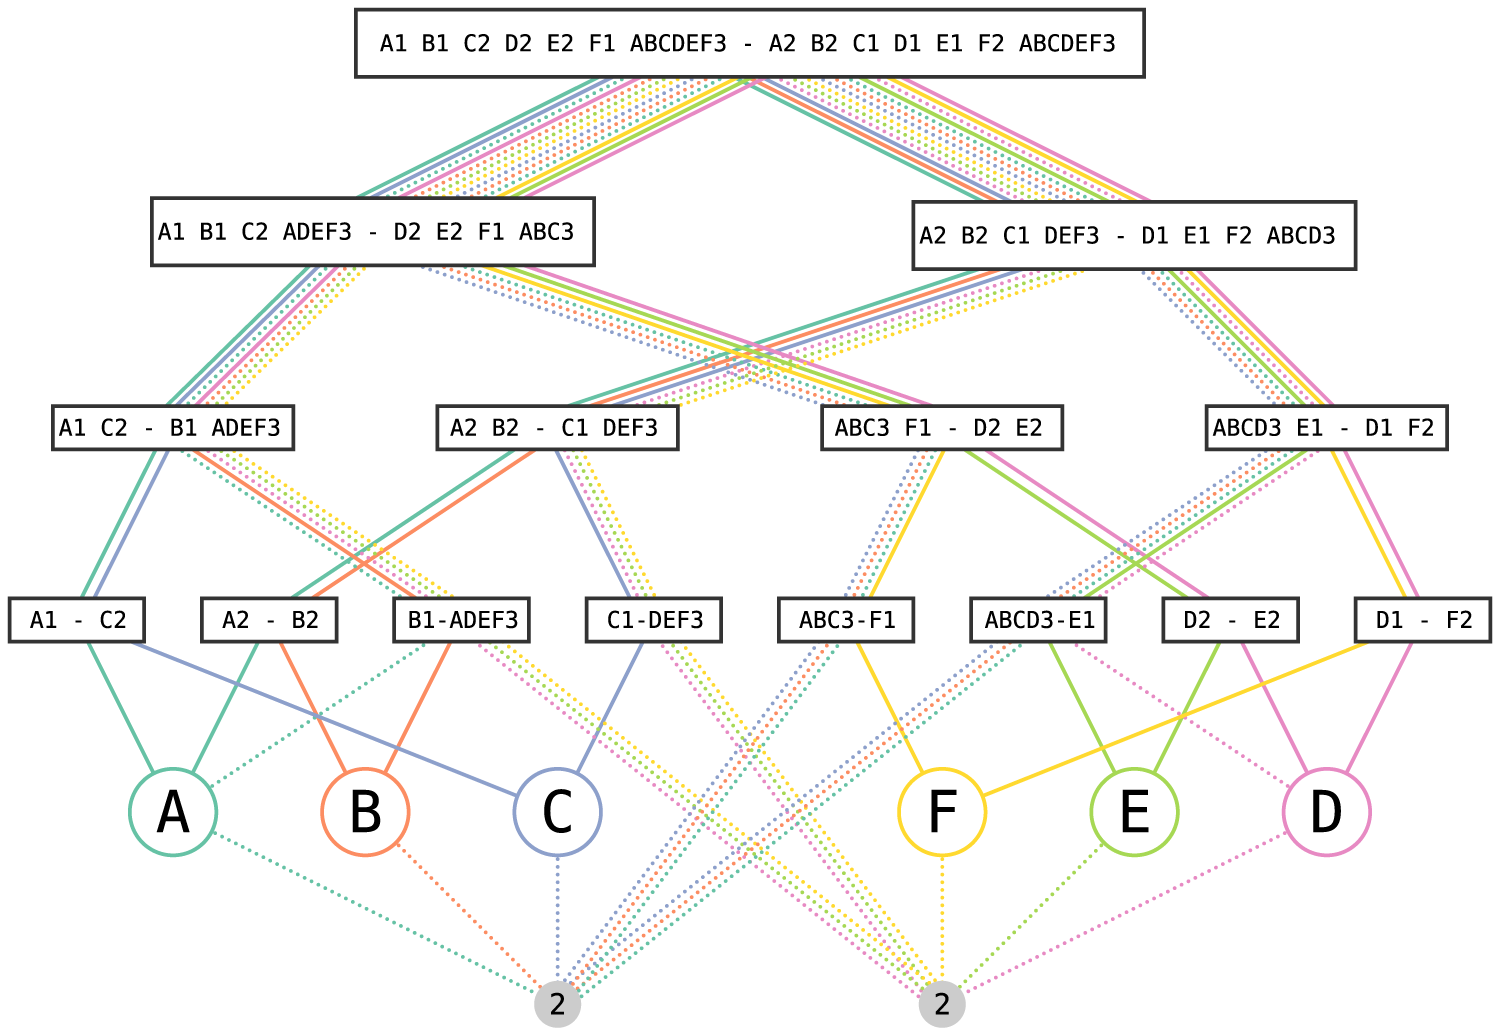
Curiously, fixtures differ between the two FIFA tournaments shown in Figure 1. While it was possible for two teams from the same group to play the final in the men’s competition, (had they won their semifinals, Croatia and Morocco, both from Group F, would have played the final rather then the match for third place) this was not possible in the women’s competition, because the tournament bracket separates the eight groups into two subtrees of four that do not mix before the final. As a consequence of this difference, for instance, it was impossible for England (Group D) and the USA (Group E) to face each other before the final, or for the USA and Spain (Group C) to play the final.
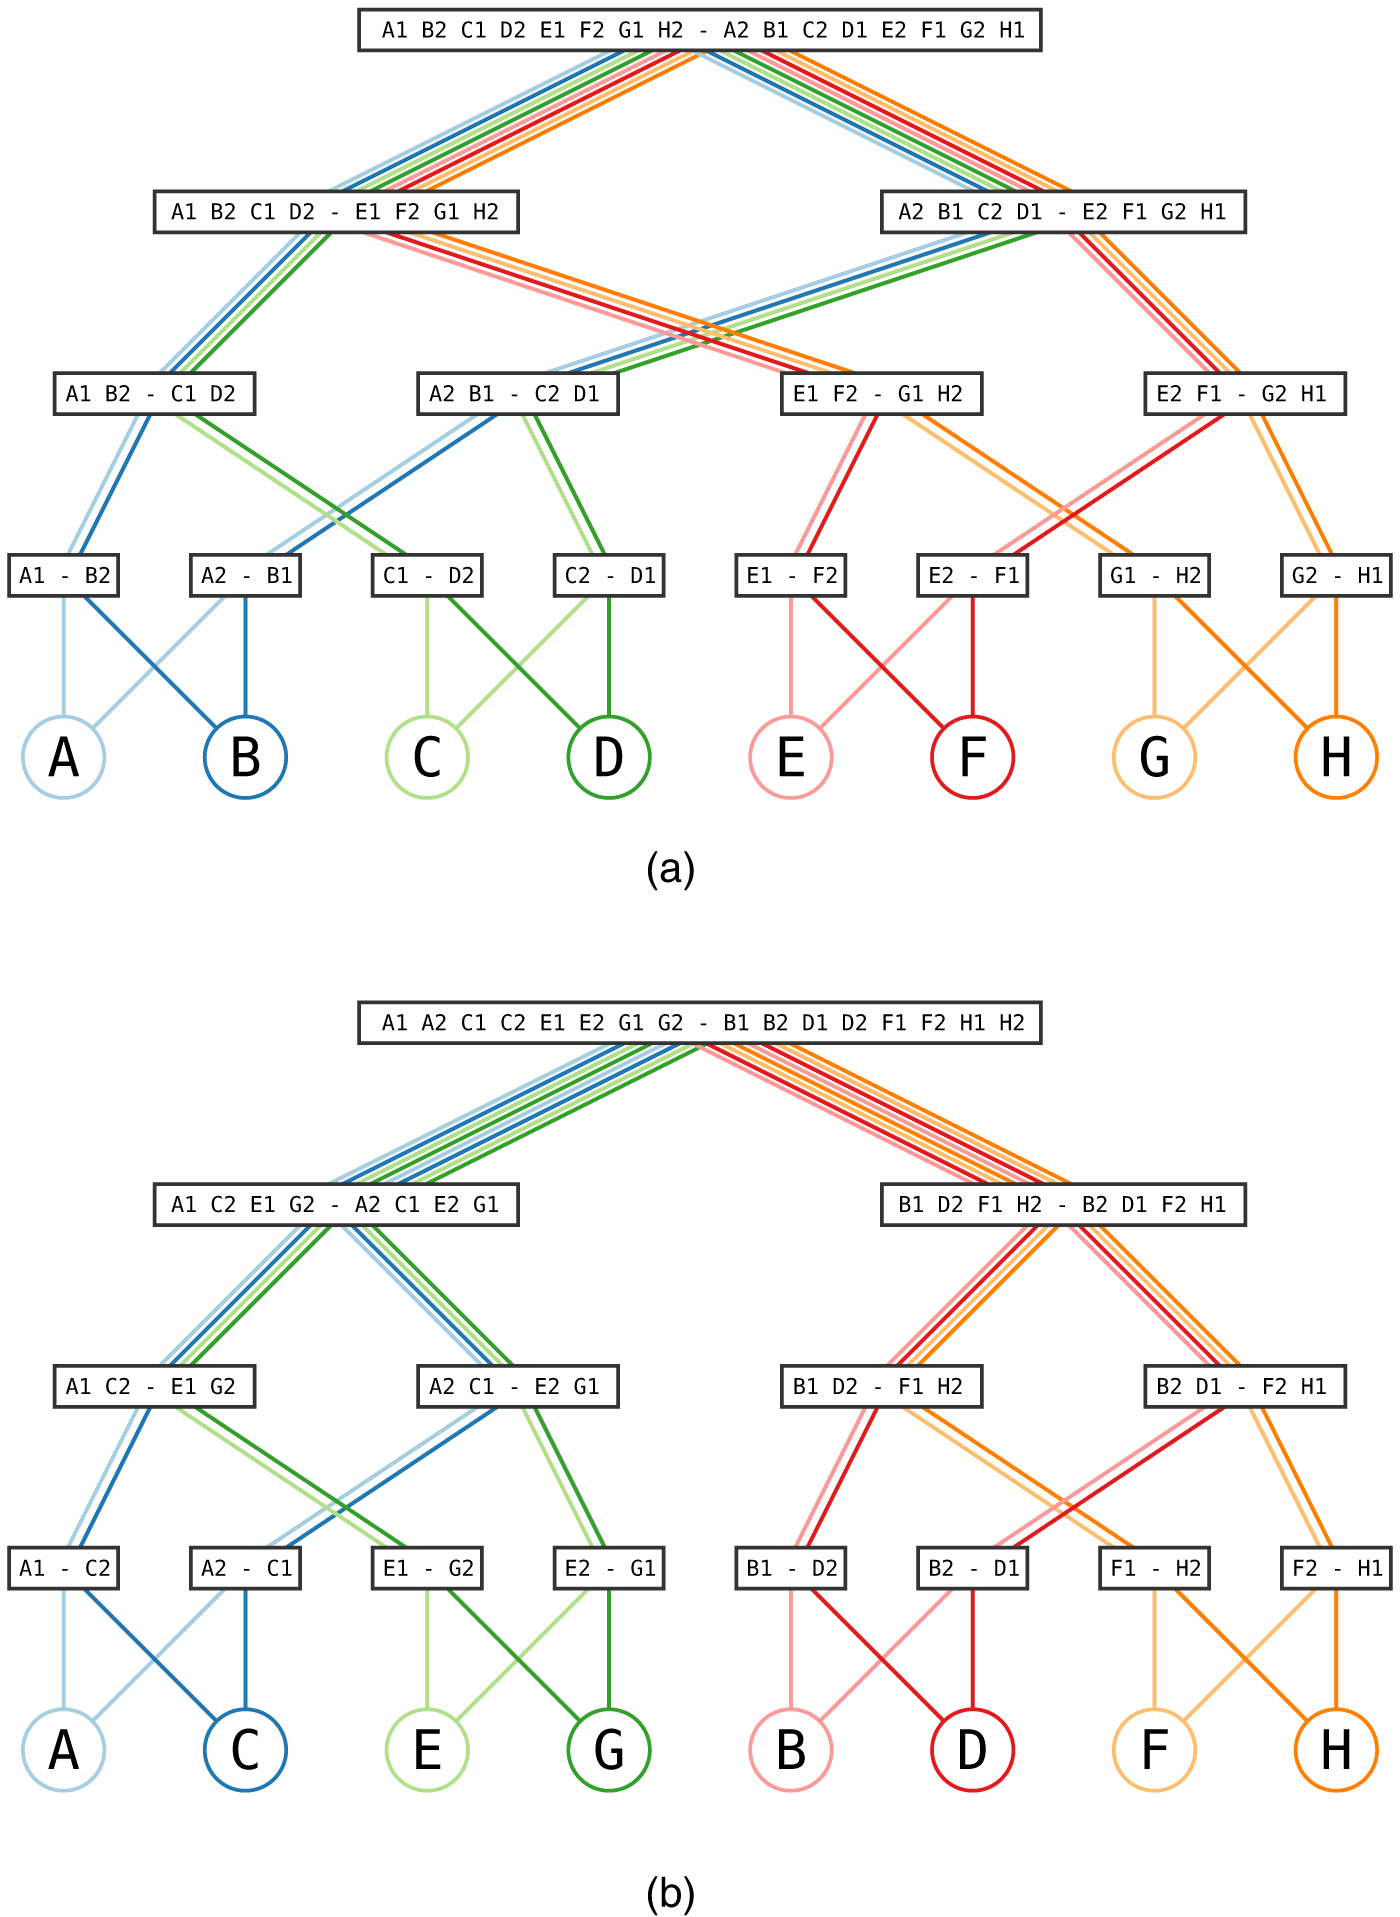
In both tournaments, the brackets are set up such that each group sends a pair of teams into the round of the last 16 where they face a pair of opponents from the same other group, i.e., their two subtrees are mixing. The probabilities of teams being involved in these matches are not independent, because a team participating as the first-placed from their group increases the probability of all other teams to participate as the second-placed, while reducing its own probability to zero.
The key observation, illustrated in Figure 2, is that whoever appears in these two matches is independent from the other pairs of groups, and that the same kind of separation of subtrees is maintained upwards. In each round, mixing is only between pairs of consecutive intervals of groups.
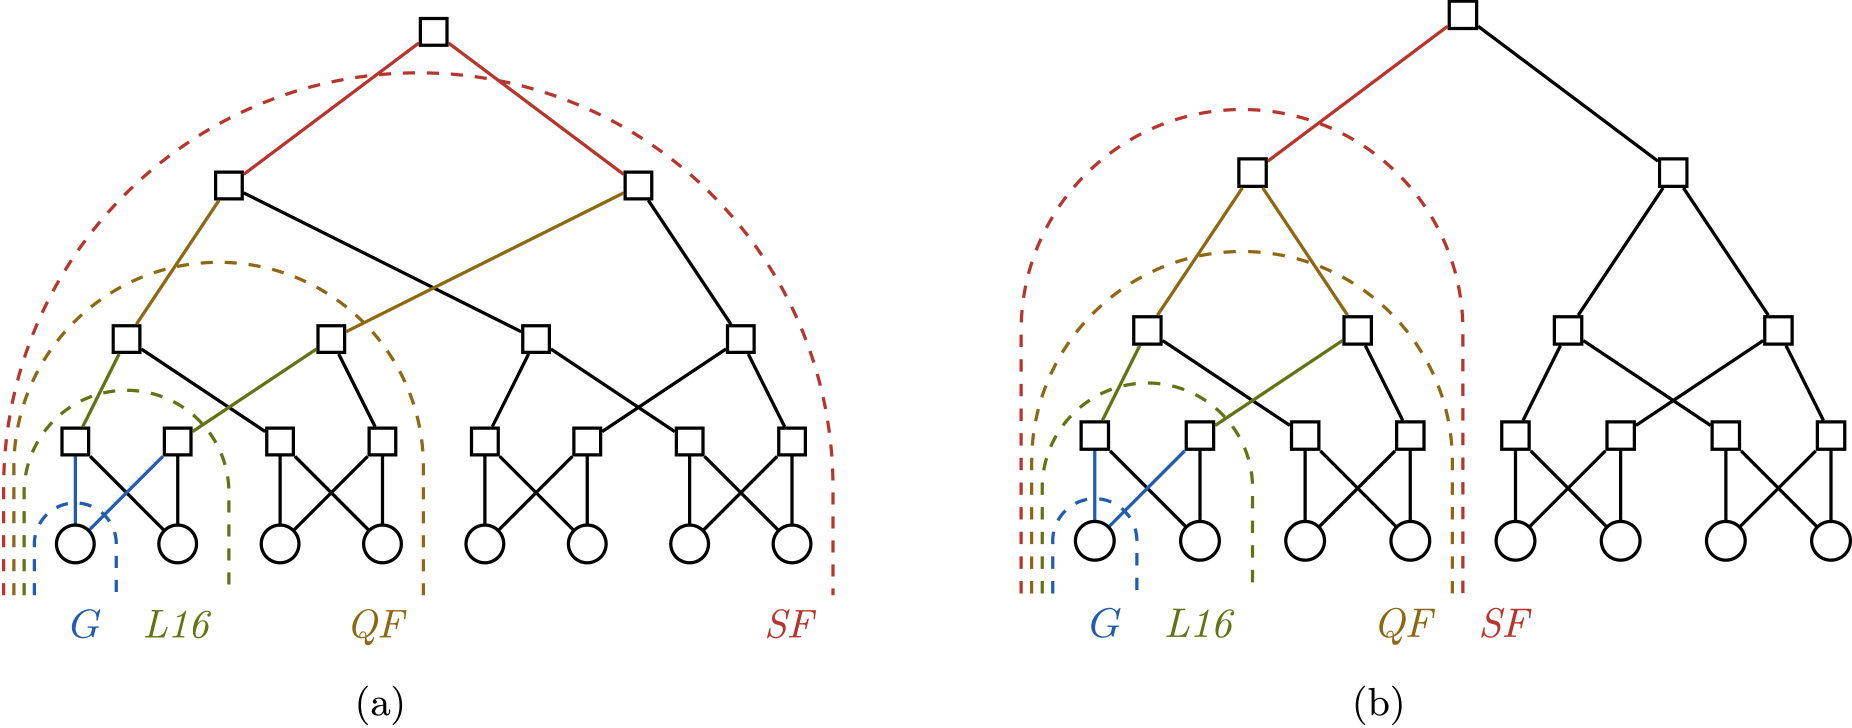
Probabilities of teams to advance to the next round (i.e., to cross a dashed line) are independent from teams and matches outside of the respective dashed line. (a) FIFA Men’s World Cup 2022; (b) FIFA Women’s World Cup 2023.
Single-match outcome probabilities
With the assumptions from Section Preliminaries, we can pre-determine match outcome distributions for an upper-triangular matrix of random variables
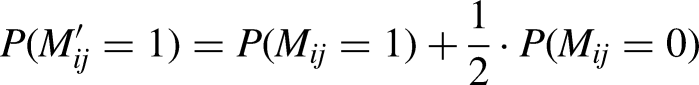
Since elimination matches do not end in a draw, we derive another matrix
In principle, the algorithm described in Section Tournament winning probabilities can be applied to any oracle
Model 1: hypothetical strengths prior to tournament
Due to their importance during the group stage, the first illustrative model explicitly accommodates draws for paired comparisons, in addition to wins and losses. Specifically, we use an extension of the basic Bradley and Terry (1952) model from Davidson and Beaver (1977). As shown in Table 1, the model yields outcome probabilities for a match played between two teams
Match outcome probabilities based on relative team strengths
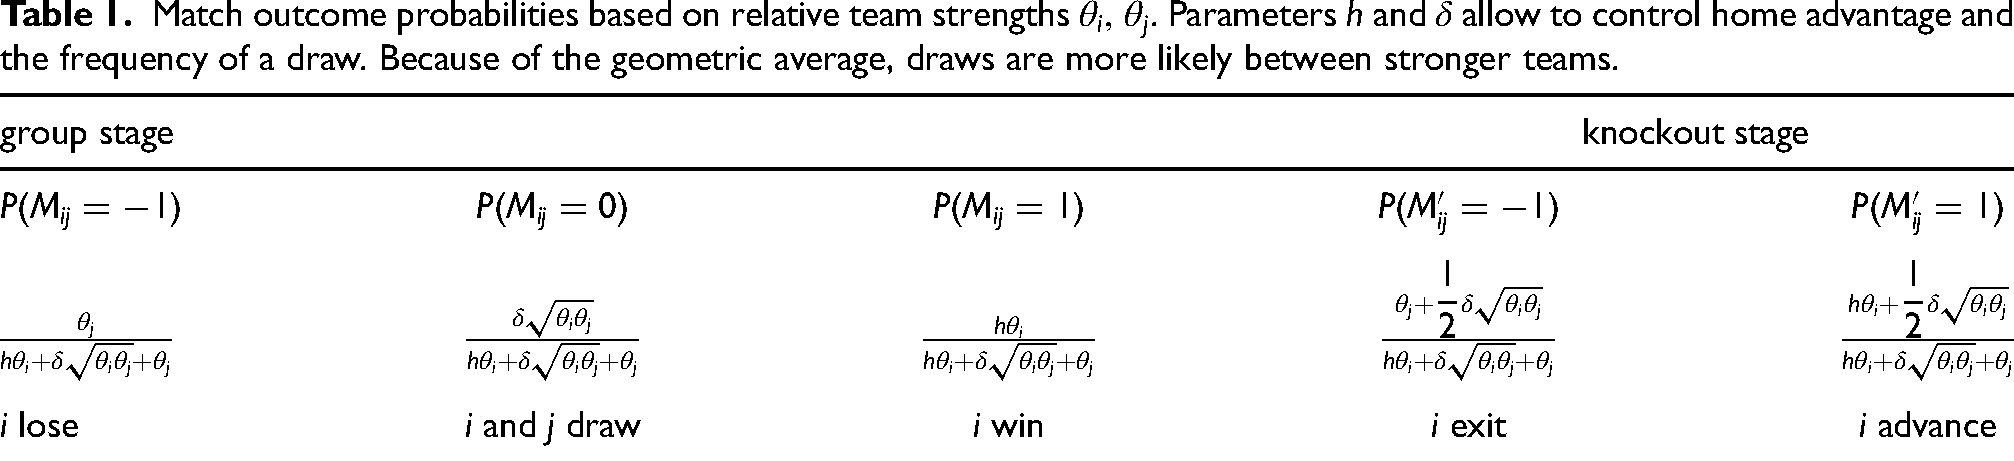
The relative team strengths are obtained from differences in given absolute team ratings in the same way that expected outcomes are calculated in the FIFA/Coca-Cola World Rankings update algorithms. These rankings are based on variants of Elo ratings (Elo, 2008) and thus on past results. Team ratings are expressed in points 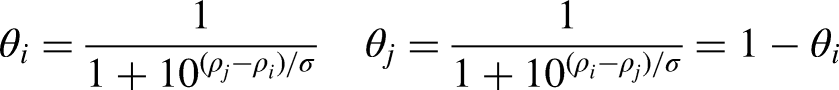
Figure 3 shows outcome probabilities of re-scaled differences in ratings. By our choice of
Outcome probabilities of Model 1 as a function of re-scaled negative differences
Model 2: performance at tournament
Predictions made before a tournament may have to be revised in light of actual performances. In a second model, we define outcome distributions for matches that actually occurred based on chances created in them. Data company StatsBomb provides event data for both world cups 7 from which we extract all shots with their associated probability to yield a goal (expected-goals values). Treating shots as independent Bernoulli trials yields a Poisson-binomially distributed random variable for the number of goals scored from a series of attempts. Assuming independence again, we calculate match outcome probabilities from the joint distribution of goals scored by two teams playing a match.
For those matches that need to be considered to determine tournament winning probabilities, but have not actually been played, we resort to Model 1.
Results
We start by giving theoretical arguments and performance results to show that the above approach is more efficient than simulation. Details on the implementation are provided in Appendix A.1.
As an example use case, we then apply our tournament algorithm to the two most recent world cups using the oracles described in Section Single-match outcome probabilities. To the extent that FIFA ratings and expected points actually capture them, this yields a comparison of tournament outcomes with expectations and performance, conditioned on fixtures and group seeding. We emphasize that these results are sensitive to the specifics of the match outcome models, and that our goal is to demonstrate the computational feasibility of extending them to an entire tournament rather than to perform detailed retrospective analyses of the events.
Computational complexity
Since there are
During the knockout stage, the number of elementary steps necessary is determined by the number of matches to be played and the number of pairs of teams that can possibly appear in them. Although there are only
For each group, there are
From each pair of groups facing off in the first elimination round,
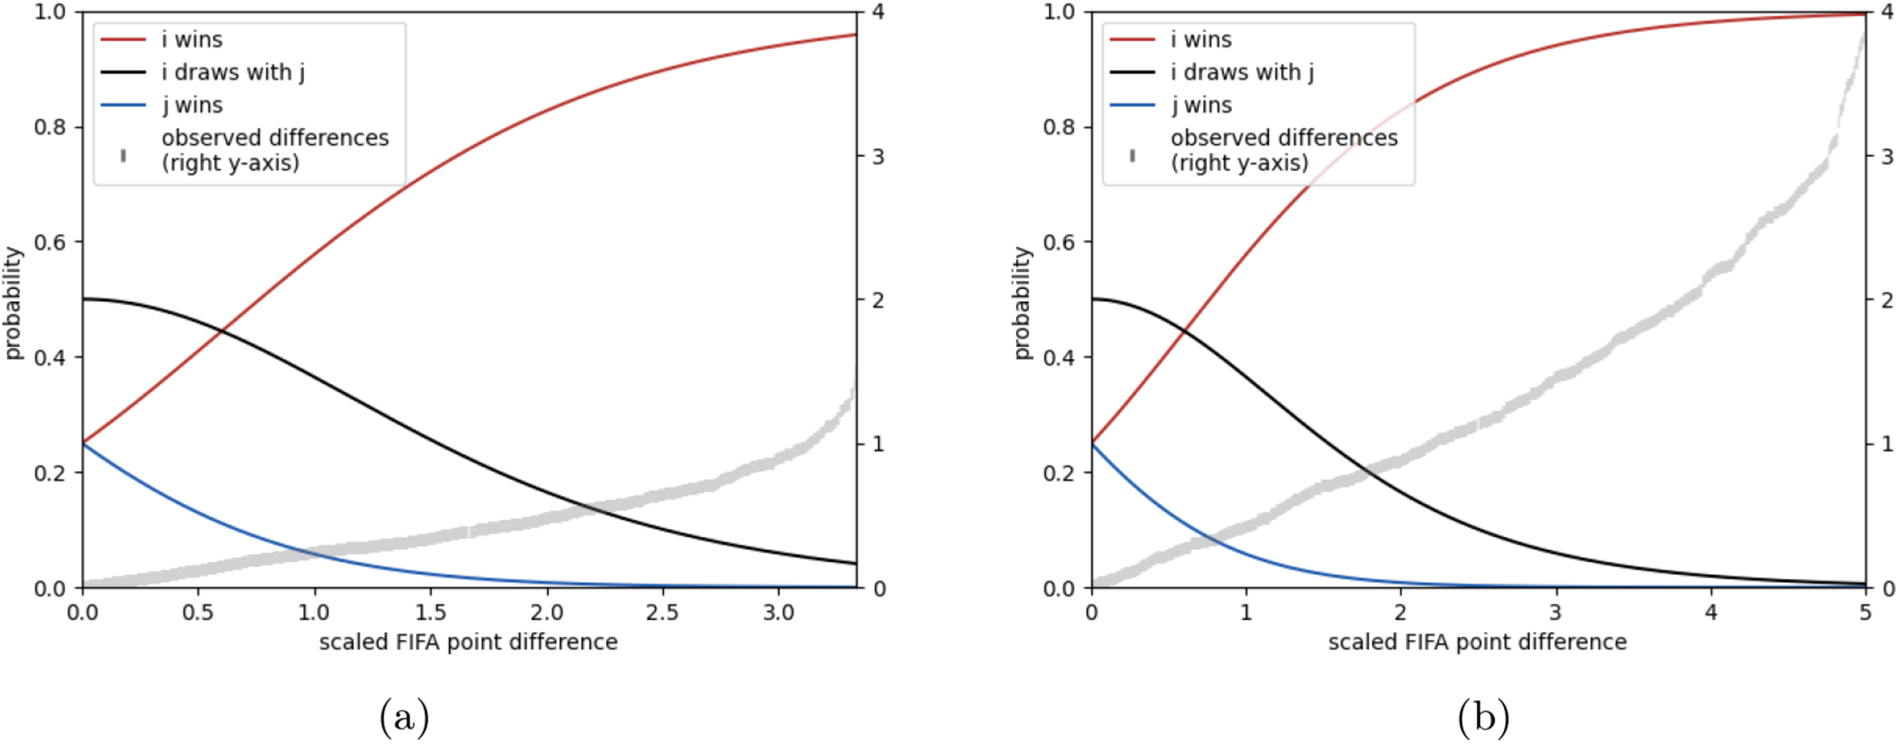
The aggregate numbers of outcome probabilities that contribute to the overall winning probabilities is given in Table 2. Any one simulation run, on the other hand, samples
Number of elementary probabilities to determine in each round.
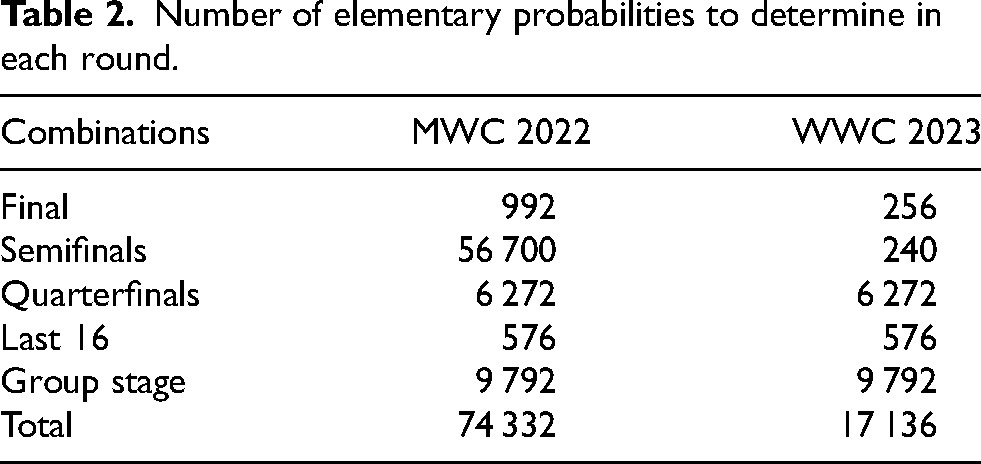
Indeed, this is confirmed by computational experiments in which we ran tournament simulations with the same match outcome models from Section Single-match outcome probabilities. The accuracy of probabilities obtained from relative frequencies is assessed against the actual probabilities as determined with our algorithm, and results are shown in Figure 4. As is to be expected, approximation quality improves with the number of simulation runs. When our implementation of the exact algorithm finishes (cf. Appendix A), the maximum error in a probability estimate is still around
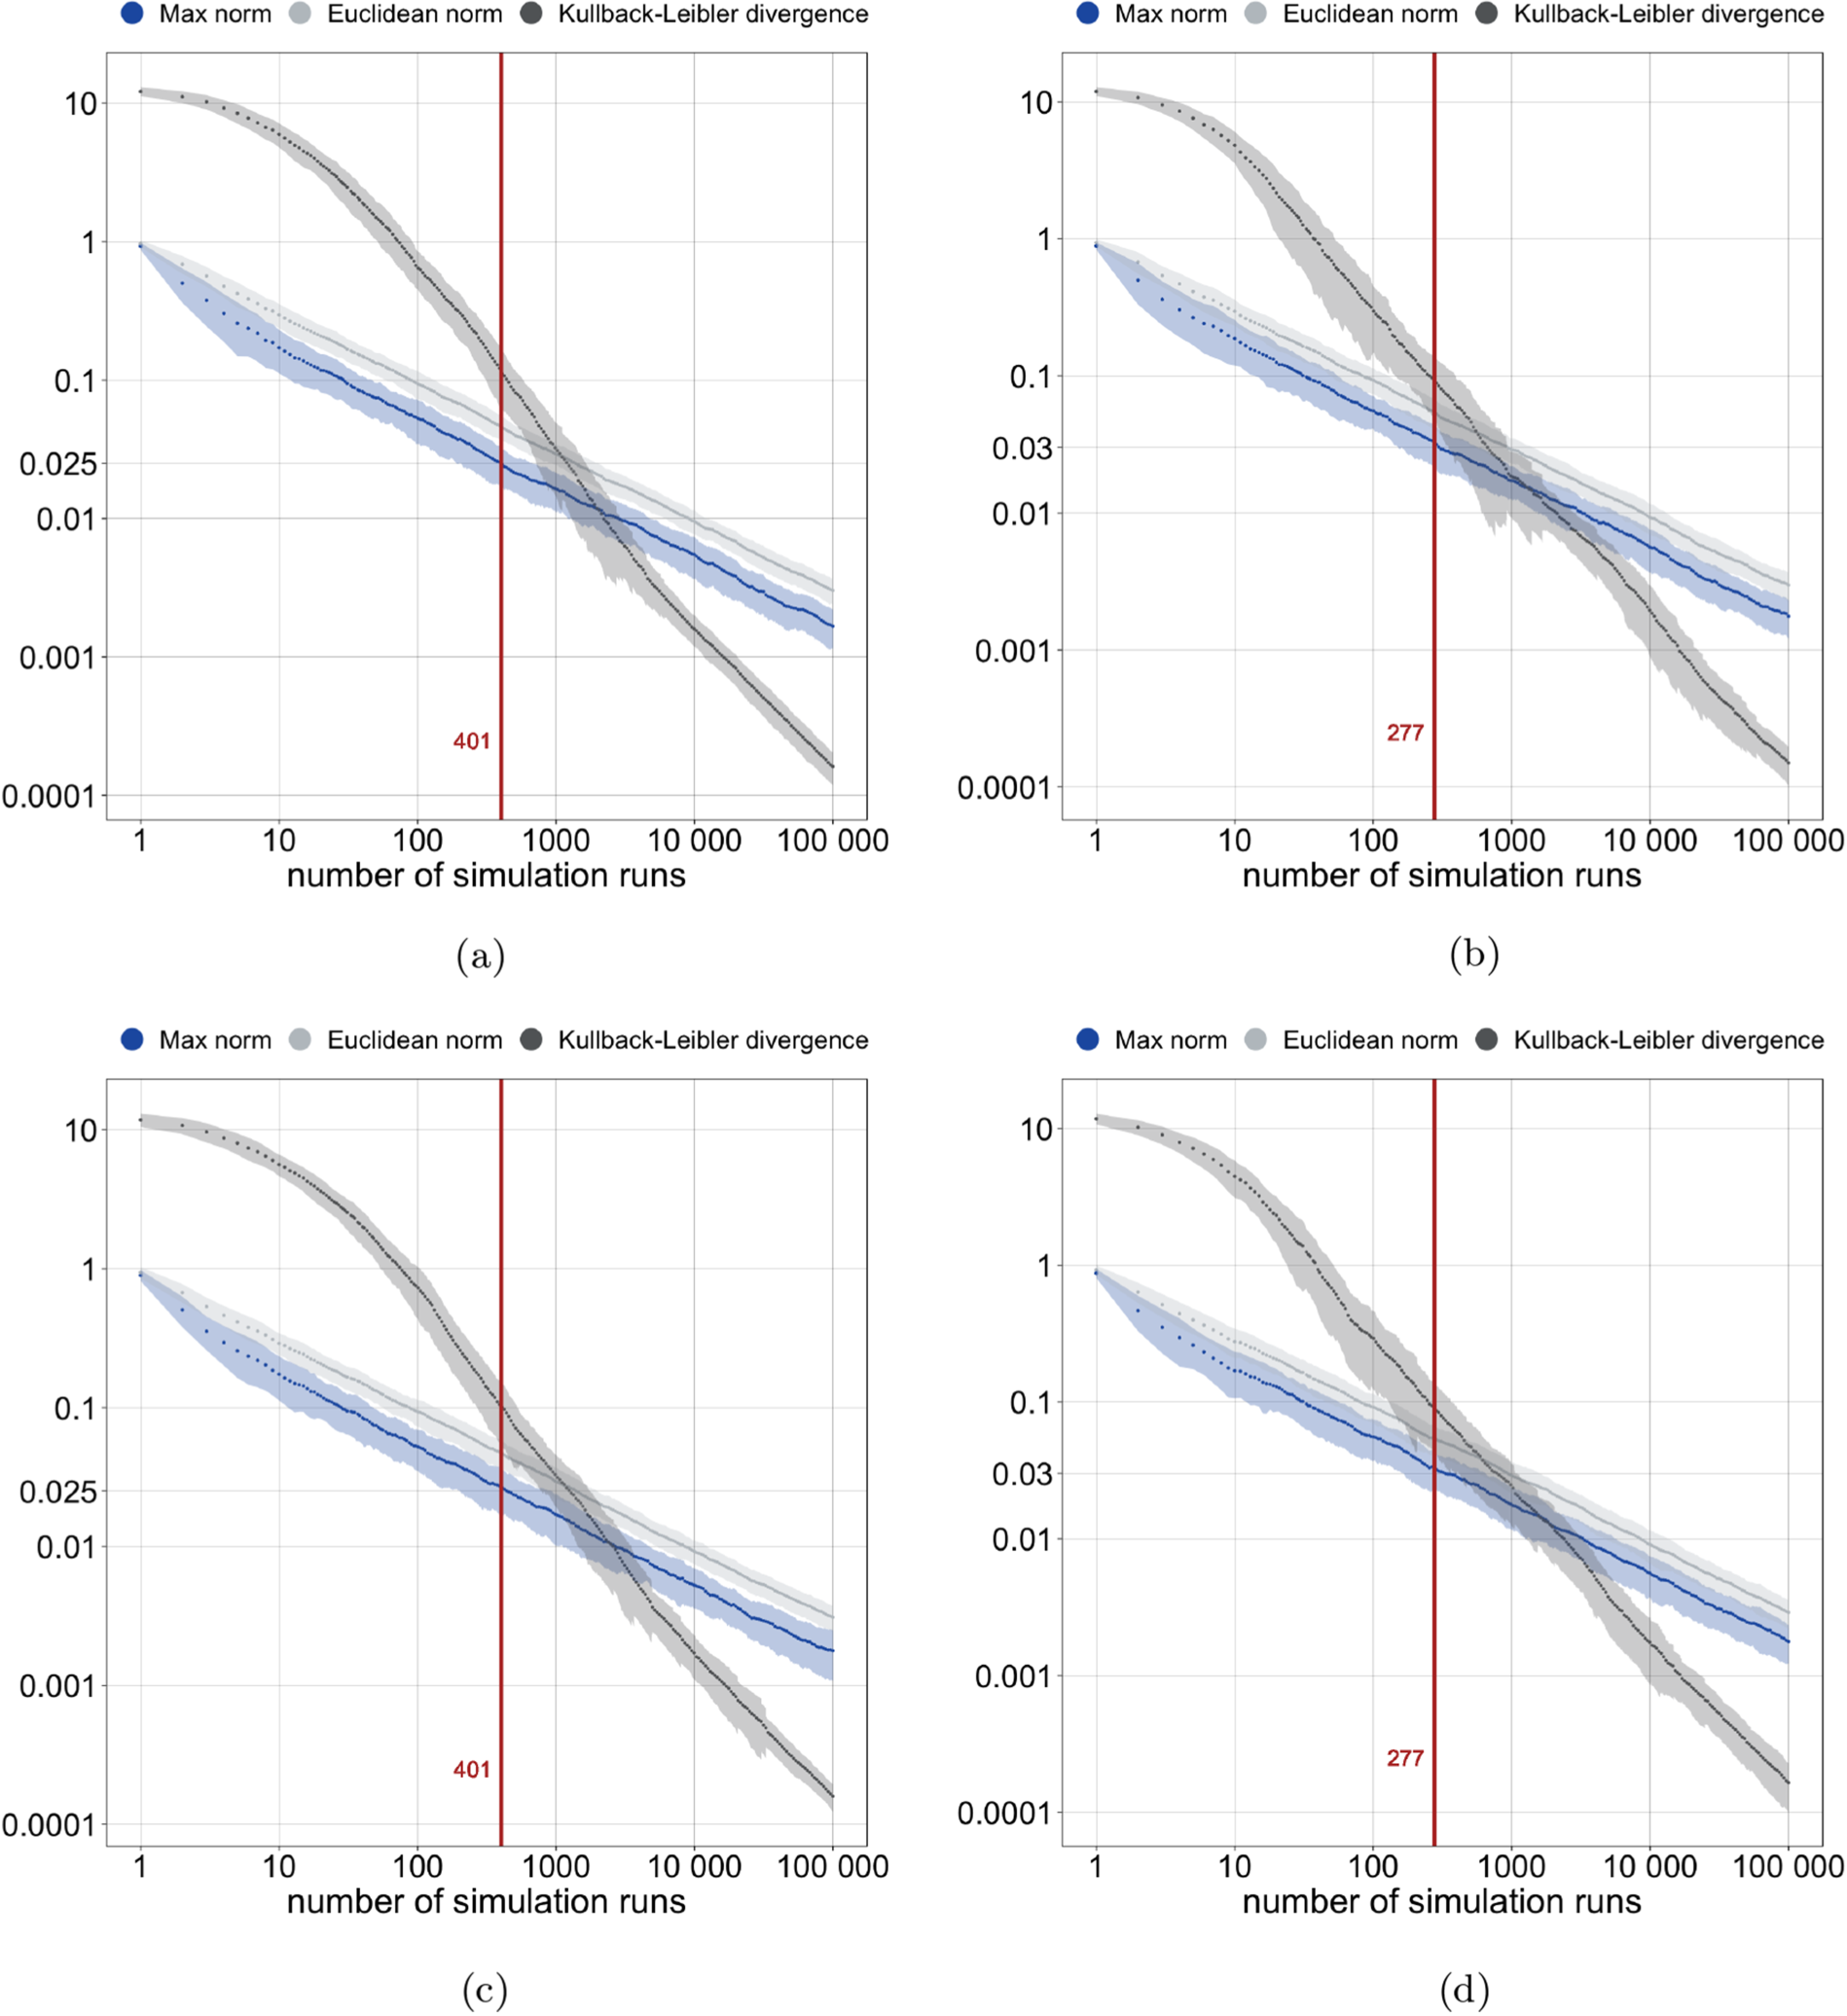
Approximation error in probability estimates obtained from relative frequencies in simulated tournaments (log-log scale). For 100 independent trials, the mean and
FIFA Men's World Cup 2022
We list probabilities of teams reaching various rounds conditional on the two models from Section Single-match outcome probabilities in Figures 5 and 6.
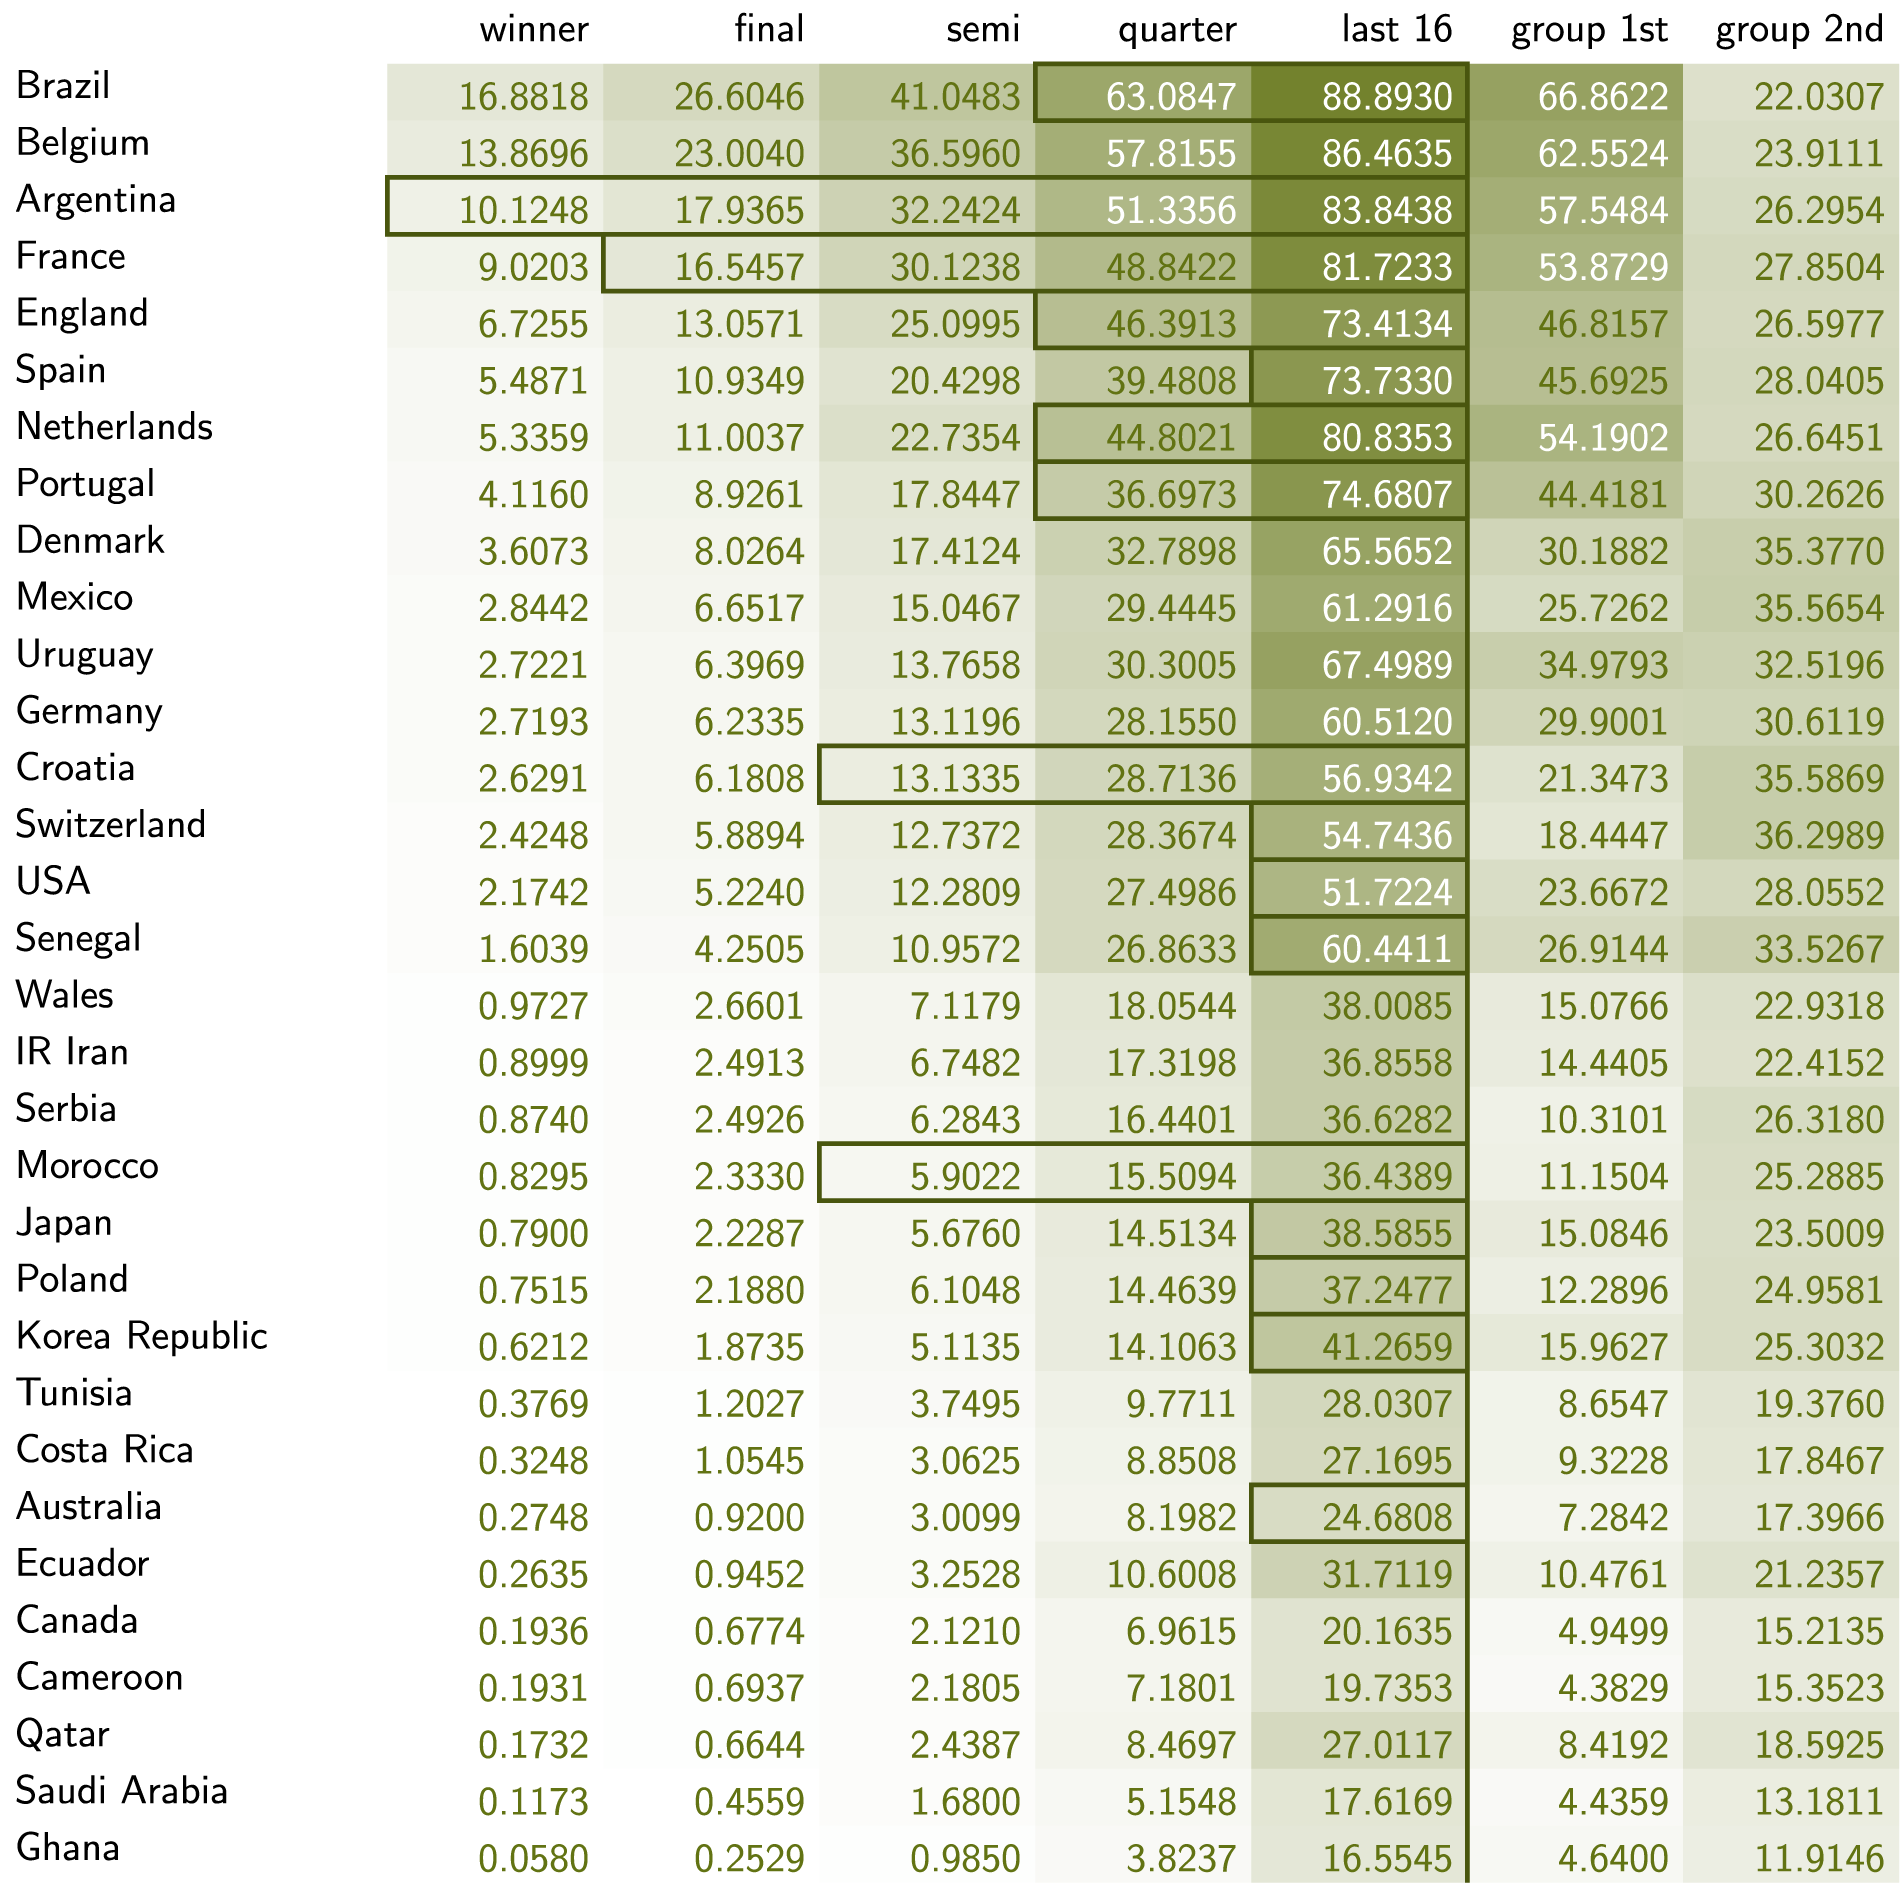
FIFA Men's World Cup 2022 probabilities in percentages (Model 1). Rectangles indicate how far teams actually progressed beyond the group stage.
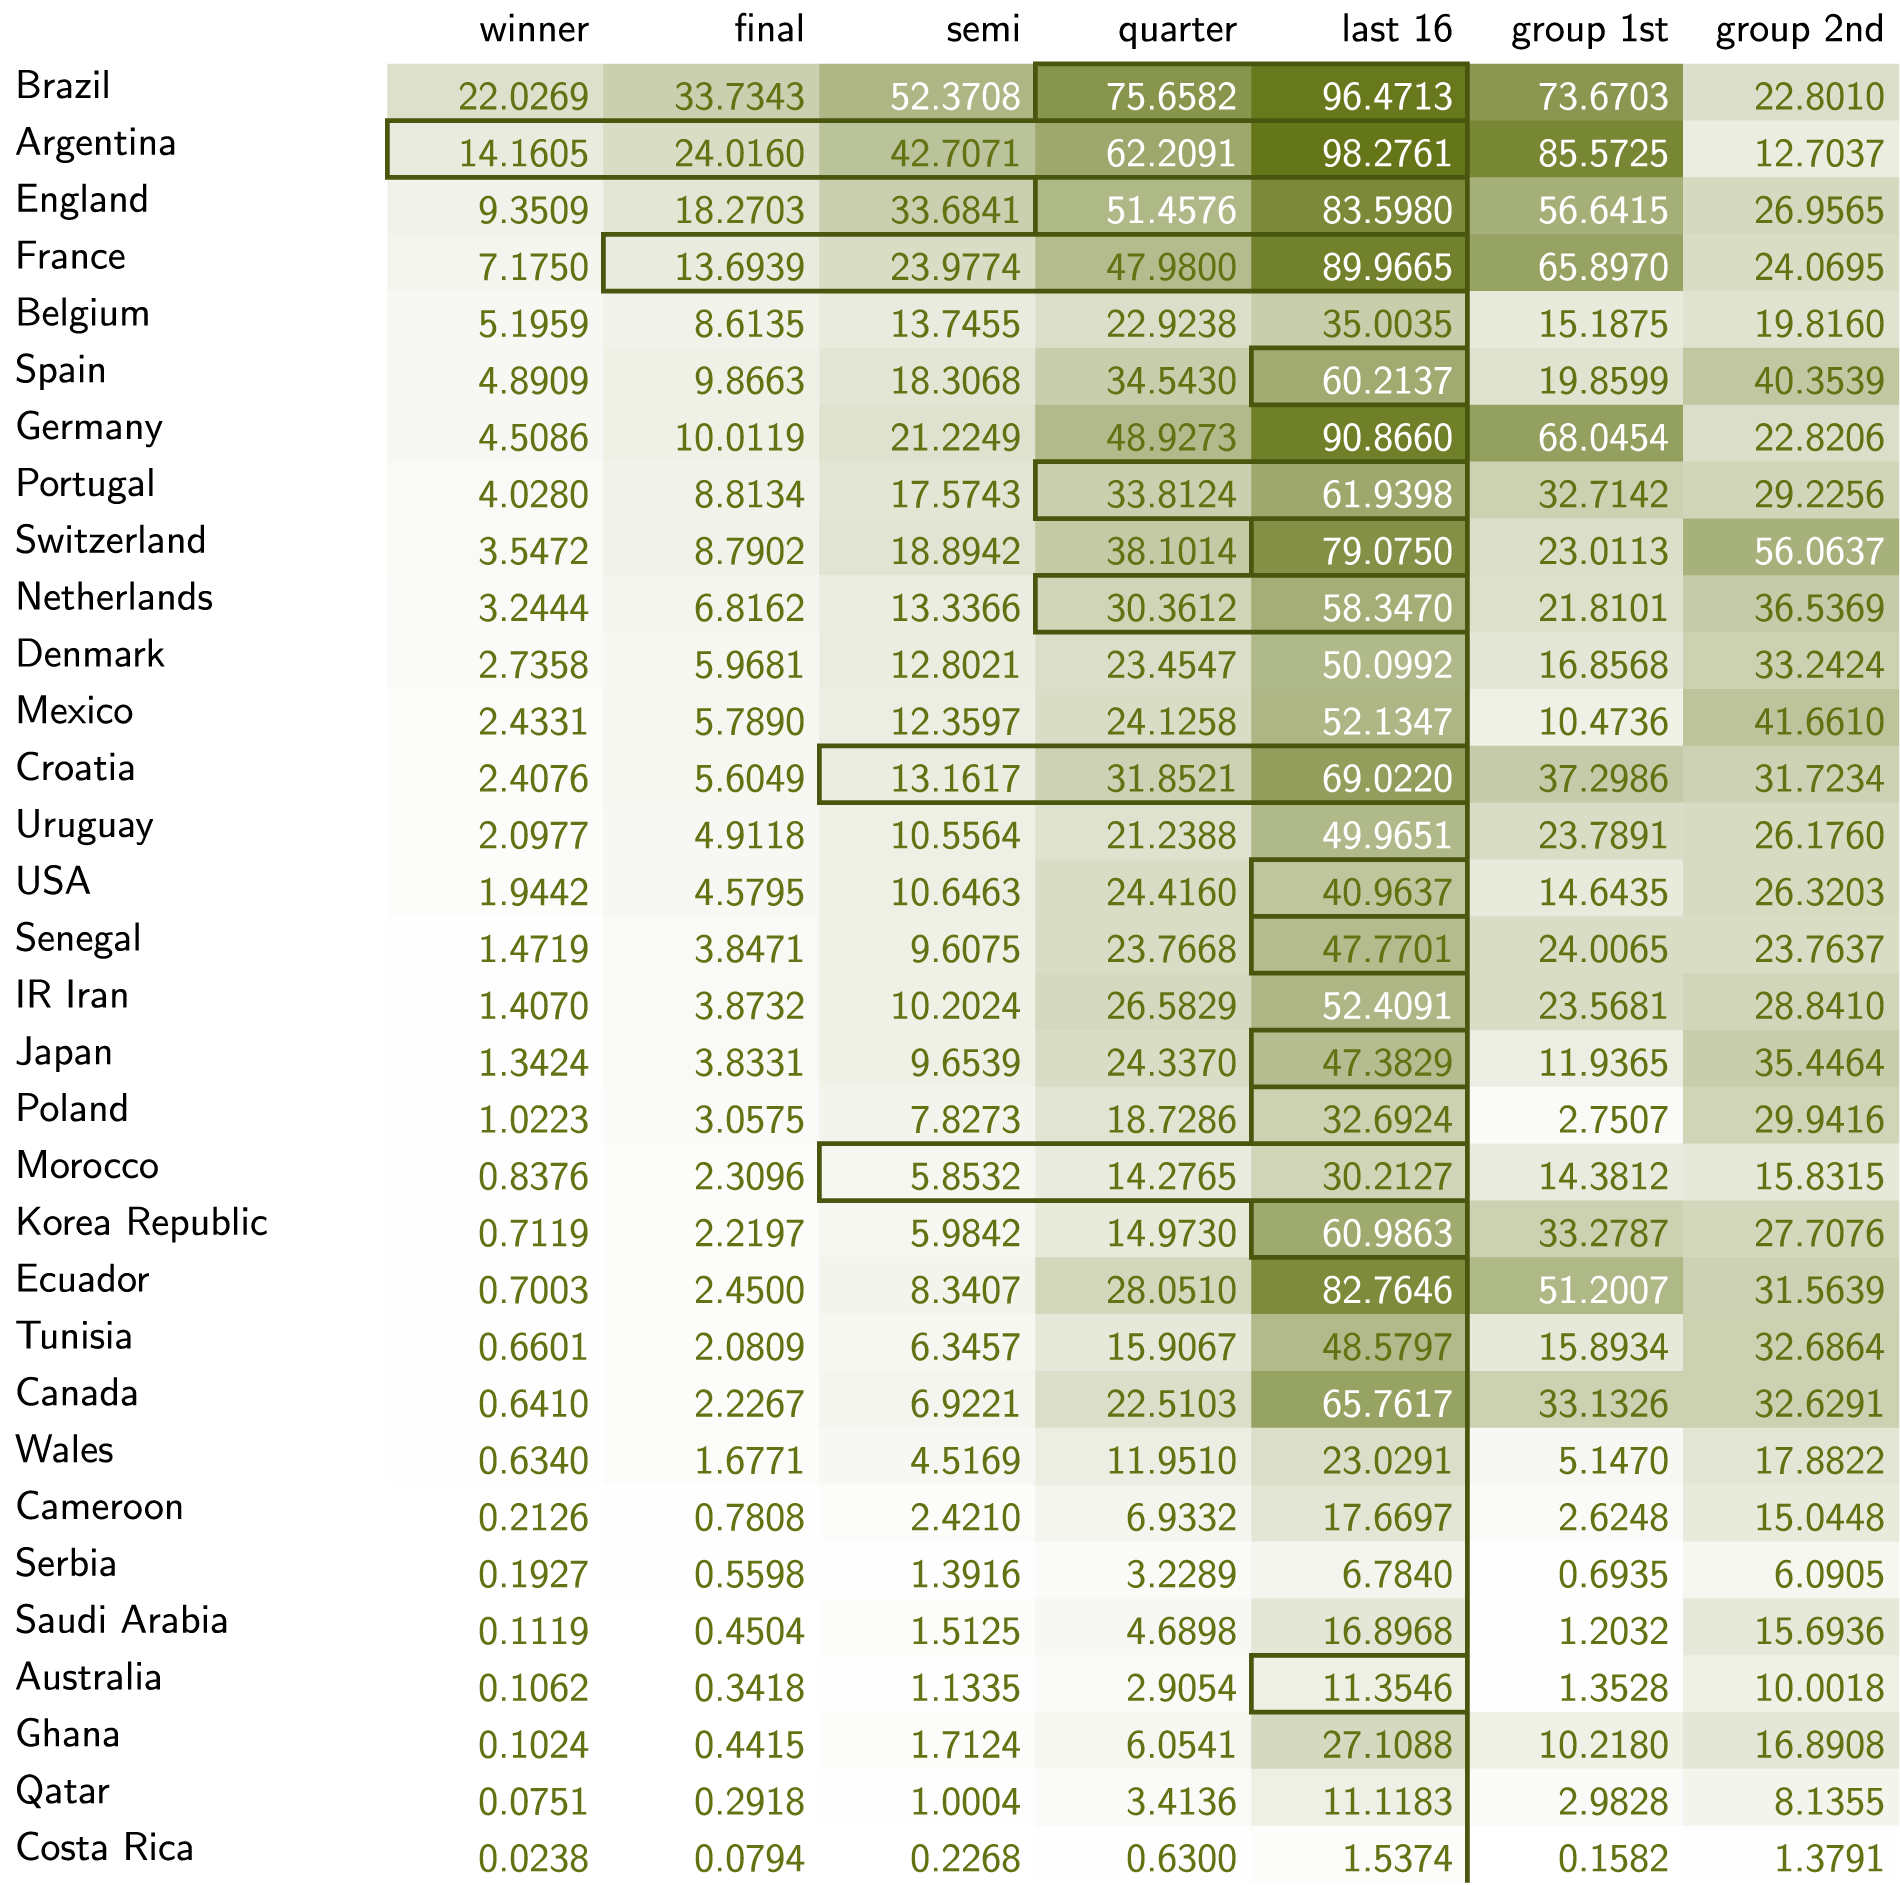
FIFA Mens' World Cup 2022 probabilities in percentages (Model 2). Rectangles indicate how far teams actually progressed beyond the group stage.
Since Model 1 favors teams with higher pre-tournament ratings, tournament winning probabilities are generally monotone in ratings. Where they are not, this indicates imbalances in group composition and path to victory. Uruguay, for instance, have a lower rating (1639) than Croatia (1645), but a much higher probability of advancing to the knockout stage (67% vs. 57%), and this advantage is maintained throughout.
Comparison with the probabilities obtained from Model 2 suggests differences in what could be expected from a team and how they performed in the matches they actually played. The probability of Belgium advancing in the knockout stage is high based on their FIFA rating (86%), but drops by an incredible 51 percentage points when considering the chances they (and all other teams in the group) created.
Another curious case is Germany, who enter the tournament with a rating that suggest they have a 60% chance of advancing to the knockout stage. The performances of all teams in the group increase chances for this outcome even further to comfortable 91%, but they are still eliminated. As depicted in Table 3, surprise group winners Japan were more successful than the chances they created would suggest.
Probabilities of pairs of teams advancing based on chances created (Model 2).
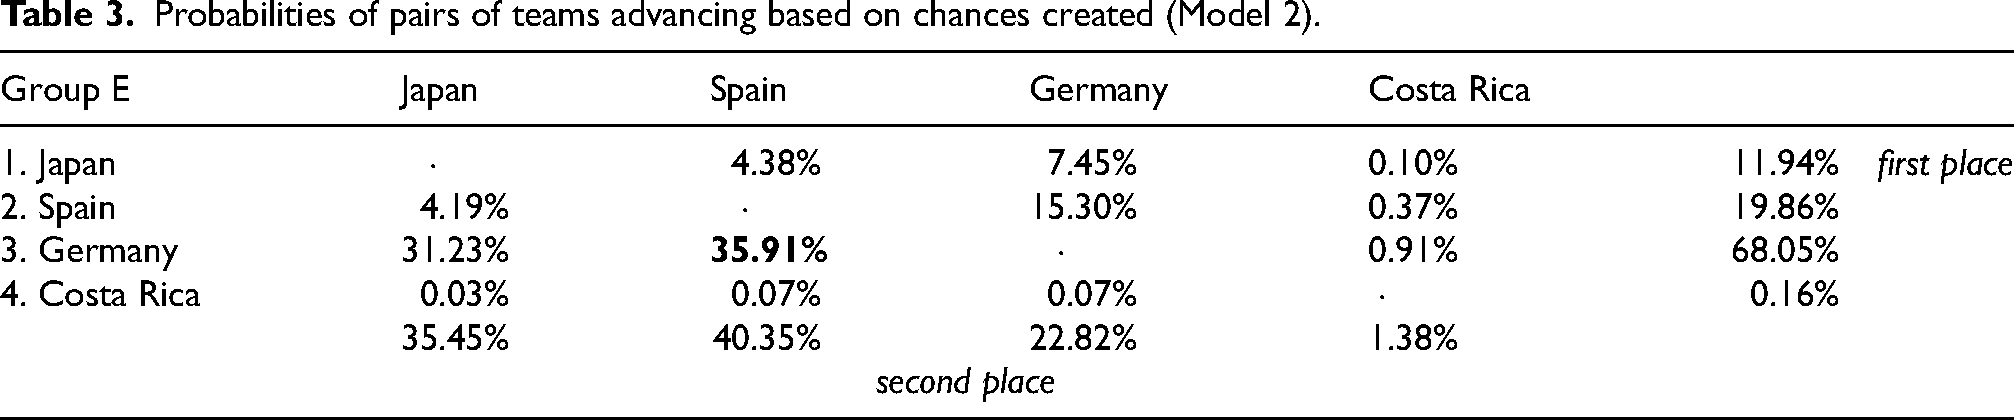
This should also be seen as a reminder of the effect probable outcomes have on subsequent predictions. Probabilities obtained from Model 1, and even more so from Model 2, are calculated with a strong weight on cases that have Germany on one of the trajectories leading out of Group E. Our approach can be used to calculate various hypothetical or counter-factual conditional probabilities fast.
FIFA Women's World Cup 2023
We list probabilities of teams reaching various rounds conditional on the two models from Section Single-match outcome probabilities in Figures 7 and 8.
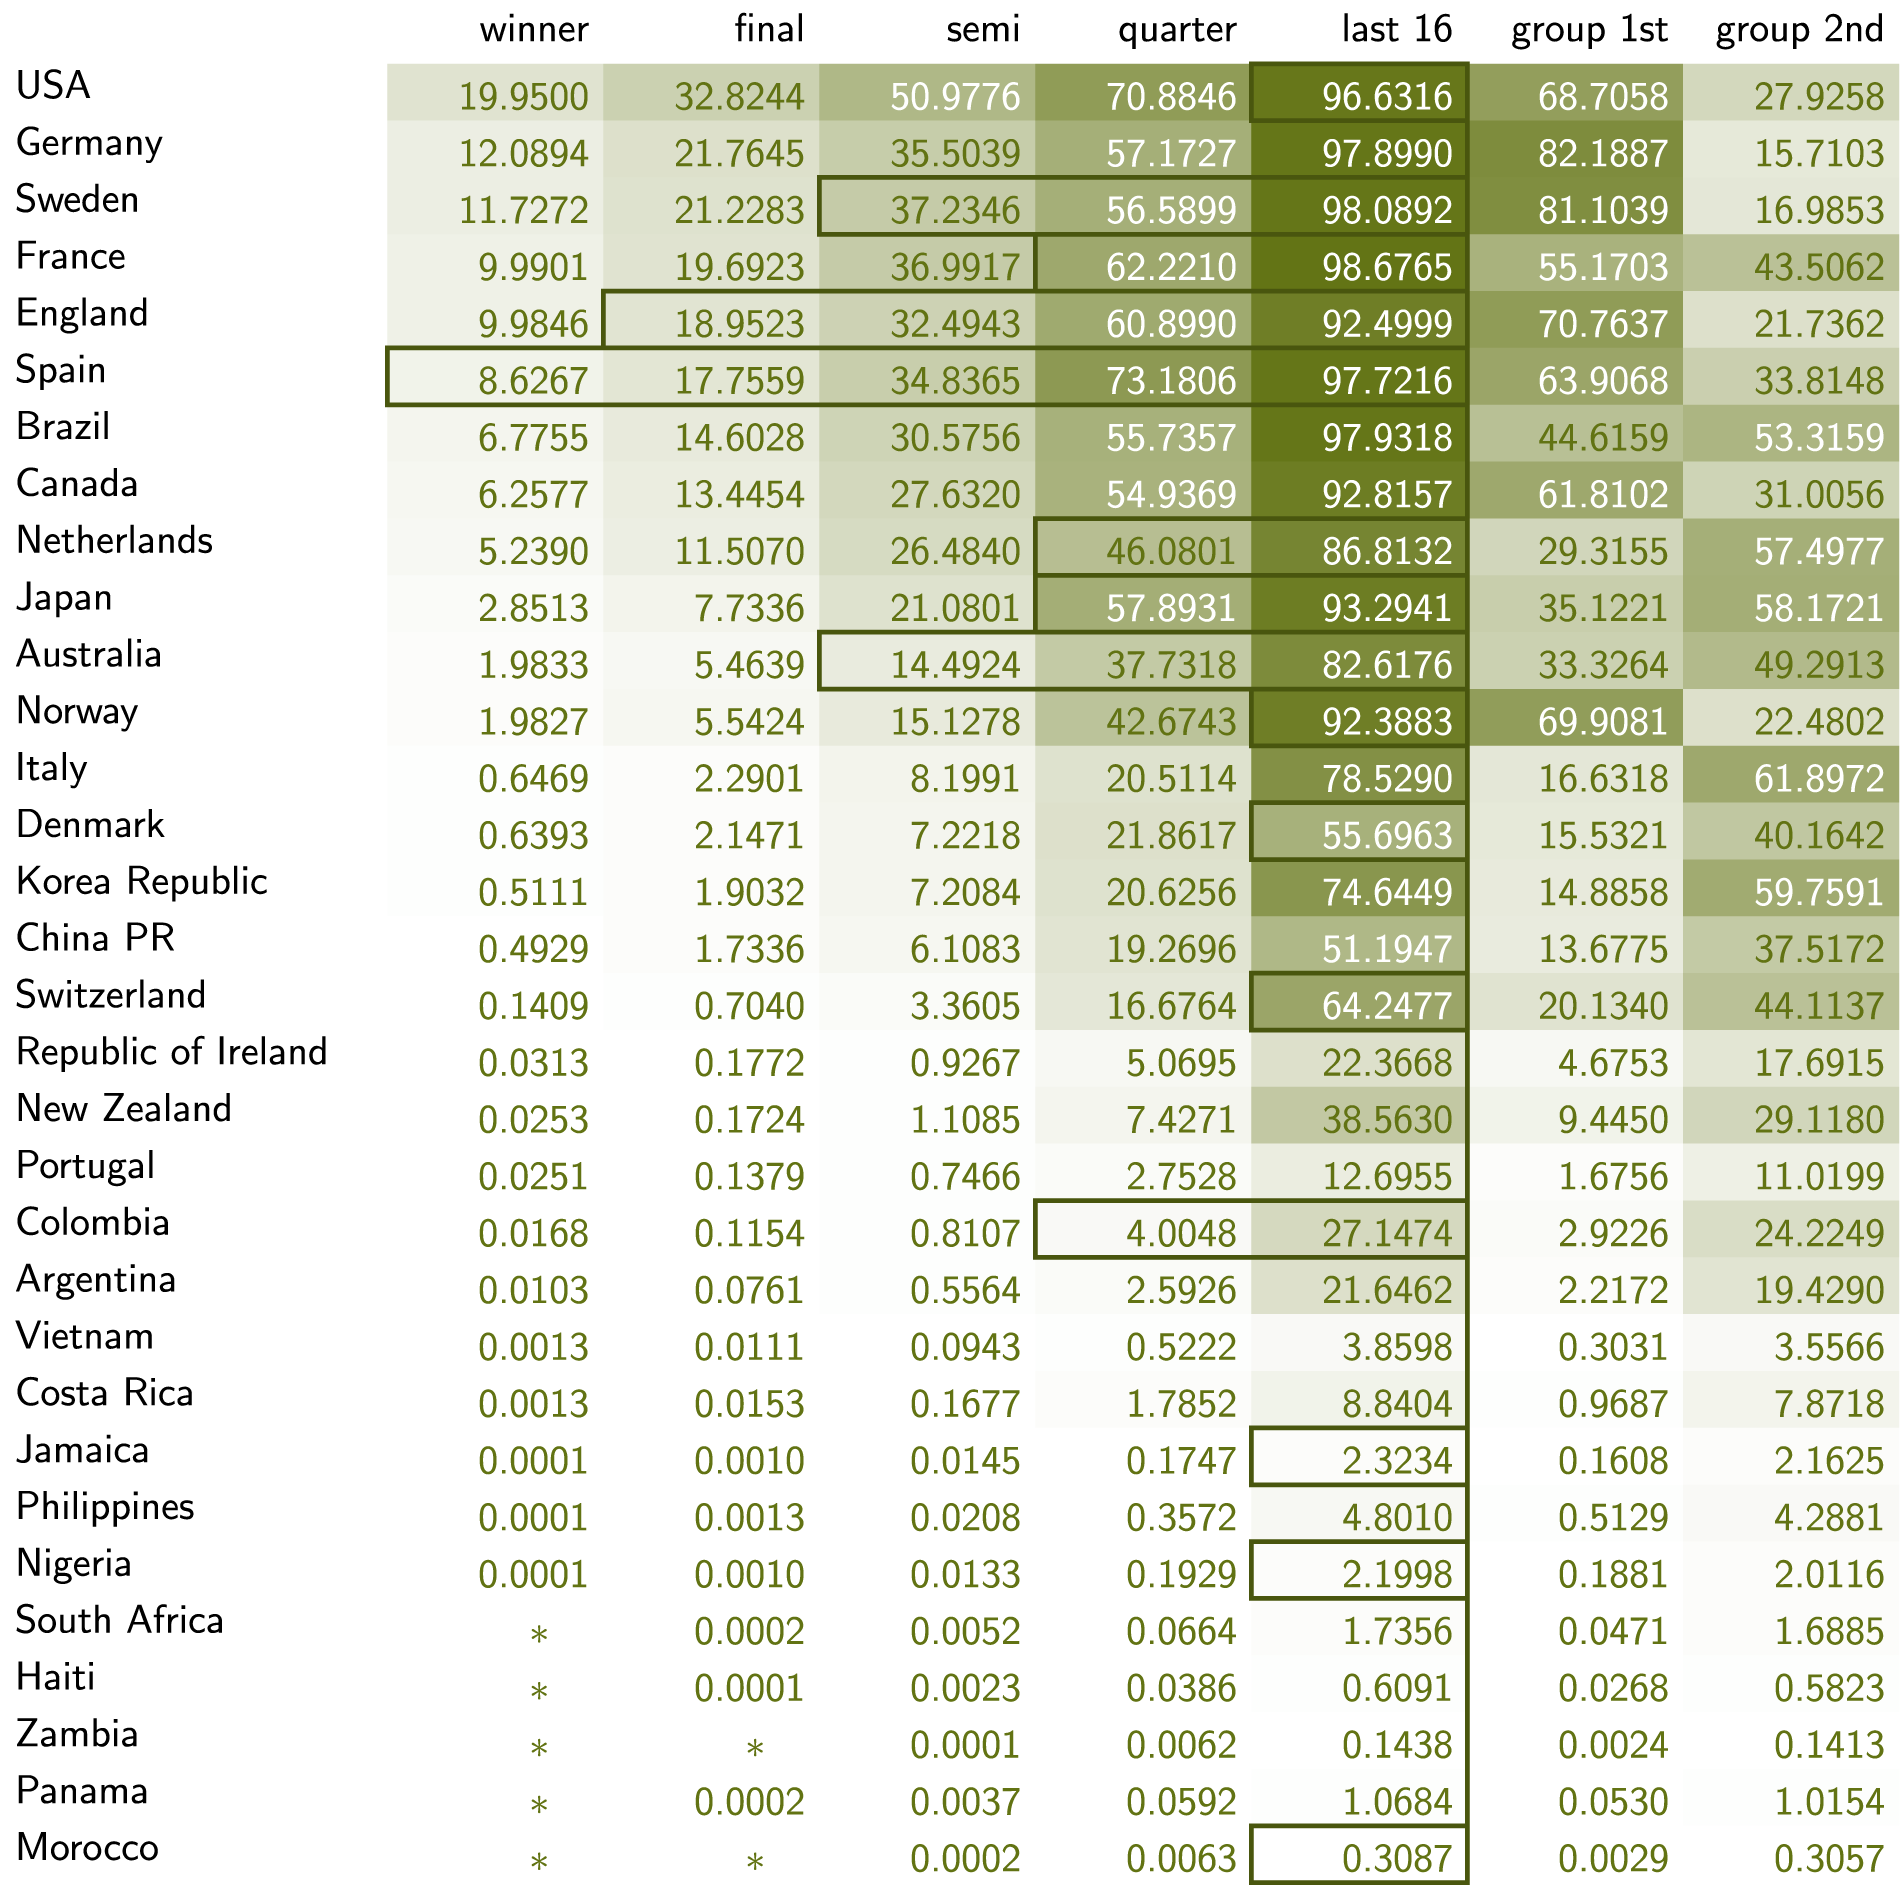
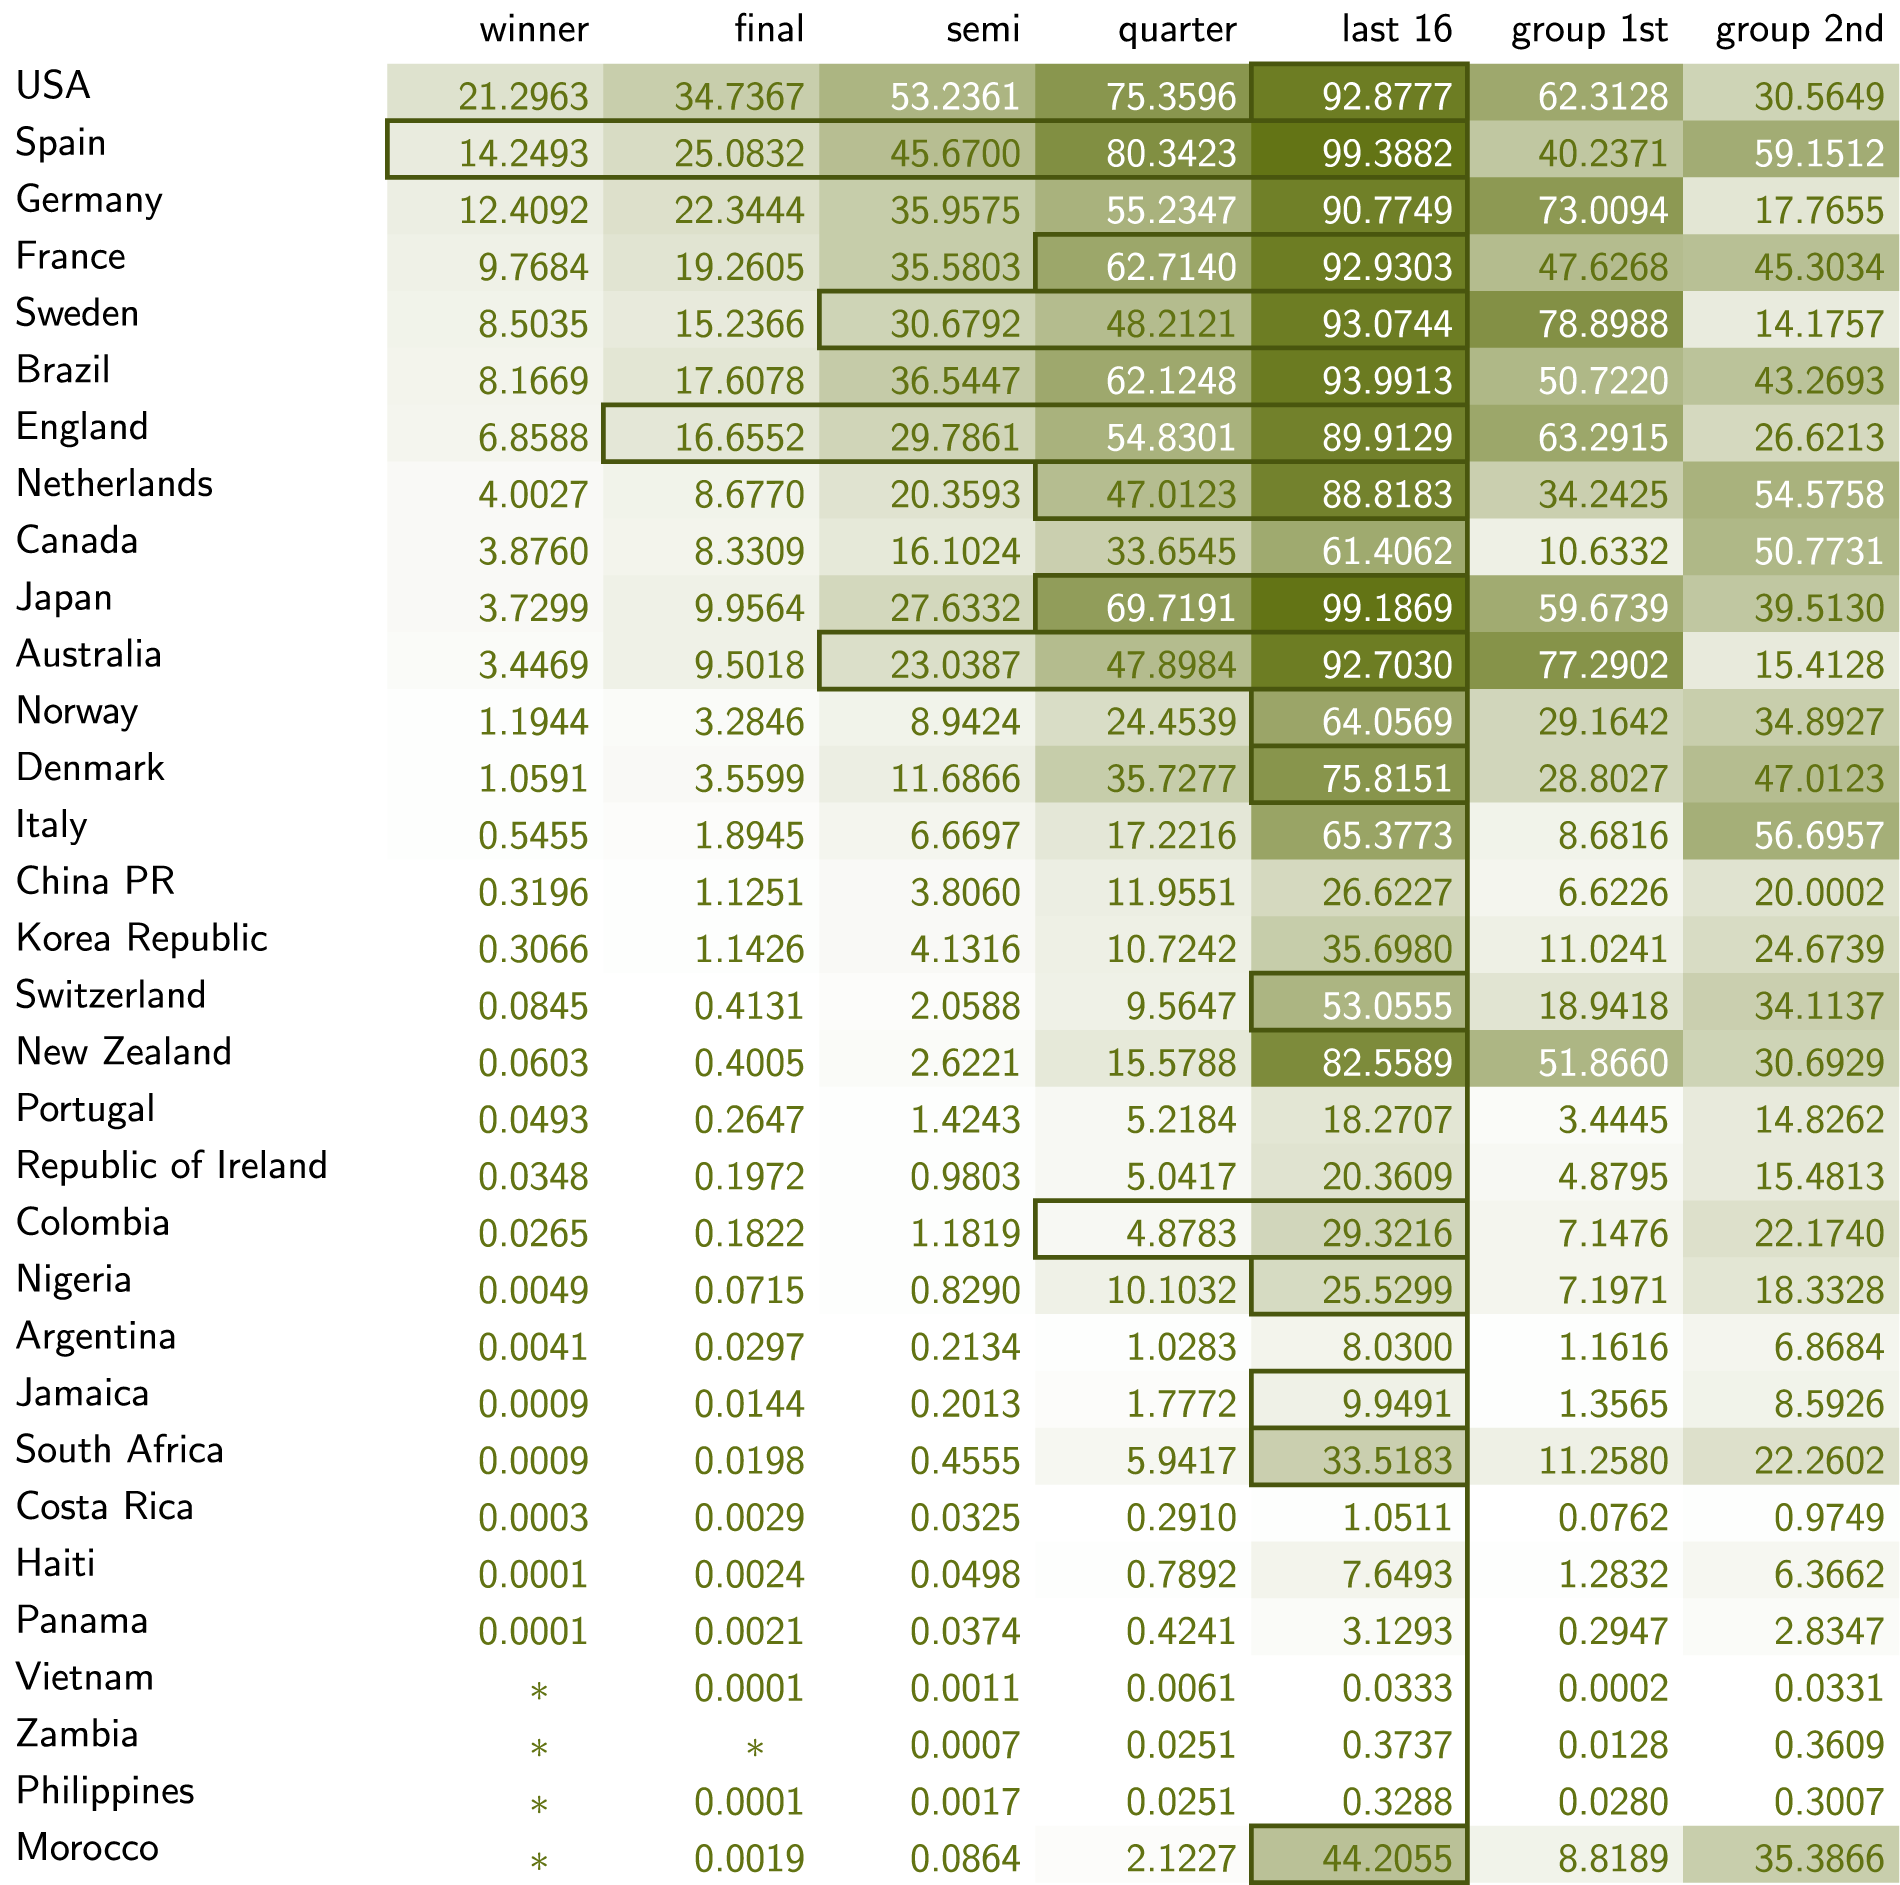
FIFA Women’s World Cup 2023 probabilities in percentages (Model 1). Rectangles indicate how far teams actually progressed beyond the group stage. Percentages shown as
FIFA Women’s World Cup 2023 probabilities in percentages (Model 2). Rectangles indicate how far teams actually progressed beyond the group stage. Percentages shown as
There are similar observations to be made when comparing the two models. For instance, co-hosts New Zealand have played to increase their chances of advancing to the knockout stage, but the results did not follow suit. A different observation can be made for the USA, who ended up a less likely second in their group thanks to two draws and therefore faced another top-rated team, Sweden, already in the first knockout round, a match that was decided by the finest of margins in favor of Sweden. Even with the opposite outcome, this rather unlikely fixture would end the trajectory of one high-probability team.
The difficulty of approximating small probabilities with Monte Carlo simulation is best illustrated by another example. Morocco entered the tournament with tiny chances to make it out of the group stage (according to Model 1), but played well and had the other matches go their way (according to Model 2), so that they actually advanced. Based on Model 1 and our extension to the entire tournament, the probability of this happening was around 0.3087%. In
Conclusion
We have shown how to exploit limited mixing in sports tournament brackets to compute winning probabilities exactly. The computation is independent of the model used for single-match outcomes, and for the current FIFA World Cup schedules it is two orders of magnitude faster than any reasonably accurate approximation through tournament simulation.
Computational efficiency and precision are relevant in the assessment of tournament-level consequences of differences in single-match prediction models and their parameterization. It may therefore prove useful in sensitivity studies, advance planning, and counter-factual analyses. The algorithm can also be re-run on partial tournaments by setting the probabilities of known or hypothetical outcomes to
Our approach depends on small group size (to allow for complete enumeration of outcome sequences) and limited mixing of subtrees in the elimination rounds (restricting the number of possible fixtures).
The UEFA Men’s EURO tournaments are currently played with
Fixtures for
No such complications arise for the UEFA Women’s EURO 2025 (Figure 10), where the fixtures for
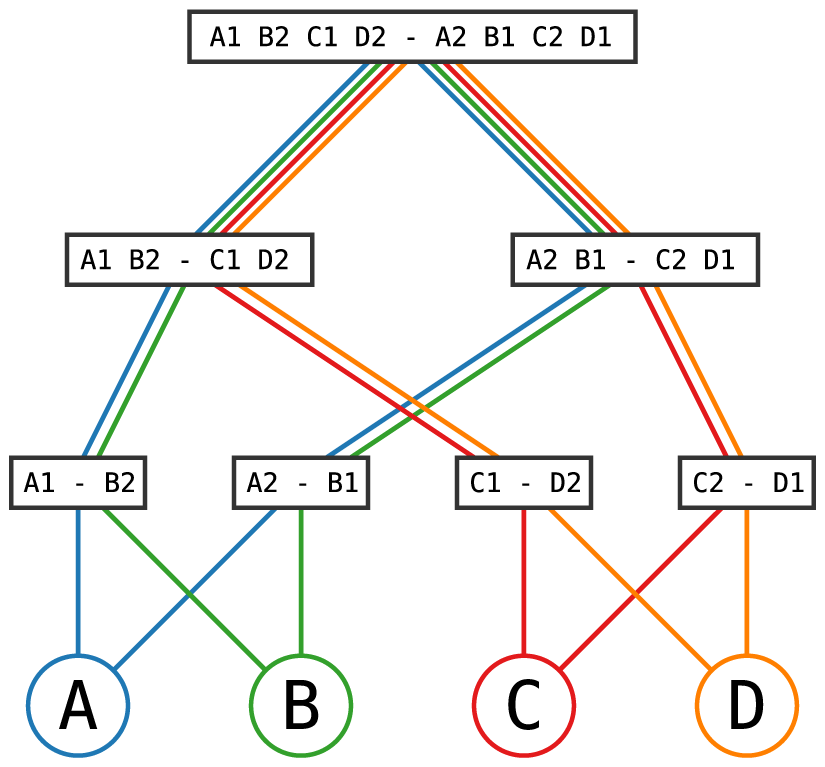
Fixtures for
The FIFA Men’s World Cup 2026 will have
Our approach does generalize well to tournament settings in which two teams advance from an even number of groups to a knockout stage with mixing confined to neighboring subtrees. This includes tournaments with
Footnotes
Funding
The author(s) received no financial support for the research, authorship, and/or publication of this article.
Declaration of conflicting interests
The authors declared no potential conflicts of interest with respect to the research, authorship, and publication of this article.