
Abstract
Injuries have a large impact on a team’s success during the season. Typically teams with more injuries, especially those affecting the most valuable players, will perform worse than similar teams with fewer injuries. A common way to quantify a team’s injury burden is by simply counting the number of injuries or games missed due to injury. However, these measures do not account for the individual value of the players injured. We assess two frameworks for how injuries may be weighted by player value. We propose a new position-weighted metric based on franchise tag values to measure injury burden in American football, called weighted Adjusted Games Lost (wAGL), and we test another player-level metric, Wins Above Replacement-Adjusted Injuries Lost (WAIL). WAIL uses a proprietary calculation of player Wins Above Replacement from Pro Football Focus. By comparing these measures to a gold standard of injury burden using pre- versus end-season betting lines and team strength estimates, we find that wAGL is a better measure of injury burden than current alternatives across all team-seasons considered.
Keywords
Introduction
In any team sport, a team’s health throughout the season is an important determinant of their success. This is especially true in American football and the National Football League (NFL), where injury rates are relatively high compared to other leagues (Dreyer et al., 2019).
The 2017 and 2018 Chicago Bears provide a case study. In 2017, the Bears were decimated with injuries, losing 135 games worth of starting players including key injuries to Kevin White, Leonard Floyd, Zach Miller, Willie Young, Jerrell Freeman, and Quentin Demps. They had the second most weeks lost to injury in the league. These injuries contributed to the Bears losing 5 games more than was expected of them based on their pre-season win total. They also finished with a −15.9% Defense-adjusted Value Over Average (DVOA) (Schatz, n.d.), a metric created by Football Outsiders to measure team strength based on descriptive characteristics, which the Bears ranked 25th out of the 32 NFL teams. The following season, the Bears only lost 34 weeks worth of starting players to injury, with the biggest injuries to Dion Sims and Kyle Long. They had the 29th most injuries in the league and won 12 games, which was 5 wins above their preseason win total (the biggest positive residual of the season). They also finished fifth in DVOA.
Much of the literature in sports injuries simply counts the number of injuries or games missed due to injury a team suffers (Dvorak and Junge, 2000). For example, a study on women’s soccer in the 2005 European Championship found that teams with a higher percentage of injured players were more likely to be eliminated in the group stage (Waldén et al., 2007). Another study on Iceland’s two highest divisions of soccer in 1999 found a relationship between the number of days players were injured on a team and the final rankings at the end of the season (Arnason et al., 2004). A study on Qatari professional soccer correlated the number of injuries per 1000 hours of exposure with various team performance metrics, again treating all players of equal value (Eirale et al., 2013). American football has also seen similar research: one such study investigated the association between the number of games missed by offensive and defensive starters and wins in the 2010–19 NFL seasons (LaPlaca and Elliott, 2021).
Simple counts of injuries are appropriate for research questions about the descriptive epidemiology of injuries or investigating their causes. However, not every player has the same value to a team (Eager and Chahrouri, 2020; Sabin, 2021). In American football, for example, losing a star quarterback is far more costly than a league-average cornerback. In the 2020 NFL season, the Dallas Cowboys lost both quarterback Dak Prescott and starting corner Chidobe Awuzie for multiple games. Given that Prescott plays the most important position in football (Eager and Chahrouri, 2020) and is highly valuable to his team (the Cowboys gave him a contract worth $40 million dollars per year before the 2020 season had started (Over The Cap, 2021)), it is highly likely that he was worth more to his team’s success than Awuzie (who was paid $1.3 million dollars by the Cowboys in 2020). Counting injuries or games lost treats all players the same and would count both Prescott and Awuzie equally, which may be inappropriate.
It follows, then, that not all injuries will have the same effect on a team. For research questions about the cost or burden of injuries to a team analyses should weight injuries based on player value (Eager and Chahrouri, 2020; Sabin, 2021).
Some metrics have been developed that attempt to crudely account for the value of players when calculating the level of injury burden a team faces over the course of an NFL season. Football Outsiders’ Adjusted Games Lost (AGL), for example (Verhei, 2019), adjusts the weightings of active players who appeared on their team’s injury reports prior to playing to account for an anticipated decrease in effectiveness while playing hurt. However, it weights all positions as well as starters, replacement starters, and situational players equally while excluding bench and reserve players.
In this paper we assess two potential metrics to measure injury burden which better incorporate player value: one position-weighted using franchise tag salary values (weighted Adjusted Games Lost, wAGL) and one player-weighted (Wins Above Replacement-Adjusted Injuries Lost, WAIL). wAGL and WAIL modify AGL by applying positional and player-specific weights, respectively, to injuries and by accounting for bench and reserve players.
We investigate whether these weighting methods provide a better measure of injury burden by comparing how well weighted and unweighted metrics correlate with differences in team strength from the start to the end of the season.
The paper is organized as follows. In “Methodology” we review how AGL is calculated and introduce our metrics, wAGL and WAIL, as well as our method to evaluate how well these measure injury burden. We present the results of this evaluation in “Results”. In “Discussion” we summarize our conclusions, limitations and future directions.
Methodology
We used data from the 2015-2019 NFL seasons. We did not analyze 2020-2021 because they were impacted by the COVID-19 pandemic. We excluded years before 2015 because injury reporting may have been less reliable in earlier years - specifically, reported injury numbers have steadily increased over time, at least partly due to better reporting (Binney, 2015; Spratt, 2022).
AGL
AGL is a measure of injury burden for NFL teams created by Football Outsiders. To calculate AGL, we used regular season injury data from the Football Outsiders’ injury database, which has prospectively collected data from public NFL injury reports since 2007 supplemented with details on injuries from media reports or team and athlete statements where available.
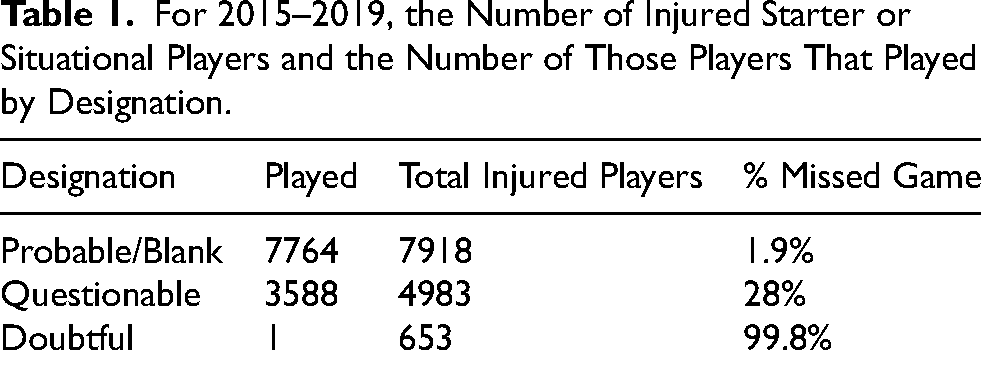
AGL is calculated for a team by first counting the number of players designated as starters or situational players (such as a pass rushing specialist on the defensive line) listed as out on the game status report or on injured reserve. They are simply counted up because the probability of such players missing the next game is 100% or 1. Then added to this, for each starter or situational player who was listed on the injury report with a different game status, is a partial number between 0 and 1 depending on the probability that player misses that game based on their game status report designation (Probable (before 2016) or blank (2016 and later), Questionable, or Doubtful to play), regardless of whether they actually played or not. Players not designated as starters or situational players do not count toward this metric.
In equation form, AGL for a player p is calculated as follows:

For 2015–2019, the Number of Injured Starter or Situational Players and the Number of Those Players That Played by Designation.
For a team, AGL is the sum of AGL for all players on that team:
In our full dataset (containing the 2015–2019 NFL seasons), the 2017 LA Rams (11-5 record) had the lowest AGL (14.7) and the 2019 New York Jets (3-13 record) had the highest AGL (140). The average AGL was 59.3 with a standard deviation of 22.8. Figure 1 shows the distribution of AGL for NFL teams in 2015–2019.
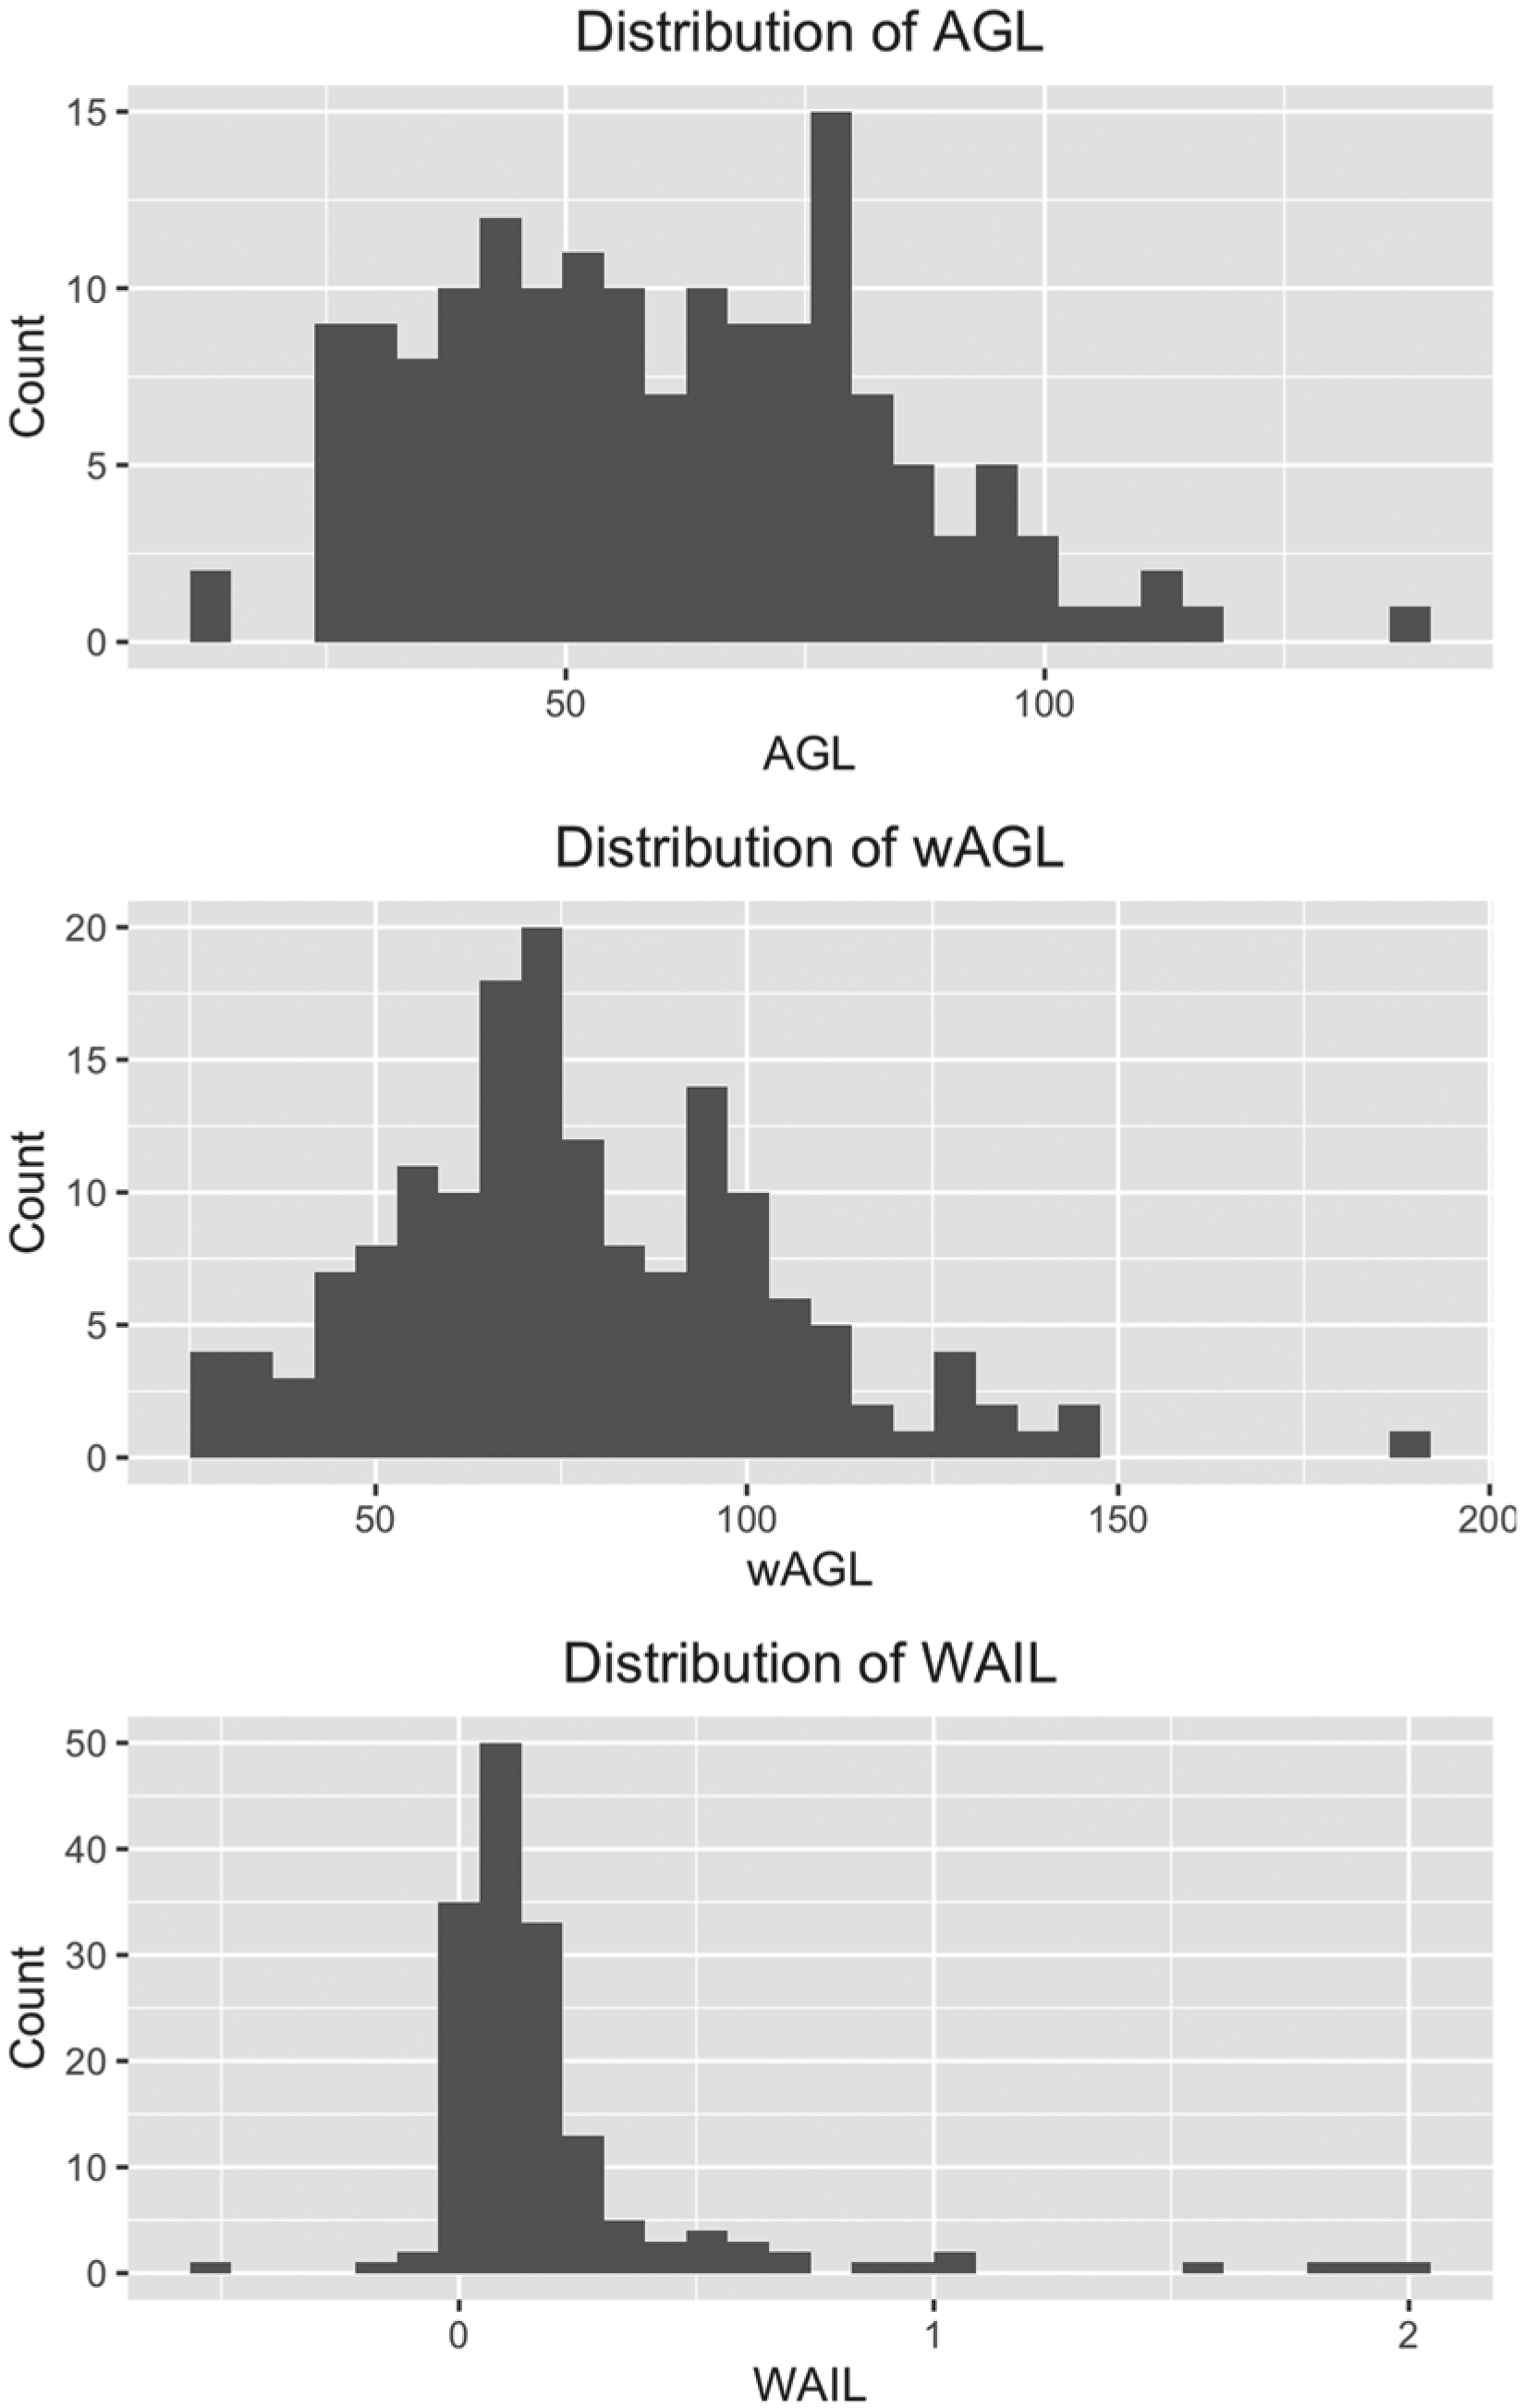
Distribution of AGL, wAGL, and WAIL for the 2015–2019 NFL seasons.
Position-based Weights: wAGL
Our new metric, wAGL, is a weighted combination of a player’s AGL with weights 
We assign
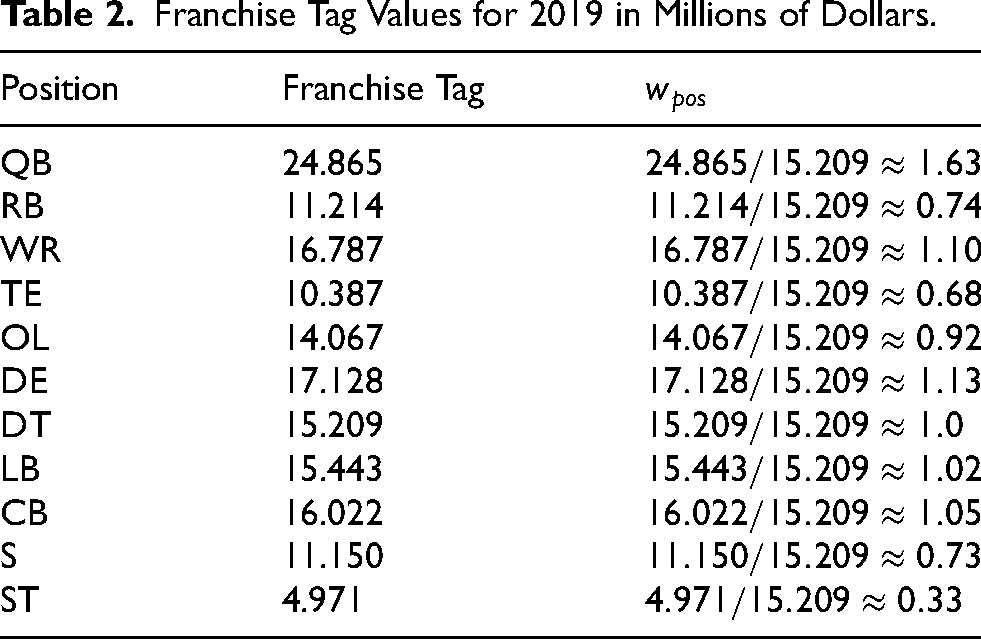
Franchise Tag Values for 2019 in Millions of Dollars.
Thus, one unit of wAGL can be interpreted as one starting DT missing one game due to injury. This will be on a different scale than and not directly translatable to AGL. To force wAGL and AGL onto the same scale would require dividing the franchise tag values by the average franchise tag values for the specific injuries in our data. This would not be translatable to any other dataset (e.g., another sport or other seasons in the NFL) and would only allow one unit of wAGL to be interpreted as one game missed by the average injured player in our dataset.
In our full dataset (containing the 2015–2019 NFL seasons), the 2017 LA Rams (11-5 record) had the lowest wAGL (27.5) and the 2019 New York Jets (3-13 record) had the highest wAGL (188.9). The average wAGL was 77.7 with a standard deviation of 26.5. Figure 1 shows the distribution of wAGL for NFL teams in 2015–2019.
Player-based Weights: WAIL
Another potential weighting scheme utilizes Pro Football Focus’ WAR metric to implement player-weighting. WAR is a longstanding metric in baseball and was first publicly applied in football using play-by-play data to estimate wins above replacement values for quarterbacks, running backs and receivers (Yurko et al., 2019). Pro Football Focus (PFF) uses its proprietary player grades to map a player’s production to a “wins” value for his team using the relative importance of each facet of play. Then PFF simulates a team’s performance if a replacement-level player was playing in the place of the player of interest. The difference in the player of interest’s wins value and the simulated replacement-level wins value gives the player of interest’s WAR value for the season.
To determine what a player’s impact would be on their team if they were to miss a game, a rolling 16-game weighted average of their WAR has been used to project their WAR for any specific game of any season. For example, if a player were to miss Week 6 of a season due to injury, 11 games of WAR would be used from their previous season’s WAR in addition to the first 5 games of WAR from the current season. As the season continues, and there is more data on how a player is performing in the current year, the previous season’s WAR would be weighted less heavily. This weighted WAR value is called WAR-Adjusted Injuries Lost (WAIL) (Seth and Brown, 2021a; Menon, 2021).
WAIL is then multiplied by games missed to summarize the impact of WAR lost due to a player injury, then summed to the team level to estimate that team’s injury burden:
In our full dataset, the 2015 Pittsburgh Steelers (10-6 record) had the lowest WAIL (
Evaluation
Prior research has identified criteria to evaluate metrics in sports (Franks et al., 2016; Judge, 2018). While some of these criteria are not relevant (e.g., we do not expect a measure of injury burden to correlate year to year (stability / reliability)), we would expect a measure of regular season injury burden to correlate with some gold standard measure of the impact of injuries (similar to the concept of “predictiveness” (Judge, 2018)).
Therefore, to assess how well AGL, wAGL, and WAIL represent injury burden we first need a gold standard for the impact of injuries. This is difficult as the impact of injuries on a team is unobservable; it would require seeing the team’s counterfactual performance in a season in which those injuries did not occur. Instead, we propose using the inherent unpredictability of injuries in football to leverage preseason projections as a proxy for this quantity.
In-season injuries are one of the major factors preseason projections are not able to take into account due to the unpredictability of injuries, particularly in collision sports like the NFL (McCall et al., 2017). Thus, it is reasonable to assume that systematic differences in preseason projections and actual performance are in large part due to in-season injury effects (Seth and Brown, 2021b). Therefore, a measure of in-season injury burden should correlate well with the difference between actual season performance and pre-season projections.
We used two data sources for a team’s expected performance before the regular season: data on each team’s projected defense-adjusted value over average (DVOA) from Football Outsiders - a holistic measure of team performance in American football (Football Outsiders, 2020) - and preseason projected team win totals from the Westgate sports book. Actual performance was measured with end-of-season DVOA and win totals.
We define the difference in actual DVOA (

Sensitivity Analyses
Because of the substantially higher weight WAIL puts on QB injuries versus wAGL, we conducted a sensitivity analysis manually doubling the QB franchise tag weight for wAGL. Those results are included as
We also tested a different weighting scheme for wAGL using positional value weights from ESPN’s Mike Clay 1 These results are included in Appendix A.
Results
Weighted & Unweighted Injury Metrics vs. Team Performance
For
Figure 2 plots the relationship between DVOA, and AGL, wAGL, and WAIL, respectively, for each year in our data. Table 3 summarizes the correlation results.
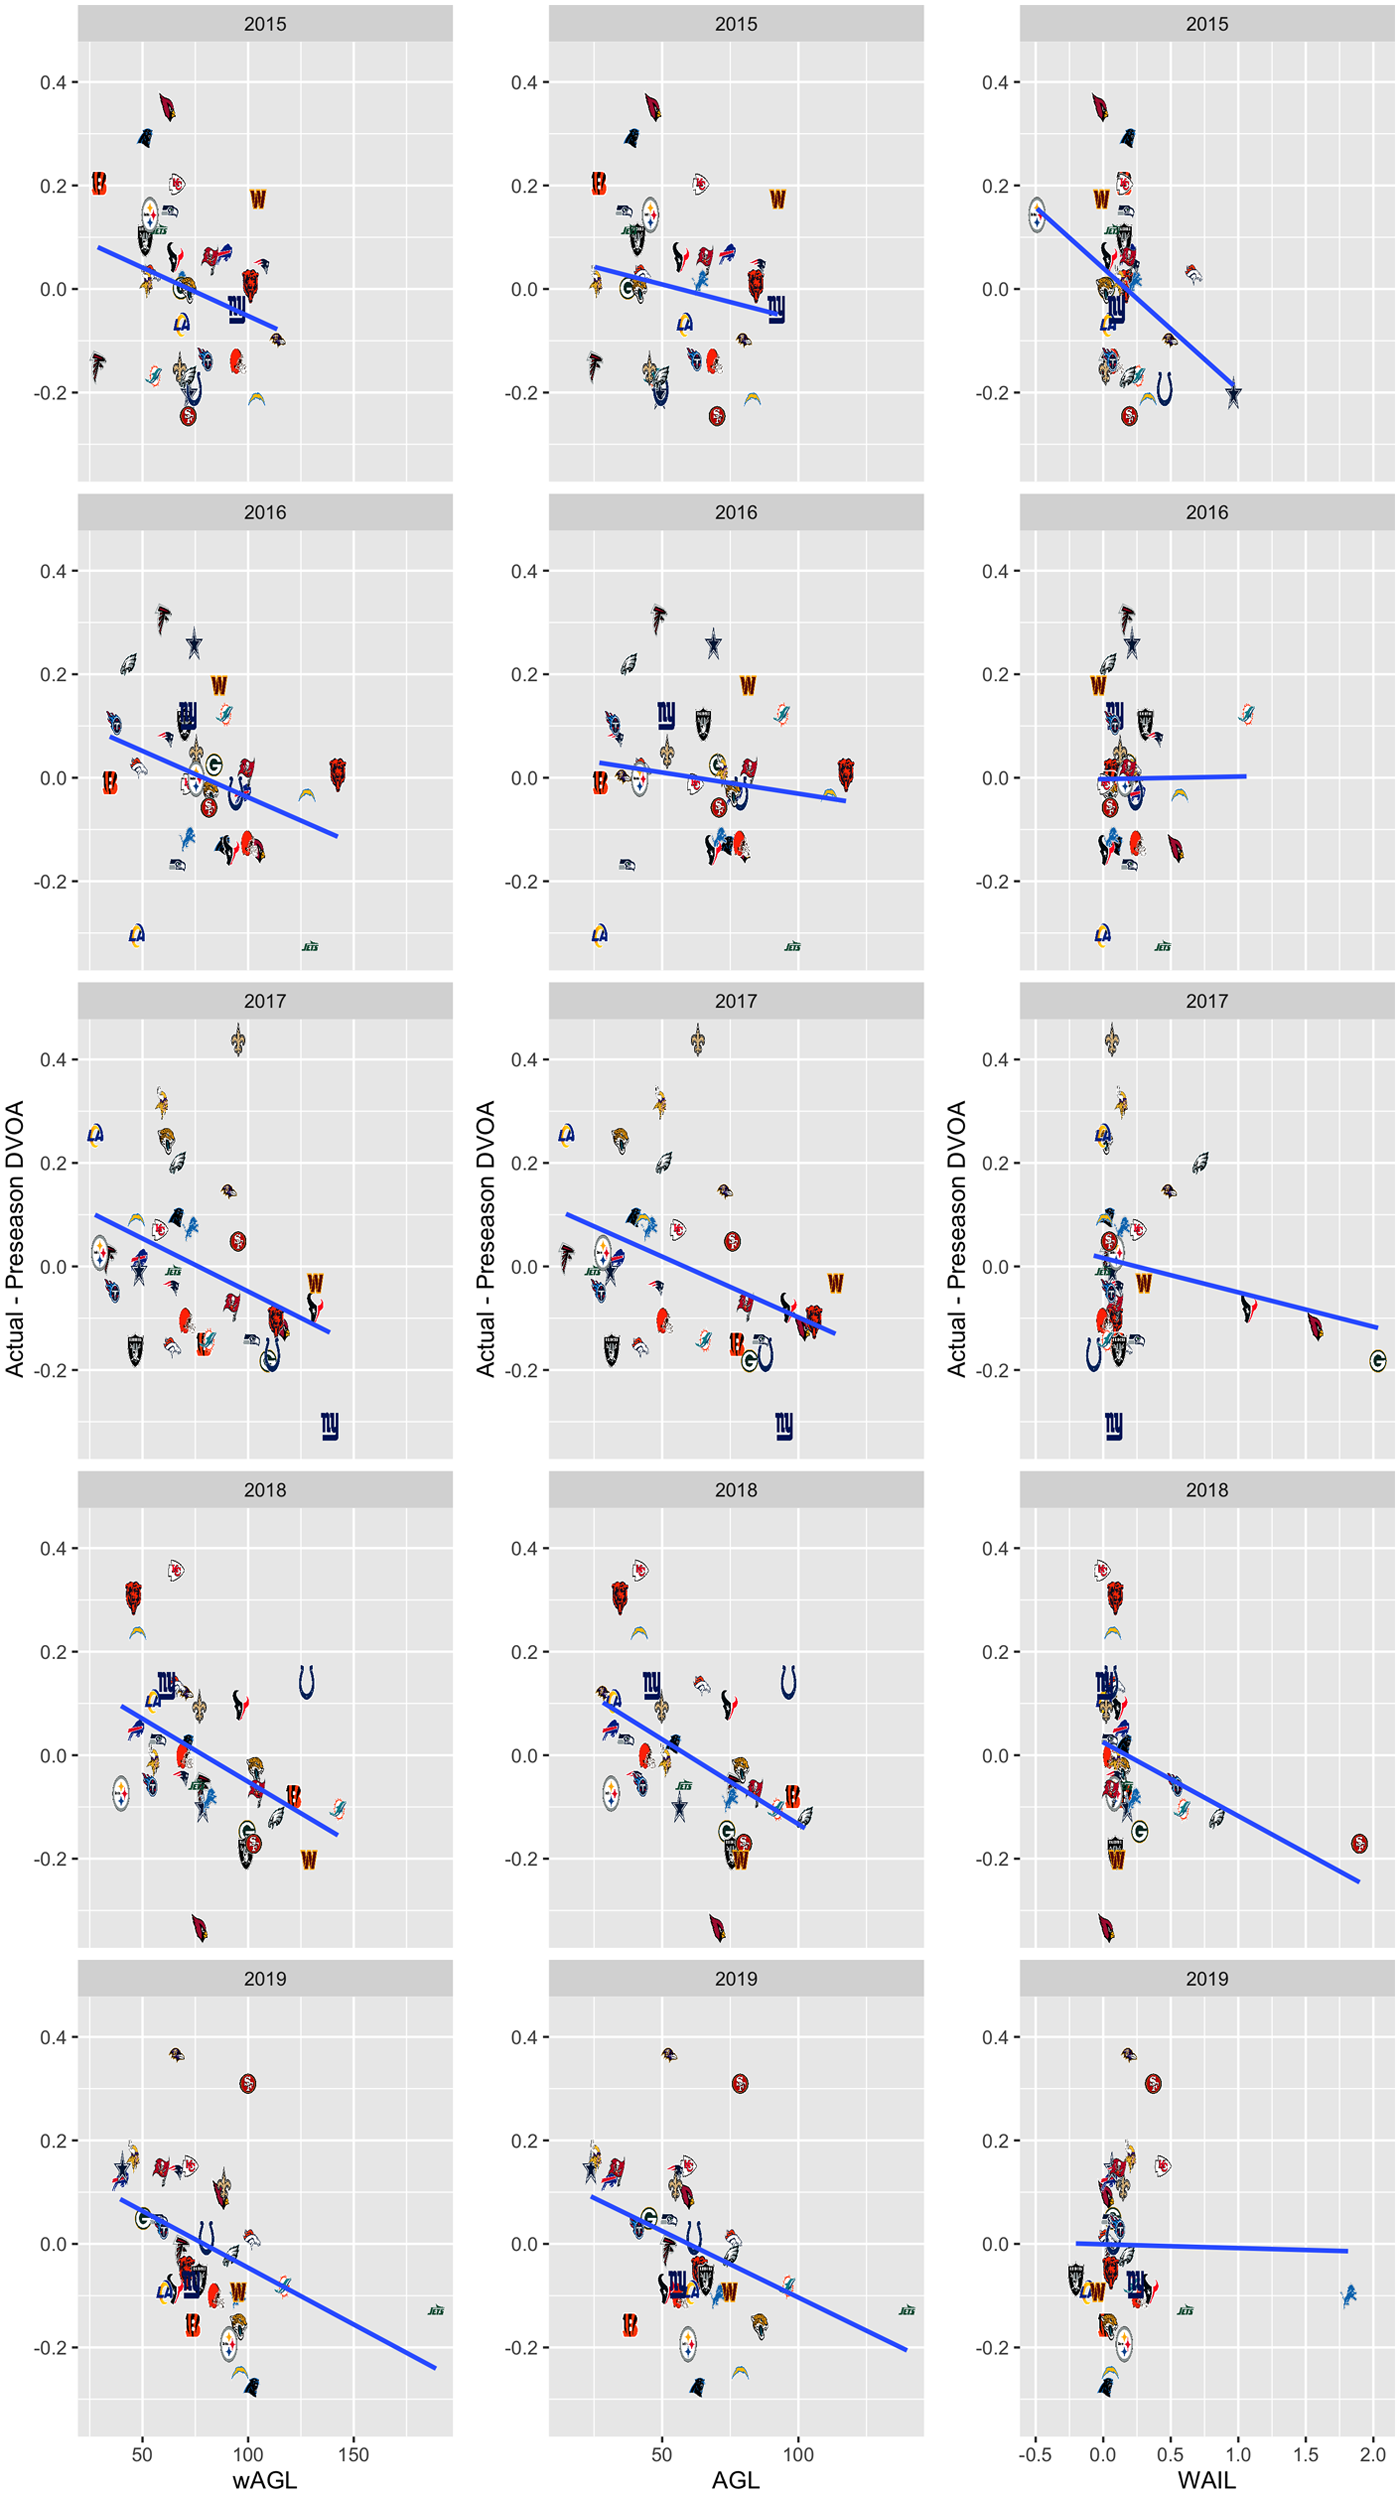
The difference between actual and preseason DVOA (
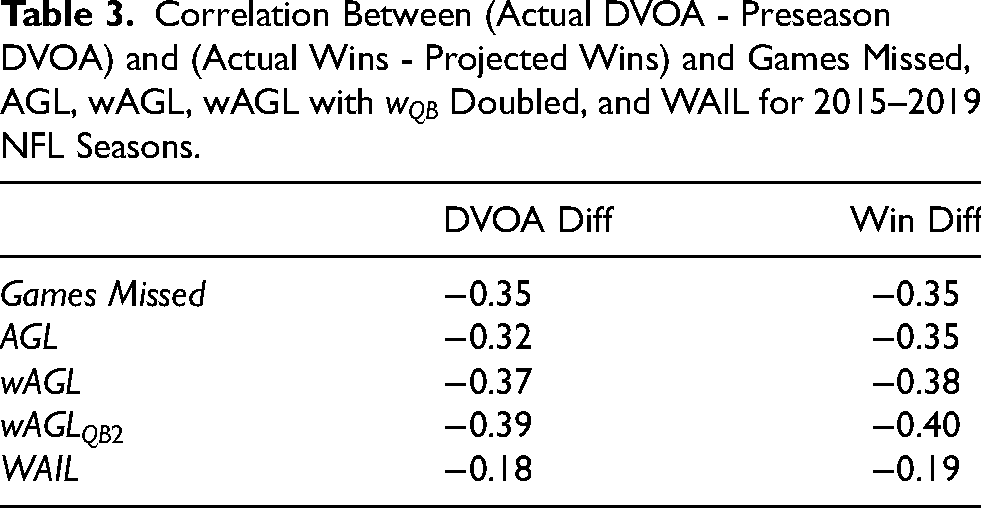
Correlation Between (Actual DVOA - Preseason DVOA) and (Actual Wins - Projected Wins) and Games Missed, AGL, wAGL, wAGL with
Changes in Injury Burden When Weighting
Because wAGL has the highest correlation with our measures of interest, we investigate points where wAGL diverges from AGL to give more insight into the potential benefits of wAGL. Figure 3 shows team wAGL against AGL for each year in our dataset. While AGL and wAGL are strongly correlated (correlation of 0.92), there are many notable points where wAGL diverges substantially from AGL.
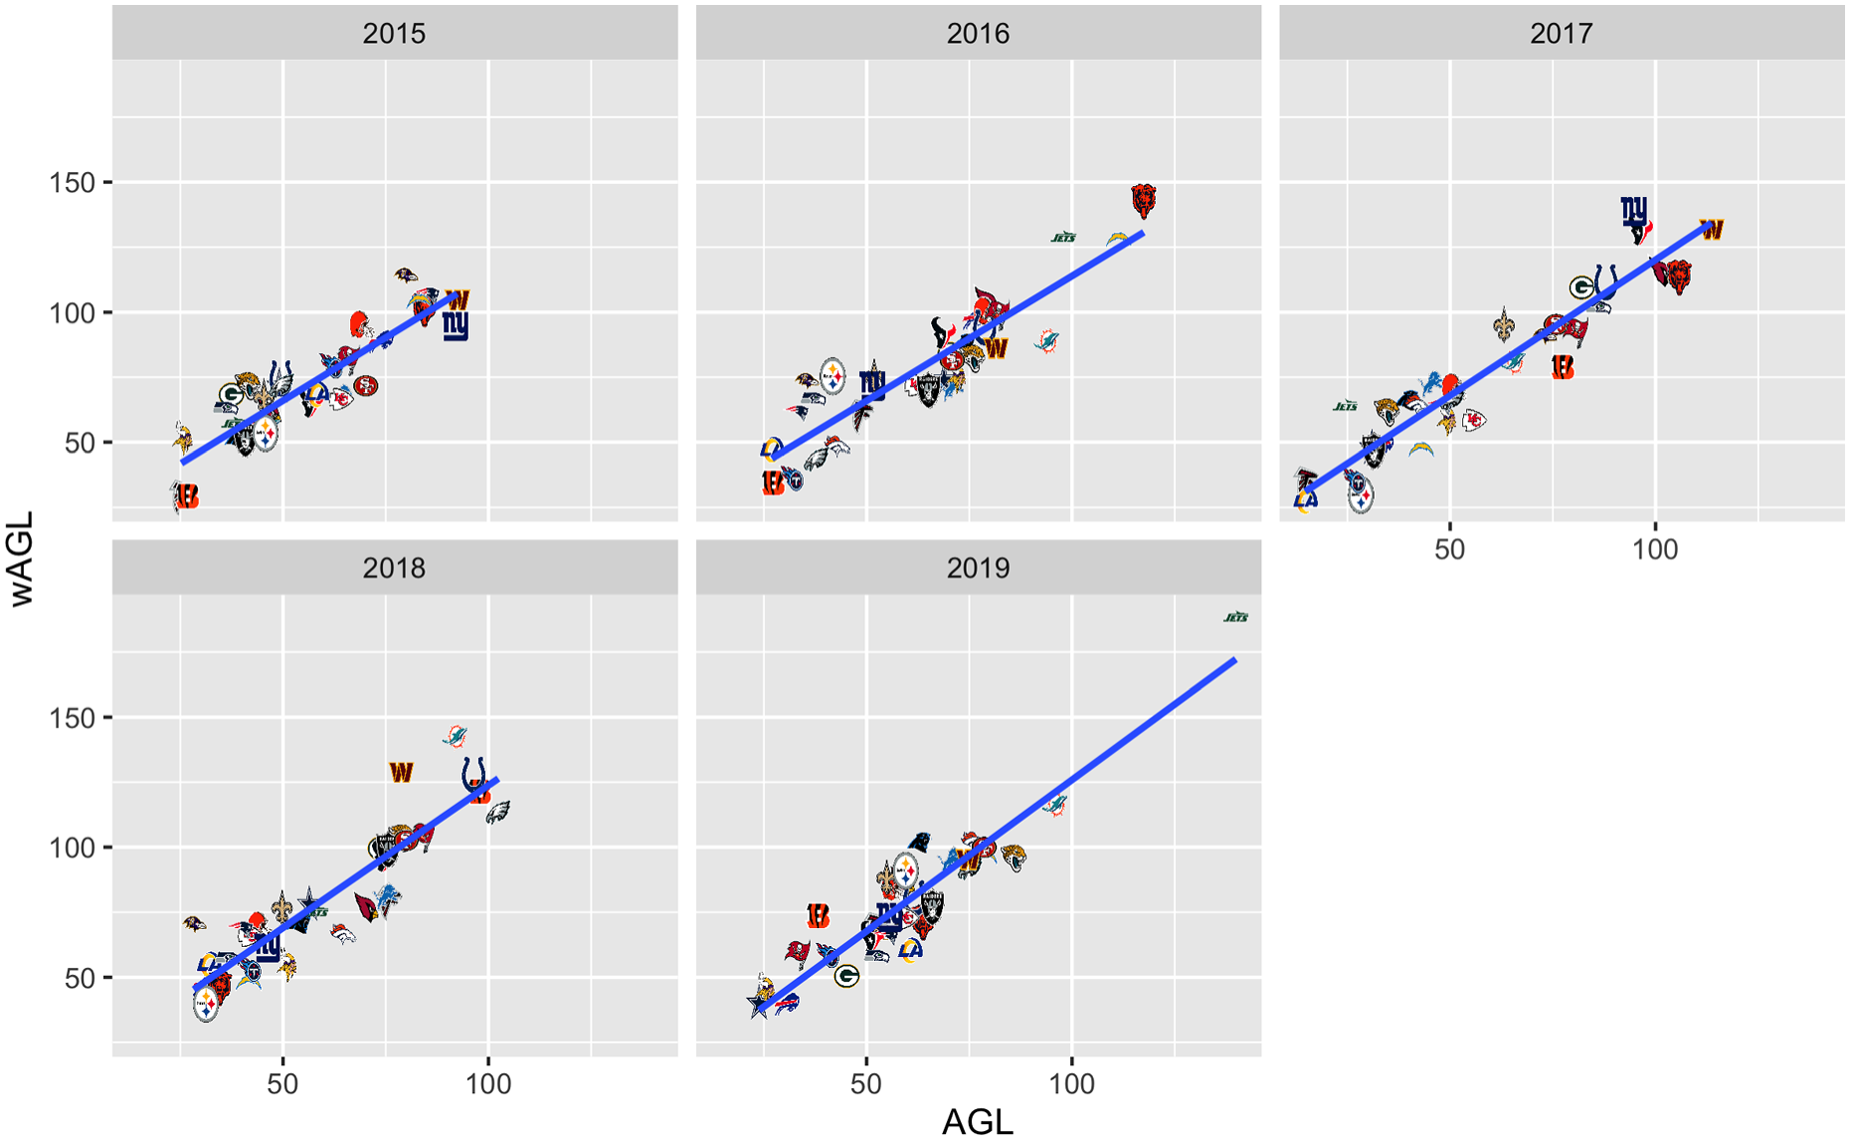
Team wAGL vs AGL values plotted for each year in our dataset (2015–2019). Points on plot represented by team logo to indicate the team that point corresponds to. The line in each plot corresponds to the linear regression line computed on the data.
Table 4 shows the top 10 differences in AGL and wAGL. The difference is measured by the absolute difference between standardized AGL 2 and standardized wAGL. Many large differences in wAGL and AGL occur when teams are faced with a QB injury as quarterbacks are by far the most valuable position and thus have the highest weight in wAGL. For example, for the 2019 Carolina Panthers season Cam Newton suffered a season ending injury after the second week, and in 2018 Washington’s starting quarterback Alex Smith suffered a devastating injury in week 11 and thereafter went 1-6 in their last seven games. The 2018 Baltimore Ravens present an interesting example. They struggled at the beginning of the season and eventually Lamar Jackson replaced QB Joe Flacco due to injury. However, thanks to Jackson’s performance, the Ravens had a successful season (10-6 record).
Top Ten Largest Absolute Differences Between AGL and wAGL for NFL Teams in Our Dataset, 2015–2019. Difference is Measured by the Absolute Difference Between Standardized wAGL and Standardized AGL (wAGL - AGL). Columns with AGL and wAGL Give Standardized AGL and wAGL in Parentheses. In Our Dataset, AGL and wAGL have Mean 59.3 and 77.7 Respectively and Standard Deviation 22.8 and 36.5.
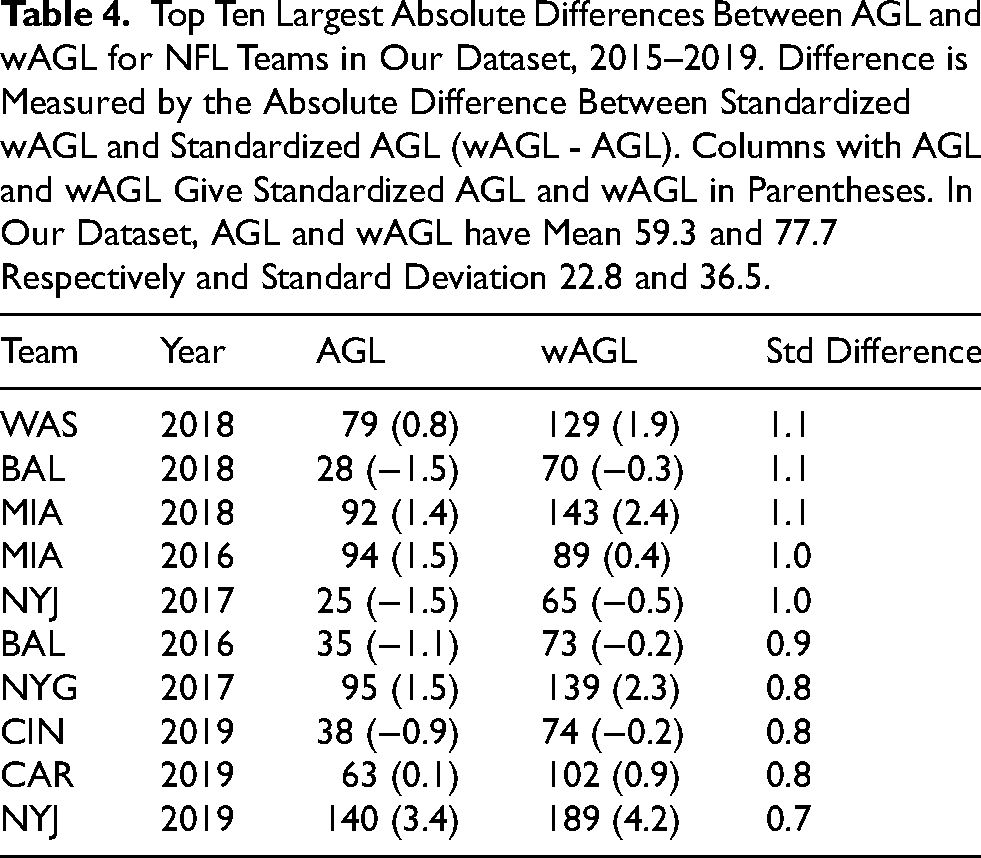
On the other hand, for seasons like the Miami Dolphins’ 2016 season, where a team suffers multiple injuries but not to positions that are highly valued in wAGL, the difference between AGL and wAGL may be substantially negative.
Discussion
When considering all team-seasons, our new position-weighted metric, wAGL, is more highly correlated with the difference in actual and projected DVOA and wins than unweighted AGL or a simple count of games missed. wAGL with a manual upweighting of 2x for QBs performed the best of all tested approaches. WAIL, a player-weighted metric, performed the worst of all investigated metrics.
We recommend that researchers analyzing relevant questions on injury burden in American football consider using wAGL or another position-weighted method with possible upweighting for QBs. Note that not all injury studies require a weighting approach, however. If your research question is, for example, about whether a new rule or prevention program reduces the overall number or severity of injuries you should use counts of games missed or individual injuries, respectively, not weighted by position or player. However, for questions relating to the impact of injuries on team performance, weighting by positional value may increase the accuracy of injury burden measures.
While these approaches were developed in American football using specific positional value weights, the concept can be extended to any sport and any measure of player value.
There are a few possible explanations for why WAIL performed poorly among all team-seasons, even relative to a simple games missed count. One of these reasons is that PFF’s WAR metric places a strong emphasis on the value of quarterbacks so the teams with quarterback injuries drown out the teams with injuries to key players at key positions other than quarterback. While we found that doubling
WAR also does not account for the level of player that is replacing the injured starter and treats all backup players as replacement level. Nick Foles replacing an injured Carson Wentz and playing well enough to win a Super Bowl in 2017 is notably different than Brett Hundley replacing Aaron Rodgers that same year, yet both are treated the same by WAIL. We believe a detailed study on replacement level is an important topic for future research. In particular, that calculating replacement level in a more nuanced way may be necessary for understanding player WAR specific to their team, which in turn would yield a better injury burden measure.
An additional possible explanation is PFF relies on subjective grades on the play-level that are summed in attempt to quantify a player’s overall impact. The idiosyncratic nature of the grades might not accurately capture a player’s value. Further research should investigate whether there is a modification to the WAR calculation or different player-level weighting that could lead to improved results.
In this paper we chose positional weights for wAGL using franchise tag values. We considered other weighting schemes including positional value weights from ESPN’s Mike Clay 3 . See Appendix A for results with this weighting scheme. These weights performed similarly to wAGL, possibly because Clay uses franchise tag values as a substantial input into his positional value model. Another possible weighting method could use the player’s salary cap hit per game multiplied by how many games that they missed. For example, a star wide receiver making 20 million dollars a year getting injured is probably more detrimental to a team than a below-average wide receiver making 3 million dollars in a season. An issue that could arise with this approach is that NFL contracts are not an efficient market (Borghesi, 2008) and thus contracts handed out don’t always fully represent the impact of a player and, even when they do, they are sometimes structured so that a cap hit for a given game does not actually represent what the team would pay for that player for that game on an open market.
Limitations
We used public NFL injury data, which can substantially underestimate actual injury incidence even for high-profile issues such as anterior cruciate ligament (ACL) tears (Inclan et al., 2022). The impact of this should be muted for our research question, however, as we are comparing weighted to unweighted approaches for calculating injury burden rather than the actual values of the injury burdens themselves. Additionally, NFL regulations require all injuries impacting an athlete’s ability to play in a game or fully participate in a practice be publicly reported. Therefore, the injuries that are not publicly reported should be overwhelmingly minor or have occurred outside the regular season to borderline players that resulted in them being waived from the team and thus would be unlikely to substantially contribute to a team’s performance.
Another limitation is we did not account for when players leave a game early due to injury. Since the public injury report data we used is tracked on a week-level and not a play-level, a player leaving a game during its duration wouldn’t count for them missing part of the game. This could be influential as a high-end quarterback getting injured and missing the remainder of the game usually decreases the chance of their team winning. But again these impacts should be the same on both the weighted and unweighted burden calculations, so the relative improvement may not be as dramatically affected.
Finally, our evaluation method for the performance of these weighted measures is likely flawed because our proposed “gold standards” for injury burden (pre-season DVOA/win projections vs. actual DVOA/wins) do not reflect an actual objective measure of injury burden. But the relatively strong correlations we observed between all injury measures and these differences suggest this was a reasonable approach.
Footnotes
Acknowledgments
We are grateful to Aaron Schatz and FTN Fantasy for providing us with DVOA and injury data, and to Benjamin Brown, Eric Eager and Pro Football Focus for providing us with WAIL data for this research.
Funding
The author(s) received no financial support for the research, authorship, and/or publication of this article.
Declaration of Conflicting Interests
The authors declared no potential conflicts of interest with respect to the research, authorship, and publication of this article.
Notes
Alternate Weighting Scheme
We consider applying Mike Clay’s 2019 positional weights 4 instead of weights based on franchise tags.
Table 5 list Mike Clay’s positional values for 2019. The last column “
Table 6 presents the correlation between DVOA difference and win difference with wAGL using the different sets of positional weights: those derived from Mike Clay’s weights, franchise tag values, and AGL. The weights derived from the franchise tags outperform the alternative weighting schemes considered.