
Abstract
Background:
Myotonic Dystrophy Type 1 is a rare multisystem disorder, with symptoms including progressive muscle weakness, myotonia and fatigue. Although mobility measures are now common in several tests performed in clinics, their quantification using wearable sensors have not been significantly explored in the literature. This study investigated variation of gait characteristics during prolonged walking in individuals with Myotonic Dystrophy Type 1 using a single wearable sensor, and their association with gait fatigability proxies.
Methods:
Forty-two subjects with Myotonic Dystrophy Type 1 and 15 healthy controls performed a 6-min walk test while wearing a single lumbar-mounted inertial measurement unit. Minute-by-minute gait parameters were extracted and compared between groups using repeated-measures ANOVA. Correlation analysis was performed to examine whether changes in gait parameters were related to motor functional ability levels.
Results:
Patients demonstrated significantly impaired gait compared to controls, with reduced speed, cadence, step length, and increased stride time variability. While controls and mildly affected subjects showed similar temporal patterns, including a speed decrease in mid-test followed by recovery in the final minute, moderately affected subjects maintained a stable but slower pace throughout. Changes in cadence across the test were weakly but significantly correlated with clinical disability measures.
Conclusion:
Wearable sensors worn during prolonged walking assessments can detect subtle gait alterations in Myotonic Dystrophy Type 1 that vary by disability level, potentially serving as objective outcome measures for monitoring disease progression and evaluating therapeutic interventions.
Trial registration:
The trial was retrospectively registered in Clinicaltrials.gov (NCT06666816, date of registration 31/10/2024). URL: https://clinicaltrials.gov/study/NCT06666816
Introduction
Myotonic Dystrophy Type 1 (DM1) is a rare multisystem disorder, caused by the expansion of an unstable CTG nucleotide repeat in the noncoding region of the myotonic dystrophy associated protein kinase (DMPK) disease gene. 1 Among inherited muscular dystrophies, DM1 is the most common in adults, encompassing about 30% of genetic caused neuromuscular disorders in this age group. 2 In Italy, its prevalence is estimated to be 9.65/100,000. 3 It affects multiple organ systems, involving skeletal and smooth muscle, as well as the endocrine, ocular, cardiac, and central nervous systems, with symptoms including progressive muscle weakness, myotonia and fatigue. 4 Significant advances in understanding the genetic mechanisms of DM1 have led to potential treatments and signalled the urgent need for optimal outcome measures to be used as longitudinal monitoring of disease evolution and as endpoints for clinical trials. 5
People affected by DM1 present with slowly progressive gait disturbances, with deterioration in walking ability and endurance. 6 Moreover, chronic fatigue, a multidimensional concept that involves both physiological and psychological aspects, 7 is a frequent symptom reported by people with DM1 (pwDM1). 8 Although the quantification of outcomes associated with mobility is now common in several tests performed in clinics, 9 their quantification has not been deeply explored in the literature. 10
Most studies analyzed gait in DM1 cohorts over short distances,6,11–14 using gold standards for gait analysis such as optical motion capture systems, instrumented walkways, and force plates. Only one recent study has reported spatiotemporal changes induced by continuous walking exercise in DM1 individuals. 15 The widespread adoption of instrumented gait laboratories in clinical settings is often limited by considerable costs, time-intensive procedures, and the requirement for specialized laboratory environments. In addition, the generalizability of findings is often hampered by the small number of consecutive gait cycles performed during the investigated walking sessions. Consequently, wearable inertial measurement units (IMUs) have emerged as a promising, low-cost, and portable alternative for comprehensive gait assessment. 16 These sensors facilitate the quantification of various gait parameters, offering the potential for detailed analysis outside traditional laboratory settings, complementing classical clinical assessments of gait impairments. The value of this technology is underscored by the fact that, in July 2023, the stride velocity 95th centile, a wearable-derived endpoint representing the 5% fastest strides taken during everyday living, was the first digital endpoint to receive European Medicines Agency qualification for use as a primary endpoint in trials of patients with Duchenne muscular dystrophy. 17
In one of the few studies investigating gait using a lower-trunk IMU accelerometer in DM1, Bachasson and coauthors highlighted that pwDM1 had poorer performance across gait parameters of walking speed, stride frequency, stride length, gait regularity, and gait symmetry with respect to healthy controls while walking along a 25 m long corridor. 18 In another study, Jimenez-Moreno showed that accelerations measured with an IMU positioned at the wrist are lower in pwDM1 than in healthy controls. 19
The 6-min walk test (6MWT) is a low-cost and safe sub-maximal test of aerobic capacity and endurance, reliable and feasible in pwDM1. 20 It is administered by measuring the walking distance covered in 6 min along a flat, straight course with a hard surface. 21 Despite widespread adoption in everyday clinical practice, standard 6MWT performed clinically do not capture the granularity of overall gait patterns, and pwDM1 performing this test have rarely been equipped with wearable sensors, losing a valuable opportunity for an in depth analysis of gait parameters. A recent paper reviewing the use of wearable sensors during the 6MWT highlighted that this technology has provided objective markers of gait fatigability in other cohorts of subjects, 22 demonstrating that deterioration of gait features during the 6MWT using IMUs appears to be a particularly promising direction of research for conditions where motor fatigue is an important symptom. 23
Minute-by-minute monitoring of gait during the 6MWT offers a unique opportunity to investigate the dynamic changes that occur during prolonged walking.9,24 Given the limited scientific literature, our primary aim was to determine if gait parameters worsen during sustained walking in pwDM1, and to compare results with a group of healthy individuals. Our secondary aim was to examine whether these changes were related to motor functional ability levels and other clinical characteristics among people with DM1.
Methods
Study overview, design and participants
This study was performed in accordance with the Declaration of Helsinki, and Comitato Etico Territoriale Lombardia 2 approved the study protocol (Ref. L2-151). The clinical trial has been registered on Clinical Trials.gov: NCT06666816.
Data of the DM1 cohort was collected retrospectively from subjects who took part in inpatient and outpatient visits at the Clinical Operative Unit in Rehabilitation for Rare Diseases of the Central and Peripheral Nervous System of the Scientific Institute Eugenio Medea in Bosisio Parini, Italy, between 2017 and 2024. Data on healthy controls was collected prospectively in 2024 and participants provided written informed consent.
Inclusion criteria for patients were: genetic diagnosis of myotonic dystrophy type 1, 18–75 years of age and ability to walk independently, with or without devices and/or orthoses. Exclusion criteria were: dilated or ischemic heart disease with moderate impairment and chronic respiratory failure with a forced vital capacity lower than 40% or more than 5% of nocturnal time spent with peripheral oxygen saturation levels lower than 90%.
Healthy adults were 18–75 years of age, ambulatory and in good health, and were age-gender matched.
Measures
Individuals with DM1, who met inclusion/exclusion criteria, completed the Motor Function Measure-32 (MFM-32). The MFM-32 is a validated scale 25 consisting of 32 items scored on a four-point scale. 0—cannot initiate the task, 1—can partially perform the task, 2—can perform the movement incompletely or with compensation and 3—can perform the task fully and without compensation. Items belong to one of three different dimensions: standing and transfers (D1); axial and proximal mobility (D2); distal motor ability (D3). The raw sum score of the 32 items (range 0–96) is then converted to a 0–100 scale, with higher scores indicating better functional ability. 26 Demographic data (age, gender, weight, height) were also collected. Subjects were stratified into a mildly and a moderately affected group using the D1 score, in order to obtain two groups of 21 subject each.
All participants performed a standard 6MWT overground walking back and forth in a 25 m long corridor free of obstacles and other people, according to the American Thoracic Society guidelines: 27 participants were asked to cover the maximal distance during 6 min. The use of an assistive device and short resting breaks while standing were permitted as needed. A physiotherapist walked beside the participants to ensure safety and informed them of the time elapsed after completing each minute of the task. Minute-by-minute covered distance and total 6-min walking distance were recorded.
Wearable sensor data collection and processing
This study was conducted using a validated 28 wearable sensor equipped with tri-axial accelerometer (GSensor3, BTS Bioengineering S.p.A., Milano, Italy). Gait features during the 6MWT were captured using a single sensor worn on the lower back at L5, and its spatial orientation corresponded to the three primary axes (Figure 1). Data were transferred to a laptop over Bluetooth, and processed offline using MATLAB (R2022b, MathWorks, Natick, MA, USA). The sensor includes a 3D accelerometer and a 3D gyroscope both sampling data at 100 Hz. To assess variations in gait across the 6MWT, we used previously validated algorithms to extract gait parameters representing steady-state walking in each minute of the test. Briefly, to correct for offset and misalignment of the device, the tri-axial acceleration data was transformed into a horizontal-vertical orthogonal coordinate system according to the procedure proposed by Moe-Nilssen. 29 The algorithm described by McCamley and co-authors in 2012 was then used to compute the heel strikes and toe offs time-points by applying a Gaussian continuous wavelet transformation to the vertical acceleration signal. 30 Heel strikes are identified as local minima of the conditioned signal, while toe offs are derived from the local maxima of the first derivative of the conditioned signal. These gait events were extracted from the data excluding the turning segments as revealed by the yaw signal of the gyroscope. The following gait features were finally computed from each 1-min segment of the 6MWT, using as reference the work from Lord et al. 31 to consider as much as possible features that are independent from each other: speed, cadence, step length, stride time variability, swing time asymmetry, harmonic ratio (vertical, mediolateral and anteroposterior), step regularity and stride regularity.
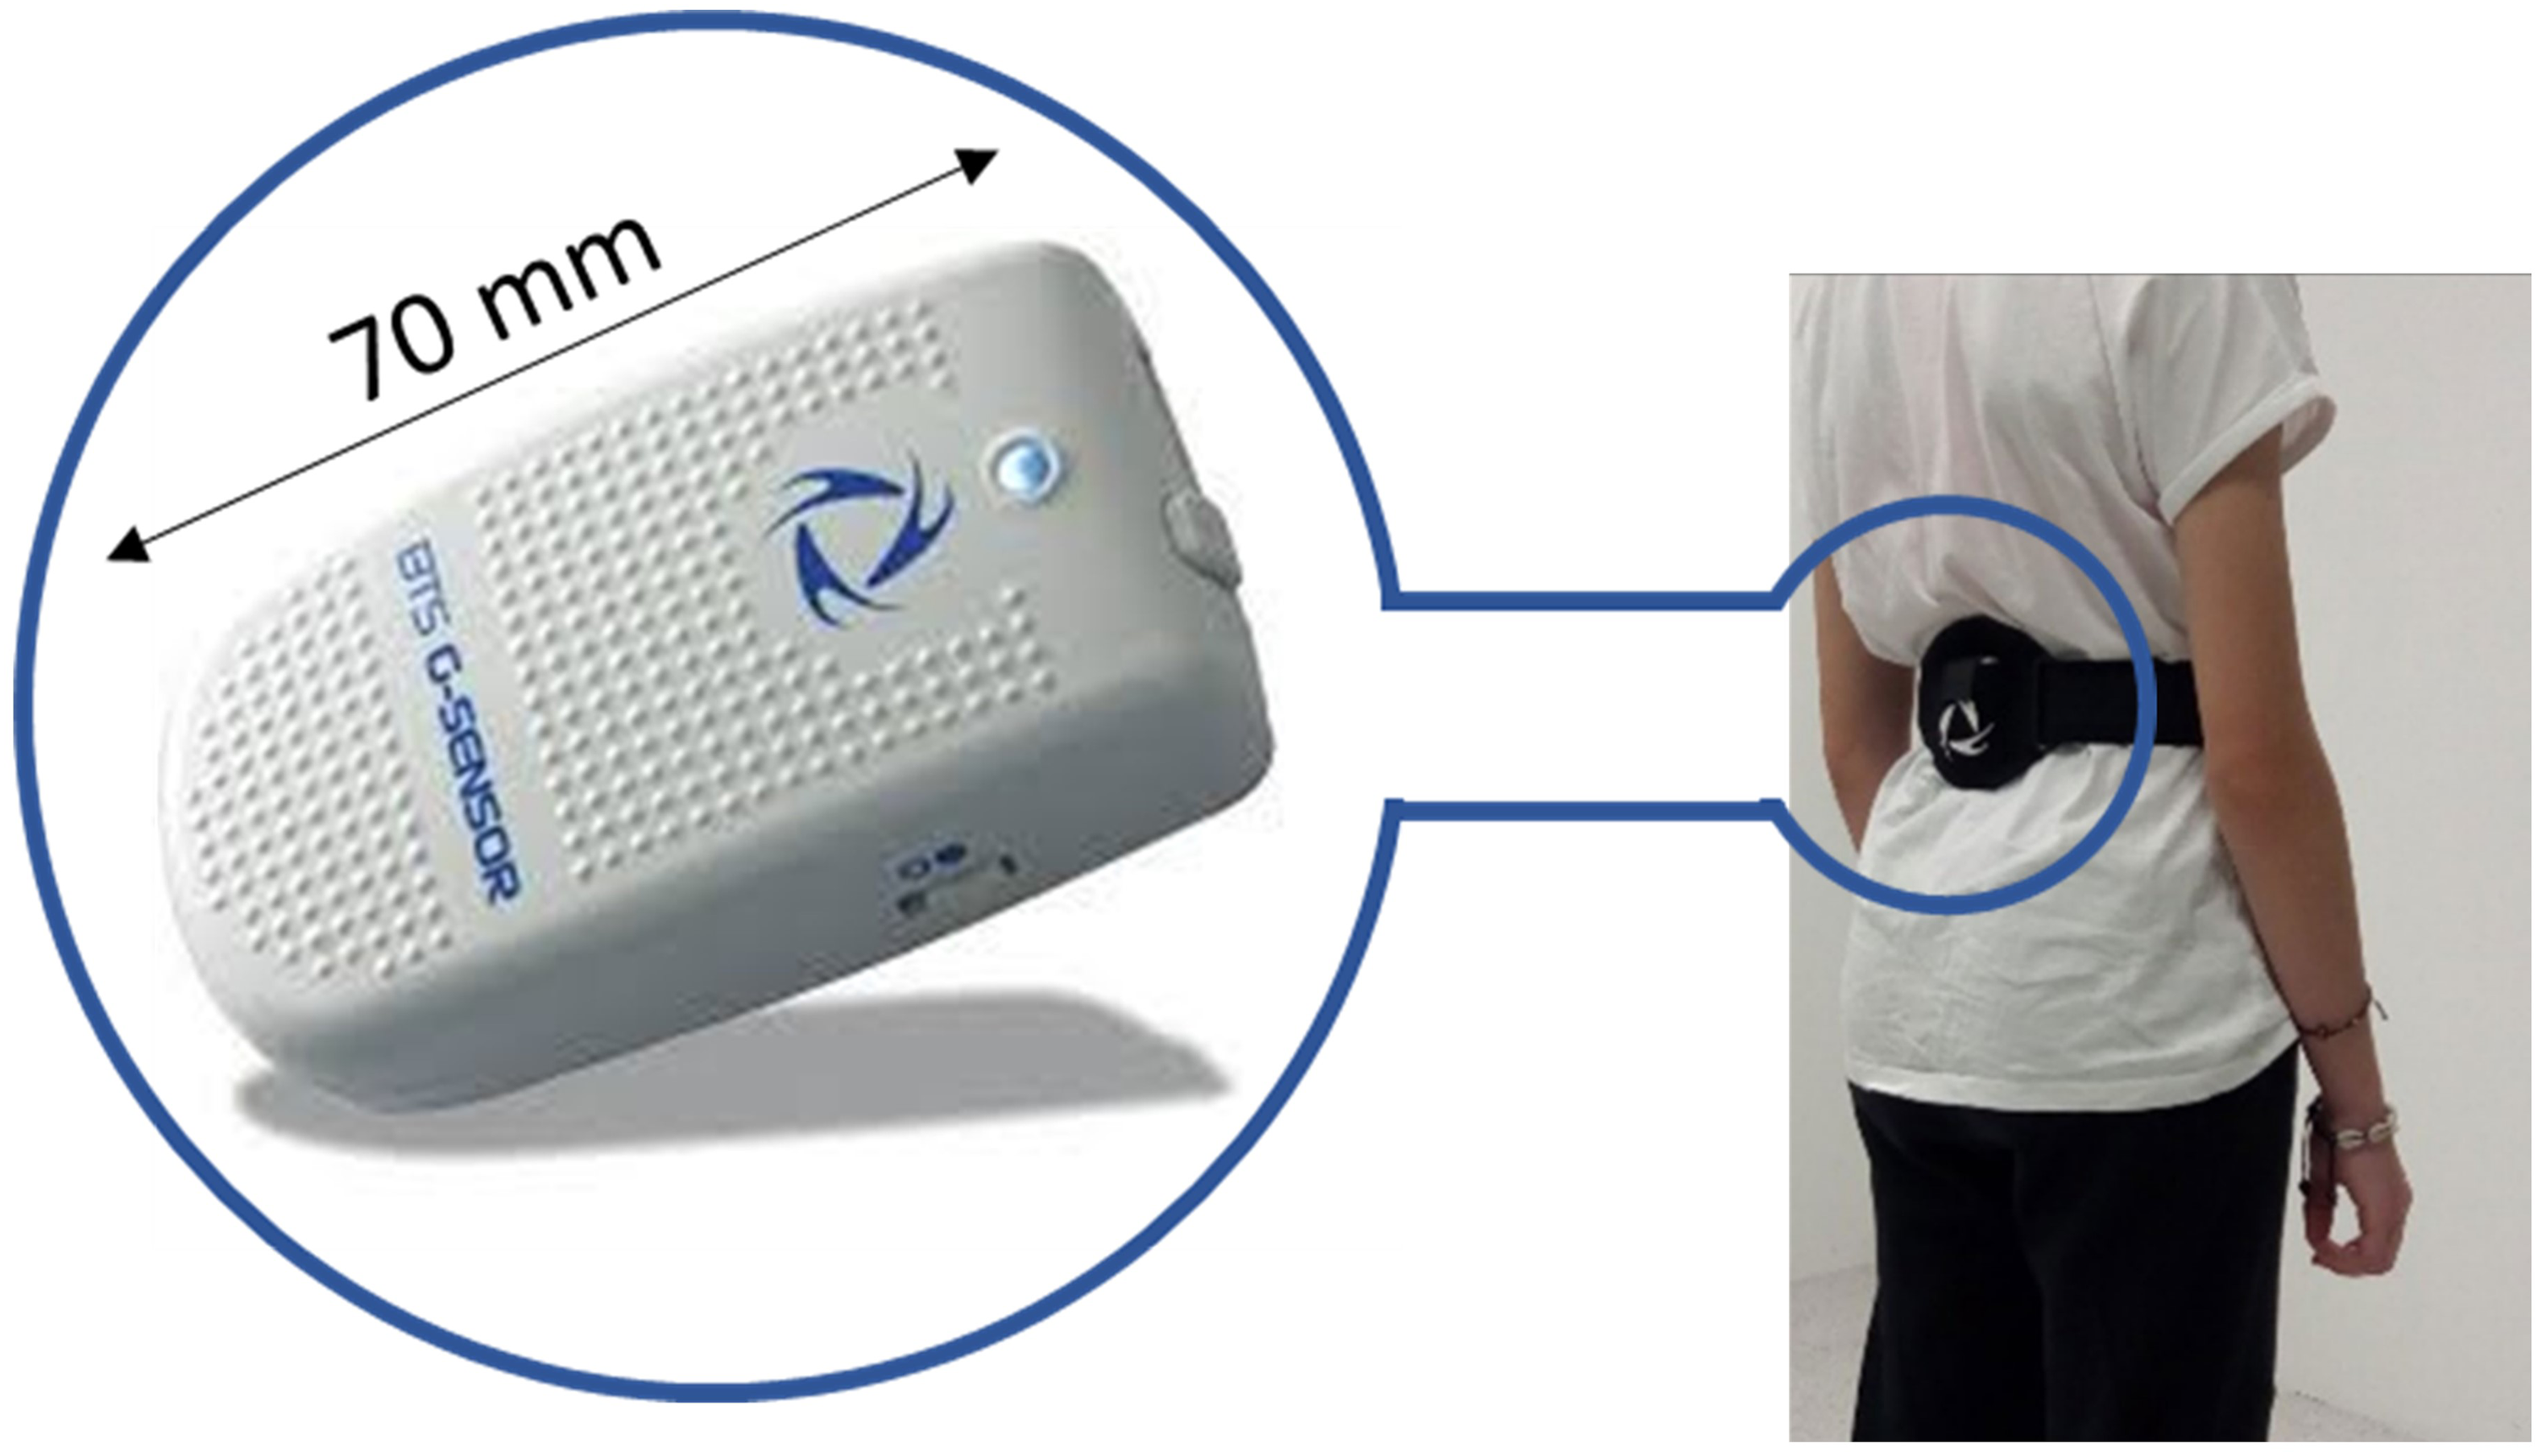
Position of the wearable sensor while the participant is performing a 6MWT.
Stride time variability was computed as the ratio between the standard deviation and the mean of the stride time series, expressed as percentage. Higher variability is related to worse mobility in many clinically relevant populations, such as elderly fallers, frailty, and neuro-degenerative diseases (e.g., Parkinson's and Alzheimer's disease). 32 Swing asymmetry was calculated as absolute difference in mean swing time between left and right swing times. Harmonic Ratio (HR) is a measure of smoothness of the trunk acceleration patterns, and is computed by analyzing the measured accelerations for each stride in the frequency domain through well-established techniques of Fourier analysis.33,34 Step and stride regularity are quantitative measures that provide insights into gait consistency, ranging from 0 to 1 and derived from an unbiased autocorrelation analysis of acceleration patterns. Stride regularity focuses on overall variability in movement, while step regularity specifically examines the symmetry between left and right foot acceleration signals.35,36 Lower regularity scores indicate an irregular walking pattern, which has been observed in clinical populations such as individuals with Parkinson's disease, elderly individuals, and subjects with conditions that can cause gait asymmetry.37,38
Statistical analysis
The statistical analyses were performed using IBM SPSS Statistics version 29.0.1.0. Age, weight, height and BMI were compared between the three groups using independent-samples ANOVA for continuous variables with a normal distribution, and gender was compared using the Pearson's Chi-square test. Effect sizes were computed using eta-squared (η²).
To address the first aim, repeated measures ANOVA was performed on each gait feature assessing the effects of time (within- subject, 6 levels corresponding to each 1 min period during the 6MWT) group (between-subject, 2 levels, i.e., DM1 vs controls) and group × time interaction. Pairwise comparisons were conducted to further explore differences between minutes within each group and between groups for each minute, using the Bonferroni method to correct for these multiple comparisons. Gait variables that were not normally distributed were transformed using Log10(x) (i.e., stride time variability and gait asymmetry), to achieve normal distributions before applying the ANOVA analyses.
To address our second aim, we computed the magnitude of change in each gait feature during the 6MWT as the difference between the maximal and minimal values (MINMAX) measured across the 6 min and between minute 5 and minute 6 (MIN5–6), as a proxy of fatigability. Then, the association between the MFM-32 (global score and D1 dimension) and the MINMAX and MIN5–6 values was determined using Spearman's ρ.
Results
Participant characteristics
We collected data of 21 mildly affected DM1 subjects (2 congenital, 7 childhood, 12 adult), 21 moderately affected DM1 subjects (3 congenital, 6 childhood, 12 adult), and 15 controls. Participants in the three groups were similar with respect to age at onset and years from diagnosis (only DM1), gender, height, weight and BMI, but differed in age (p = 0.022, see Table 1), with the mildly affected group being significantly younger than the moderately affected DM1 group. Participants with mild DM1 covered a mean distance of 500.2 ± 73.1 m during the 6MWT, while participants with moderate DM1 covered 360.4 ± 80.2 m and controls walked a mean of 626.0 ± 73.3 m (p < 0.001).
Demographic characteristics and 6MWD of subjects in the three study groups.
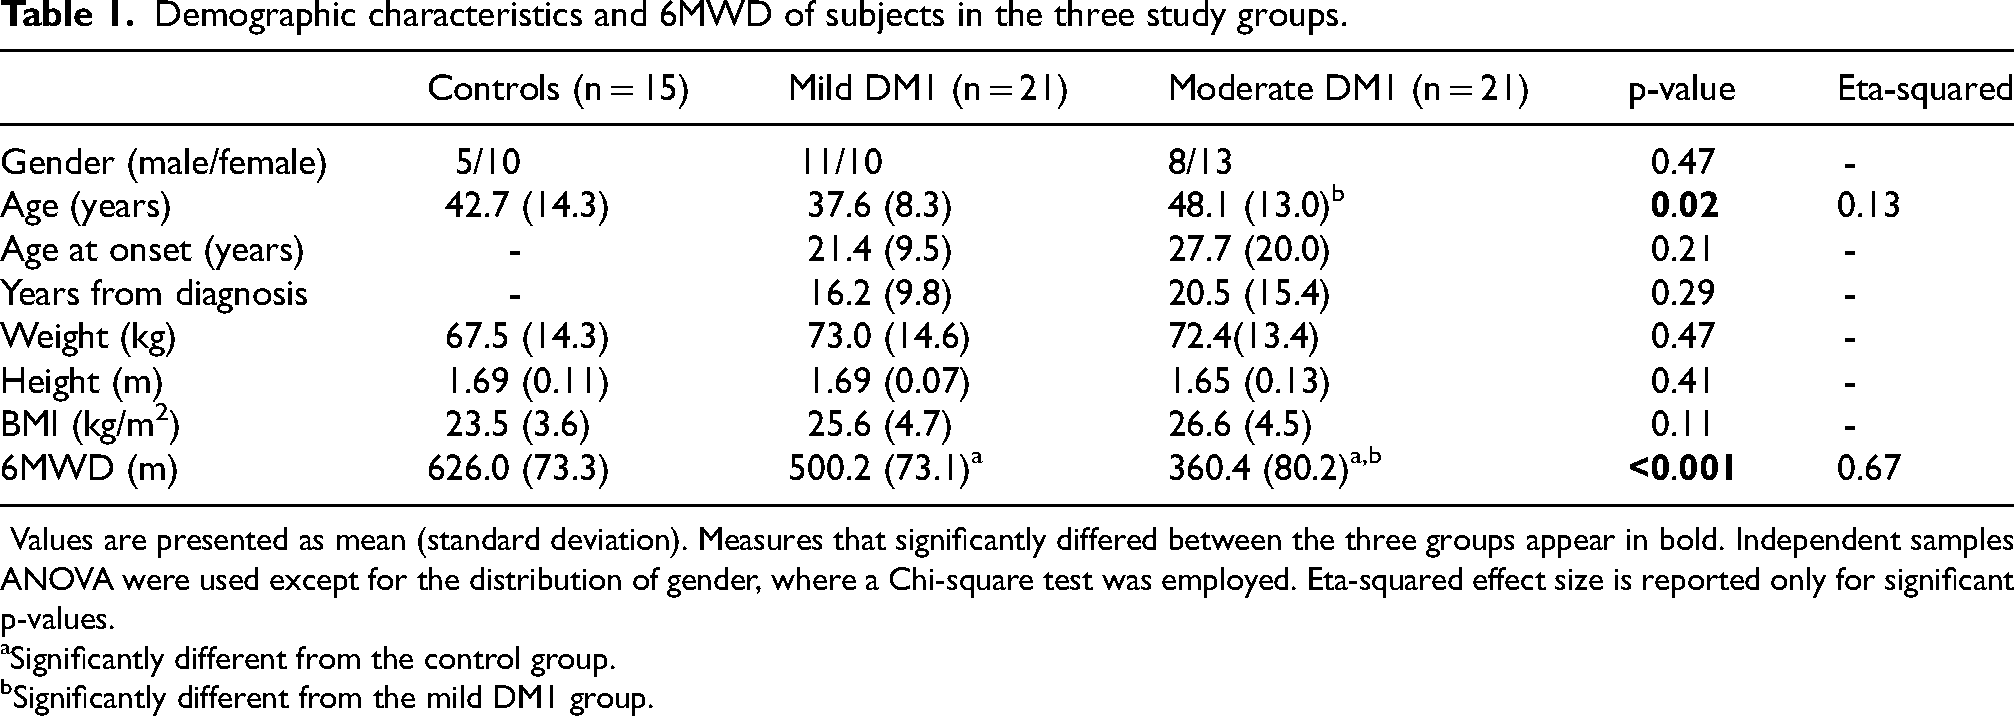
Values are presented as mean (standard deviation). Measures that significantly differed between the three groups appear in bold. Independent samples ANOVA were used except for the distribution of gender, where a Chi-square test was employed. Eta-squared effect size is reported only for significant p-values.
Significantly different from the control group.
Significantly different from the mild DM1 group.
Changes in gait across the 6MWT
Table 2 summarizes the changes in the gait features that were observed during each minute of the 6MWT in the three study groups and presents the main effects of minute, group and group × minute interaction. The moderate DM1 group walked slower (p < 0.001), with a lower cadence (p < 0.05) and a shorter step length (p < 0.001) than the control and the mild DM1 group. In the moderate DM1 group stride time variability was higher (i.e., worse) and harmonic ratio was lower (i.e., worse) compared to the control group (p < 0.05), but not significantly different from the mild DM1 group. In addition, the mild DM1 group walked slower (p < 0.001) and with a shorter step length (p < 0.001) than the control group. No differences between groups were highlighted for swing time asymmetry, step and stride regularity.
Minute-to-minute changes in gait features in the two study groups.
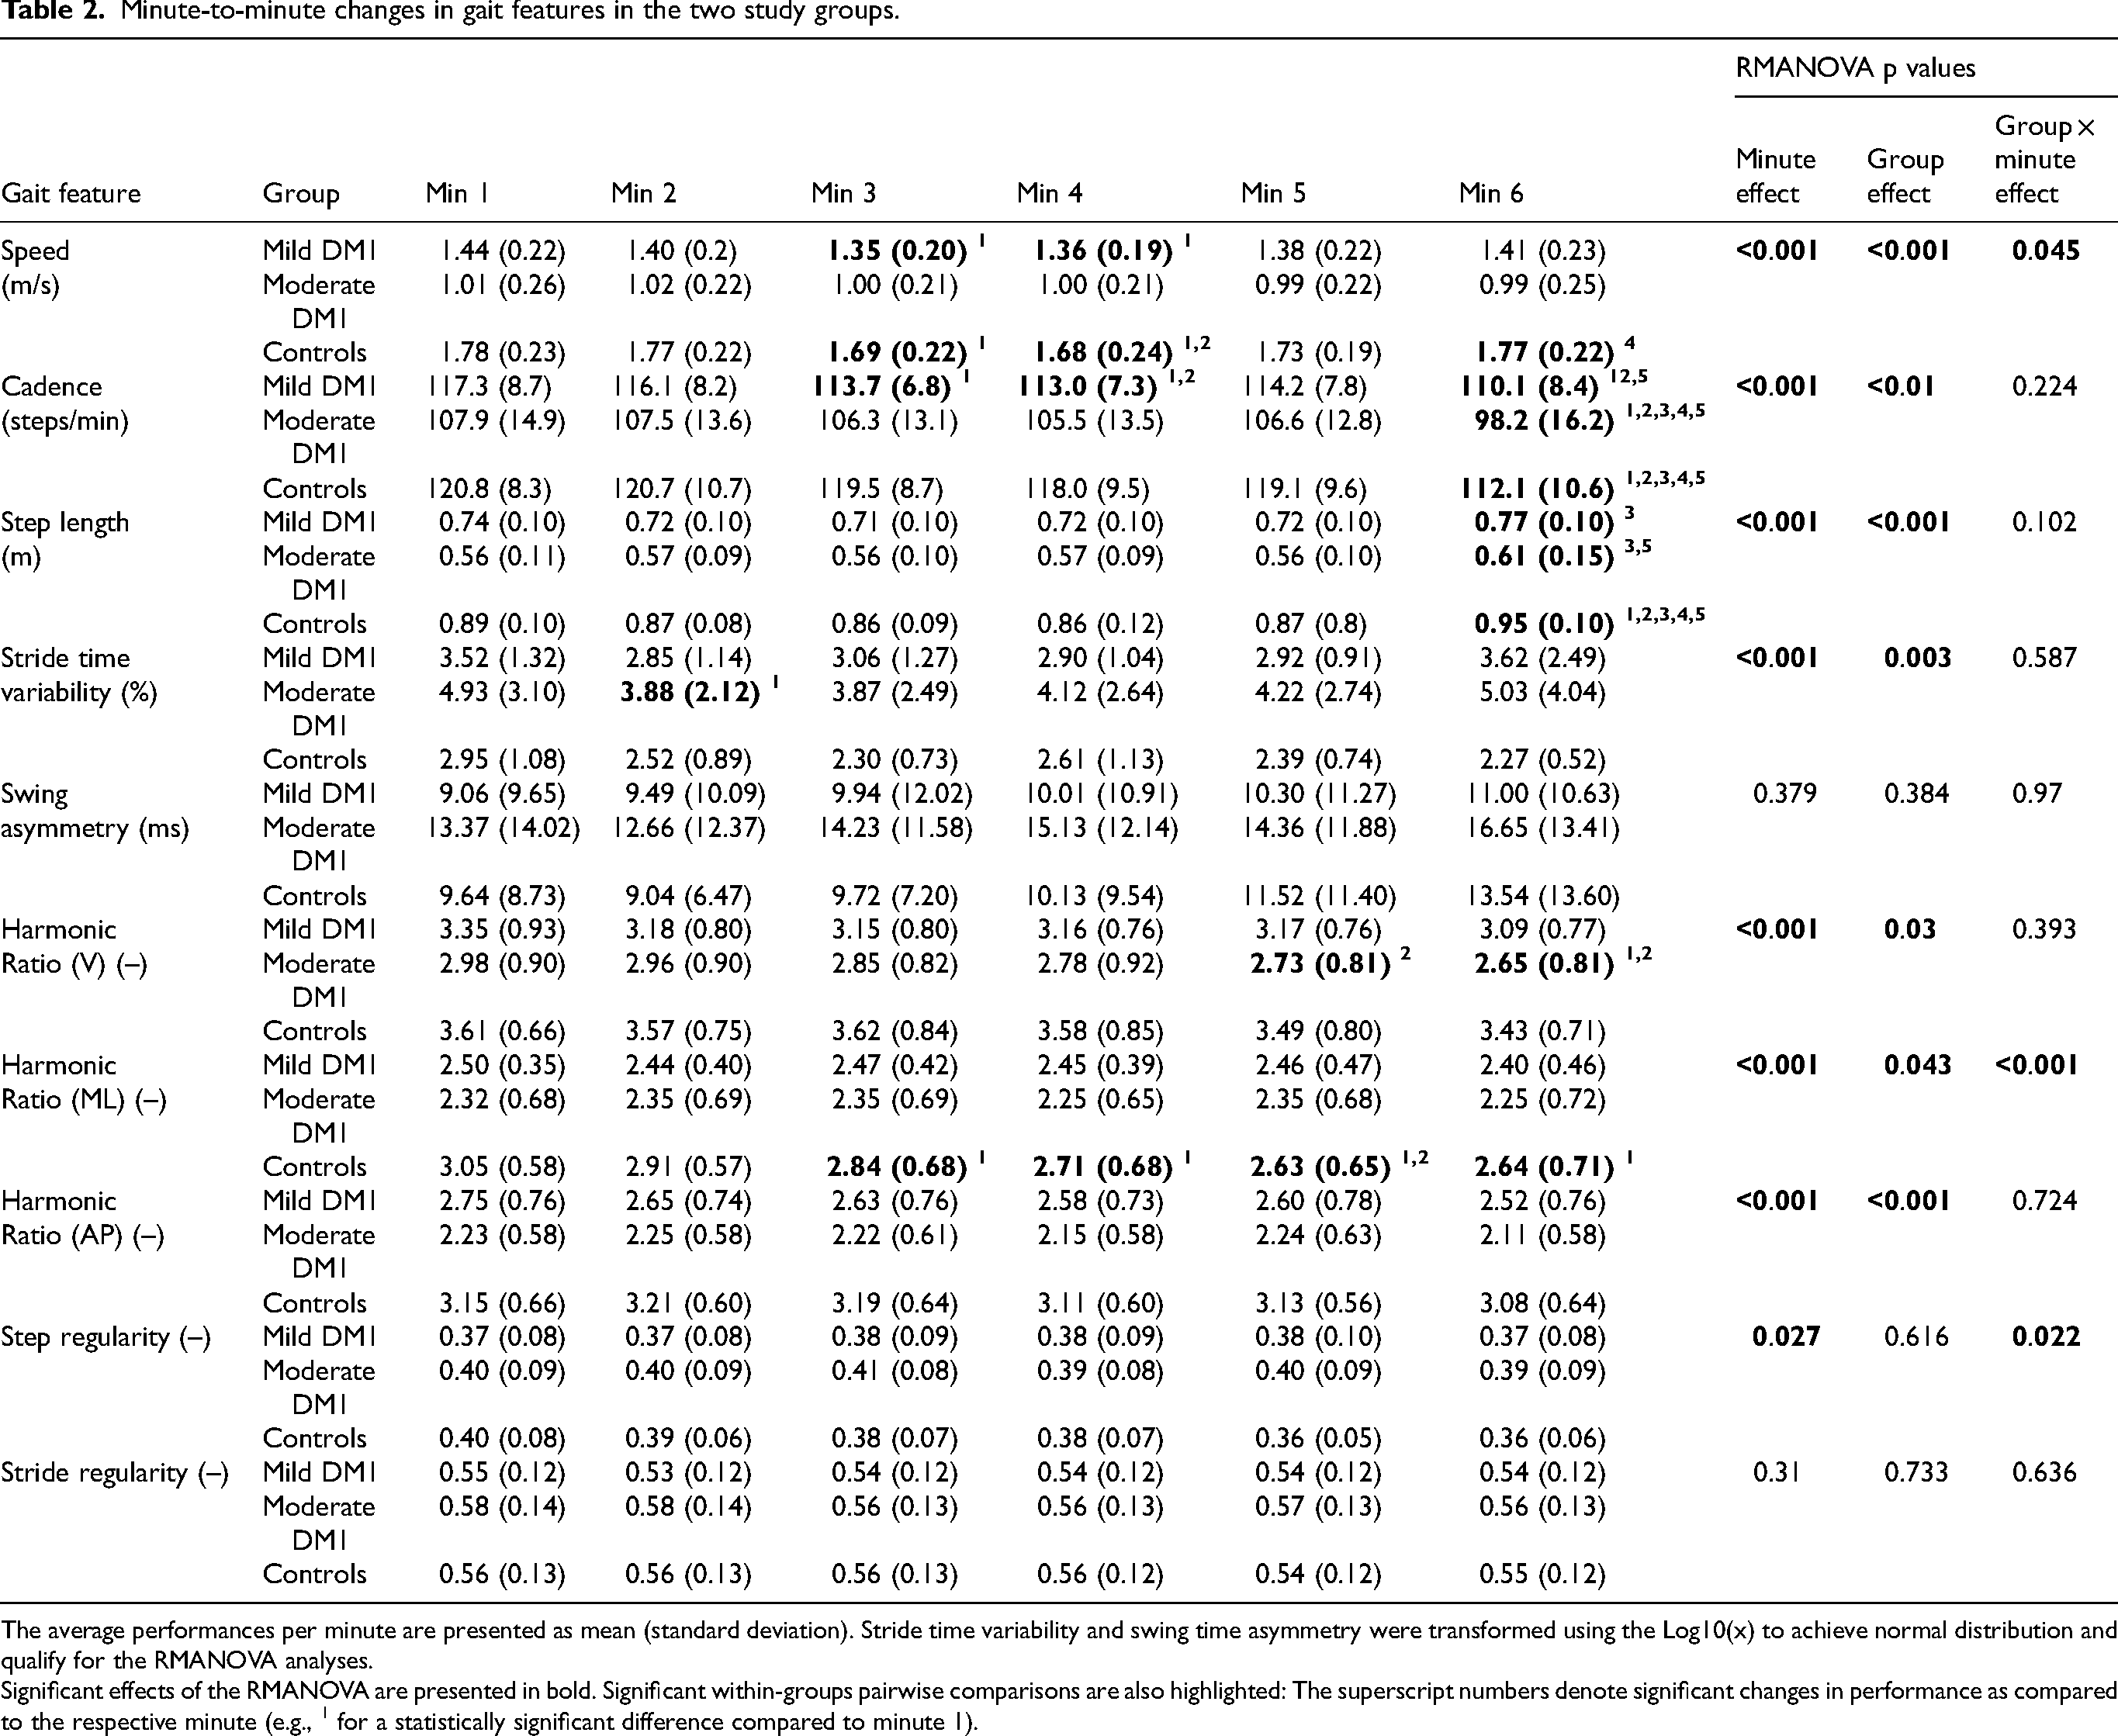
The average performances per minute are presented as mean (standard deviation). Stride time variability and swing time asymmetry were transformed using the Log10(x) to achieve normal distribution and qualify for the RMANOVA analyses.
Significant effects of the RMANOVA are presented in bold. Significant within-groups pairwise comparisons are also highlighted: The superscript numbers denote significant changes in performance as compared to the respective minute (e.g., 1 for a statistically significant difference compared to minute 1).
There was a significant main effect of 6MWT minute for speed (p < 0.001), cadence (p < 0.001), step length (p < 0.001), stride time variability (p < 0.001), harmonic ratio (p < 0.001) and step regularity (p = 0.027), see Table 2, but not for swing asymmetry and stride regularity. Gait speed decreased in the control group and in the mild DM1 group in minute 3 and 4 of the test (p < 0.05). At minute 6, gait speed increased significantly in the control group with respect to minute 4. The trend was similar in the mild DM1 group, although not significant. Speed did not change significantly during the 6MWT in the moderate DM1 group. In all groups, cadence decreased and step length increased significantly in minute 6 compared to previous minutes (p < 0.05). Gait variability decreased in the moderate DM1 group during minute 2 of the 6MWT, while in the control and the mild DM1 group it did not vary significantly across the test. Vertical harmonic ratio decreased in minute 6 in the moderate DM1 group with respect to minutes 1 and 2. A significant decrease in medio-lateral harmonic ratio was also observed in the control group from minute 3 of the test onwards, with respect to the first two minutes of walking. Step and stride regularity did not vary within the groups during the 6MWT.
Figure 2 illustrates the minute-by-minute changes in speed, cadence, step length and stride variability during the 6MWT among the three study groups. Minute-by-minute changes in swing asymmetry, harmonic ratio, step and stride regularity are provided in Figure 3.
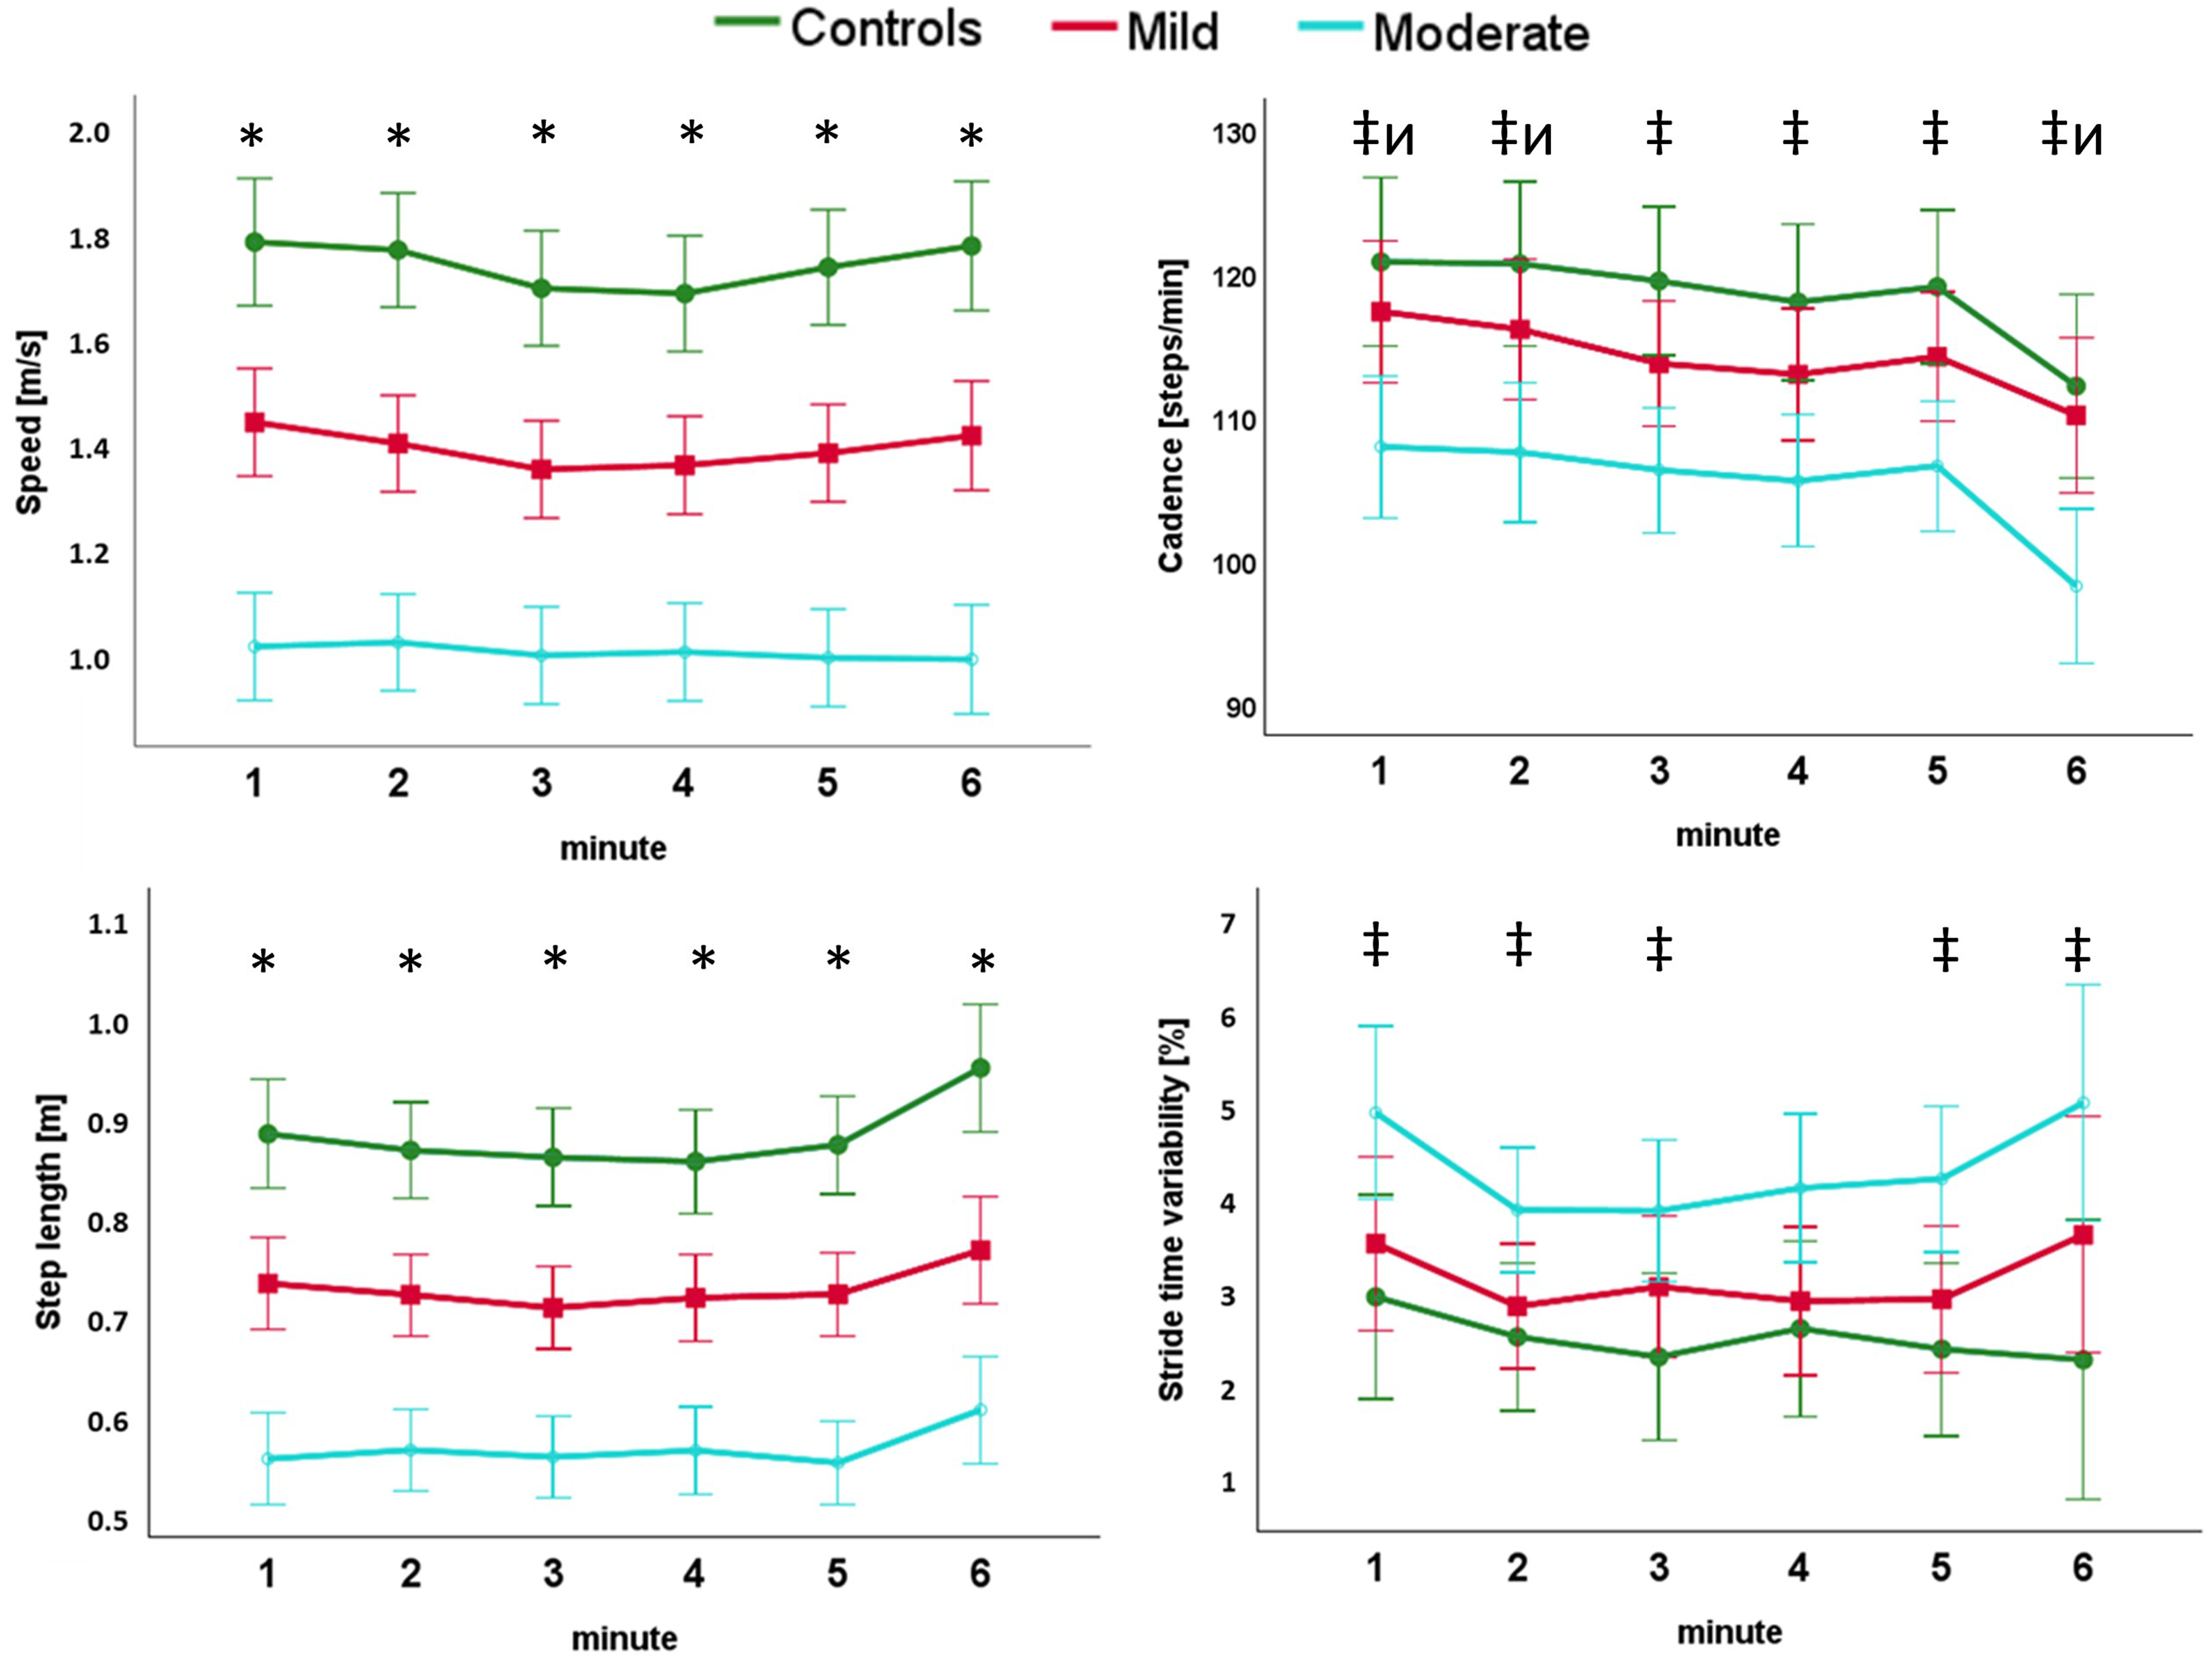
Changes in speed, cadence, step length and stride time variability across the 6MWT in control, mild and moderate DM1 groups. * denotes a significant post-hoc test between all groups at the specified minute. ‡ denotes a significant post-hoc test between controls and the moderate DM1 group. ͷ denotes a significant post-hoc test between the mild and the moderate DM1 group. χ denotes a significant post-hoc test between the control and the mild DM1 group (adjusted for multiple comparisons).
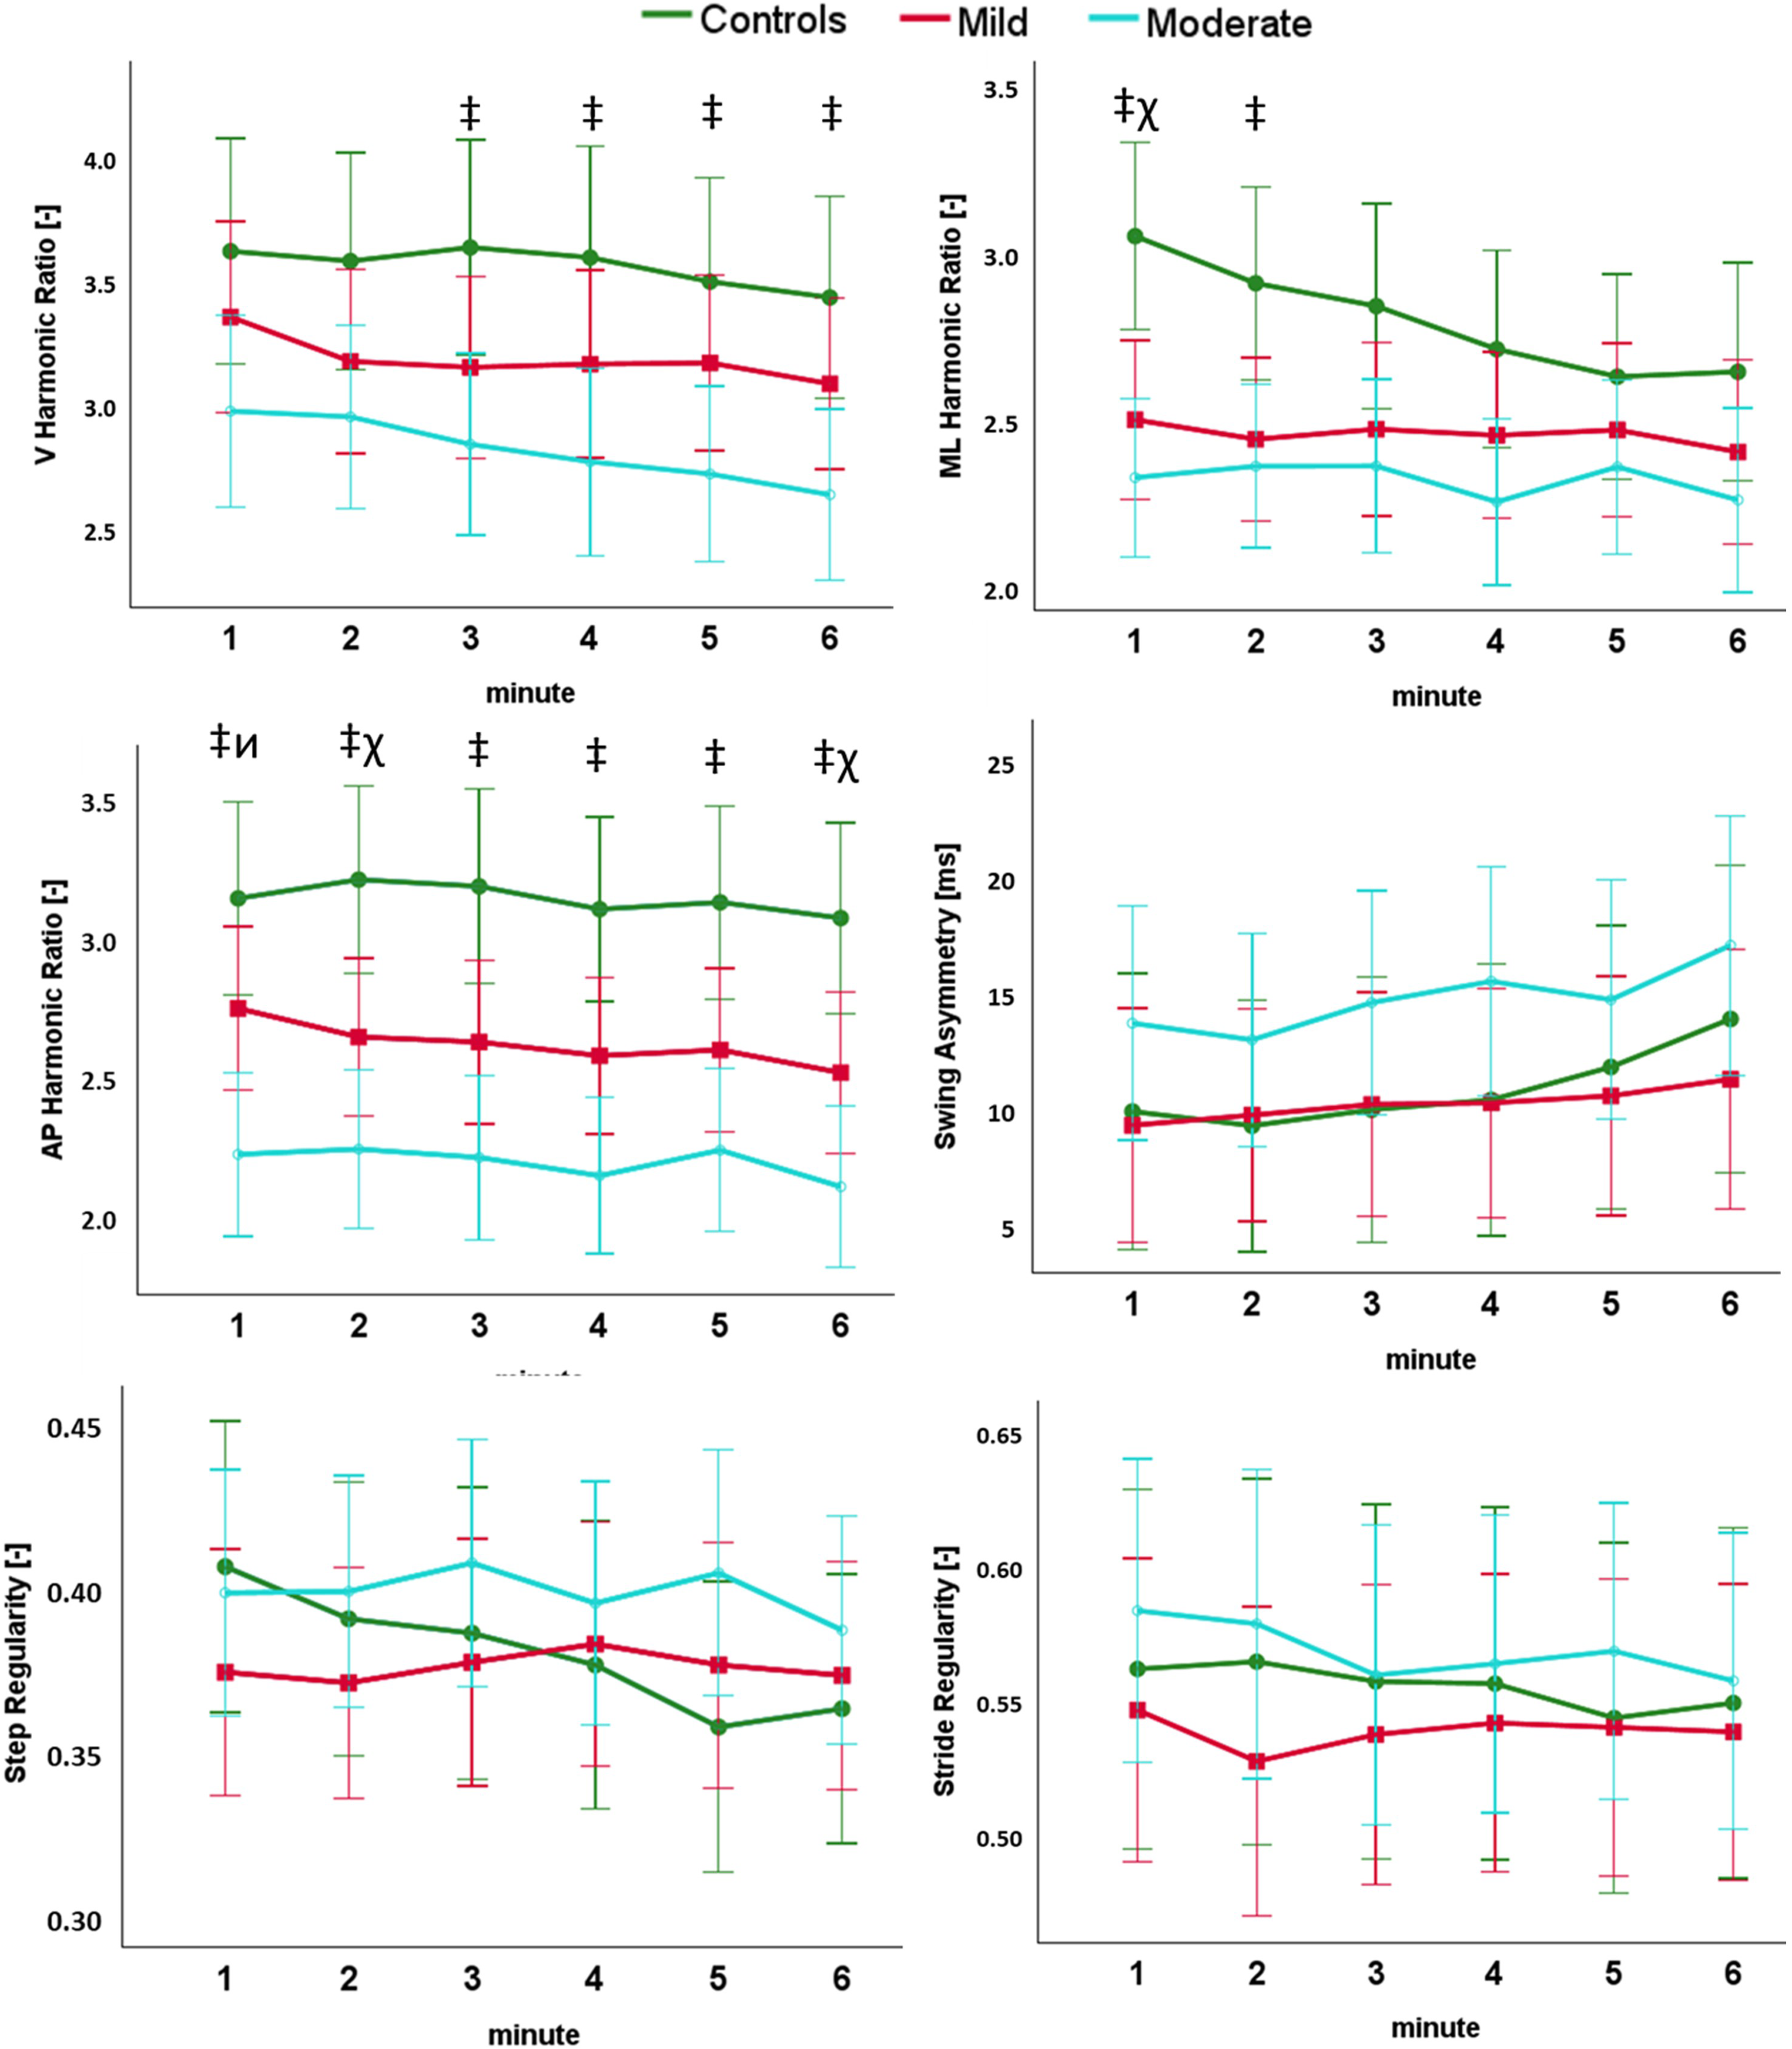
Changes in harmonic ratio, swing asymmetry, step and stride regularity across the 6MWT in control, mild and moderate DM1 groups. * denotes a significant post-hoc test between all groups at the specified minute. ‡ denotes a significant post-hoc test between controls and the moderate DM1 group. ͷ denotes a significant post-hoc test between the mild and the moderate DM1 group. χ denotes a significant post-hoc test between the control and the mild DM1 group (adjusted for multiple comparisons).
Correlations between gait parameters and clinical features
The relationships between observed gait changes during the 6MWT and clinical outcomes are presented in Table 3. Worse gait disability, reflected by higher Total MFM and D1 scores, was significantly correlated with greater variations in cadence, measured as difference between values at minute 5 and 6 (p < 0.05).
Summary of the correlations between the total score and the D1 dimension of the MFM scale and the observed changes in gait parameters across the 6MWT.
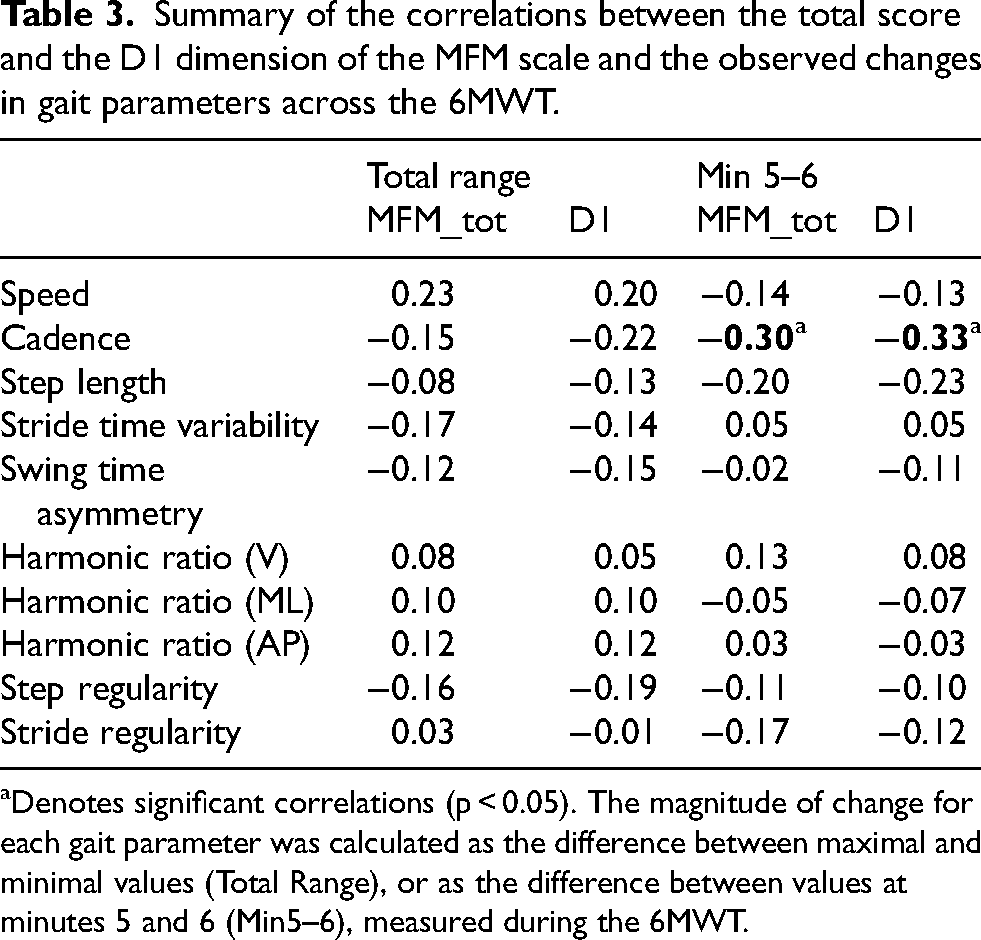
Denotes significant correlations (p < 0.05). The magnitude of change for each gait parameter was calculated as the difference between maximal and minimal values (Total Range), or as the difference between values at minutes 5 and 6 (Min5–6), measured during the 6MWT.
Discussion
The present study provides a detailed investigation into the variation of gait parameters during prolonged walking in pwDM1, beyond the measures of total distance and gait speed. Our findings reveal that gait parameters in pwDM1 differed from those of the control group, and worse gait performance was related to higher disability levels. Interestingly, we also highlighted that the two DM1 groups differed in patterns of gait cadence and variability across the 6MWT, and only some of the gait parameters changed during the test. Variations in cadence during the 6MWT were also weakly correlated with clinical measures of disability. These findings indicate that gait parameters respond differently to prolonged walking and that the response may depend on the level of disability. Overall, the present findings demonstrate that wearable sensors provide a more complete, quantitative characterization of gait that enhances our understanding of walking in pwDM1.
Gait alterations measured during the 6MWT
We found that several gait features are worse in pwDM1 than in controls during prolonged walking. These findings are consistent with previous literature using wearable inertial sensors on cohorts of subjects with neuromuscular diseases. Bachasson and coauthors reported a total distance covered by a cohort of DM1 subjects of 413 m (1.15 m/s), 18 compared to 673 m (1.87 m/s) walked by controls, a value in-between what we report in the present study for the mild (500.4 m–1.39 m/s m) and moderate (360.0 m–1.00 m/s) DM1 groups. Another study reported mean gait speeds during the 6MWT test of 1.22 (439.2 m) m/s for DM1 subjects and 1.90 m/s (684.0 m) for controls. 19 In their validation study on pwDM1, Kierkegaard and Tollbäck report mean walked distances of 519–536 m, equivalent to gait speeds of 1.44–1.49 m/s, 20 values that are slightly higher than those reported in the present study in the mild DM1 group.
Our study was the first to focus extensively on studying the variations of gait parameters during the 6MWT in pwDM1, investigating minute-by-minute variations. One preliminary report on pwDM1 informed that 40 subjects walked significantly fewer meters in the final 2 min in comparison to the first 2 min of the 6MWT. 39 This finding was confirmed recently by Hoerter and coauthors, who investigated differences in gait patterns of pwDM1 between the initial and the final phases of a 6MWT and revealed a 6.25% decrease in speed, due to both shorter step length and lower stride frequency. 15 On the contrary, we observed a slight decrease in walking speed in the mild DM1 group in minute 3 and 4, with a non-statistically significant recovery in the final minutes. This trend was similar in the control group, but different in the moderate DM1 group, where no change in walking speed was observed. A very similar pattern to ours was observed by Goldman et al. 40 in 40 subjects with multiple sclerosis stratified in 3 groups by disease severity, where it was observed that subjects with mild multiple sclerosis (MS) increased their walking speed in the last minute, mirroring the trend of healthy controls, while in the moderate and in the severe MS cohorts the walking speed in the final minute decreased or was unchanged. However, other studies exploring walking pace during the 6MWT did not find differences among MS subgroups. 41 Previous studies in MS have proposed cut-off values of 15% to 10% decline in walking speed over time as indicators of gait-related motor performance fatigability. 42 In our study, 6 participants declined in walking speed more than 10%, but they were evenly distributed between the mild and the moderate DM1 groups. We also highlighted in the final minute a significant decrease in cadence and an increase in step length in all three groups that should be further investigated given this has not been observed in other reported studies 43 and to verify if impairment level affects walking speed more than cadence and step length.
Stride variability was consistently statistically higher in the moderately affected DM1 group compared to the mildly affected group and controls. The trend in stride time variability in all subgroups was similar, with a decrease after the first minute that could be justified explained by participants settling into a steady walking rhythm that reduces gait variability. An increasing stride time trend was observed in the final minute in both DM1 groups, but not in the control group. Consistently with previous literature, we also observed worsening of gait variability parameters during prolonged walking.24,44 Clinically, the trend of this parameter could be justified by the impairment of postural control, frequently observed in pwDM1 and further impacted by fatigability. We did not find any significant difference between groups and across minutes in swing asymmetry, and this is in line with previous findings that DM1 typically manifests with bilateral and symmetric muscle involvement. 45
To our knowledge, our study is the first to investigate minute-by-minute variations of harmonic ratio (HR) and gait regularity estimated by means of autocorrelation of trunk accelerations during prolonged walking. Harmonic ratio in the anteroposterior and mediolateral directions have been signalled as responsive speed-independent outcome measures when assessing the effectiveness of rehabilitation. 46 We found that HR in the anteroposterior direction was the most sensitive to discriminate between the three study subgroups, but no major minute-by-minute variations were highlighted during the 6MWT. Clinically, reduced values in both anteroposterior and vertical HR could be related to the deficit of the distal muscles of the lower limbs, essential in the push-off phase. Stride and step regularity metrics were not capable of discriminating significantly between subgroups and did not show significant minute-by-minute variations. Our findings indicate that harmonic ratios and gait regularity metrics were more stable during prolonged walking than conventional spatiotemporal parameters. Further studies should investigate if longer walking sessions performed during daily life allow to highlight variations also in these parameters.
Correlation between variations in gait parameters and clinical outcomes
The association between gait fatigability, estimated as the variation of the measured gait parameters during the 6MWT, and the level of impairment has been rarely reported in the literature and never in pwDM1. Previous studies have shown association between gait fatigability, measured as variation in gait performance, and the subjective perception of fatigue.24,47 In our study, we found a significant correlation between the cadence variation in the final 2 min of the 6MWT and the MFM total score and D1 dimension, but not in other variables. This partially supports the clinical relevance of the gait features used in this investigation.
Limitations
Several limitations should be acknowledged in this study. First, while the gait event detection algorithm has been validated in patient populations, including multiple sclerosis, 48 and has shown good performance above walking speed of 0.5 m/s, it has not been specifically validated in pwDM1. Furthermore, wearable sensors positioned at the ankles may be more accurate in identifying gait events. Second, our assessment lacked patient-reported measures of fatigue, usually collected through validated questionnaires such as the Fatigue Severity Scale,49,50 which could have provided complementary subjective data, exploring better the correlation between subjective fatigue perception and objective fatigability. Furthermore, the study focused exclusively on motor function, while other measures, such as the 5-grade British Medical Research Council (MRC) scale, may help to provide a more comprehensive clinical picture of the patients. Third, although prolonged walking was evaluated, assessments were conducted in a controlled clinical environment rather than free-living conditions, potentially limiting generalizability and ecological validity. Fourth, a larger sample size would be beneficial to verify whether the observed low correlations persist in a broader population.
Conclusions
This study provides novel insights into gait characteristics during prolonged walking in pwDM1 using wearable sensor technology. All algorithms used to obtain the parameters described in the present study may be embedded into existing device applications, making them easily accessible to clinicians and researchers in the future. Our findings demonstrate that gait parameters differ significantly between pwDM1 and healthy controls, with more pronounced differences in moderately affected individuals. The minute-by-minute analysis revealed distinctive patterns of gait adaptation during prolonged walking, with some parameters showing greater sensitivity to fatigability than others. Specifically, changes in cadence during the 6MWT correlated with clinical measures of disability, suggesting potential utility as an objective marker of disease progression. These findings highlight the value of wearable sensor technology in capturing subtle gait alterations that may not be apparent through conventional clinical assessments. Objective quantification of gait parameters during prolonged walking could serve as valuable endpoints in future clinical trials evaluating therapeutic interventions for DM1, particularly those targeting fatigability and mobility impairments. Future studies would benefit from more structured stratification of subjects by impairment level to better understand how gait characteristics vary across the disease spectrum.
Footnotes
Acknowledgements
We wish to thank all study participants.
Ethical considerations
The Comitato Etico Territoriale Lombardia 2 Ethics Committee approved the study protocol (Ref. L2–151). Data of the DM1 cohort was collected retrospectively from subjects who took part in inpatient and outpatient visits at the Clinical Operative Unit in Rehabilitation for Rare Diseases of the Central and Peripheral Nervous System of the Scientific Institute Eugenio Medea in Bosisio Parini, Italy, between 2017 and 2024. Data on healthy controls was collected prospectively in 2024 and participants provided written informed consent.
Consent to participate
Prospective participants provided written informed consent before participating in the study.
Consent for publication
Not applicable
Authors’ contributions
FAS substantially contributed to the conception and the design of the work, collected, analysed the wearable sensor data, interpreted the data, and drafted the manuscript.
ED contributed to the conception and the design of the work, collected the wearable sensor and clinical data and interpreted the results, and substantively revised the manuscript.
LEM contributed to the collection of the wearable sensor data and to the interpretation of the results, and substantively revised the manuscript.
MDF contributed to the collection of the clinical data and substantively revised the manuscript.
GM substantively revised the manuscript.
EB contributed to the interpretation of the results, and substantively revised the manuscript.
MGD contributed to the interpretation of the results, and substantively revised the manuscript.
All authors read and approved the final manuscript.
Funding
The authors disclosed receipt of the following financial support for the research, authorship, and/or publication of this article: This study was supported by the Italian Ministry of Health (Ministero della Salute) (Ricerca Corrente 2024-2025 to Dr. Emilia Biffi).
Declaration of conflicting interests
The authors declared no potential conflicts of interest with respect to the research, authorship, and/or publication of this article.
Data availability
The data presented in this study are currently available from the corresponding author on reasonable request, and will be made openly available in Zenodo after publication.