
Abstract
Charcot Marie Tooth disease (CMT) is a neurological condition characterised by fatigue alongside motor and sensory impairments. CMT also has a high prevalence of lifestyle dependent co-morbidities, despite which there are limited dietary guidelines for those with CMT. The present study aimed to determine whether diet quality and nutrient intake differed between CMT and control, and whether this may be associated with fatigue and mobility. Age matched participants [n = 25 CMT aged 53.6(15.3) years, n = 27 controls aged 51.5(12.0) years] completed 3-day food diaries, and online surveys. Food diaries were assessed using daily nutrient targets (Recommended daily intake, RDI), micronutrient-based scoring (MyNutritionIndex, MNI), food group-based scoring (healthy eating index, HEI-2020) and ultraprocessed food (UPF) intake. Survey outcomes included fatigue, quality of life (QoL), and mobility. CMT participants met none of the RDI targets of 32 nutrients, with 16 sufficiency nutrients lower than controls based on RDI and MNI (P < 0.05). MNI and HEI-2020 were not different between CMT and control. Minimally processed food intake was 27% lower in the CMT group, with UPF contributing double the caloric intake in CMT than controls (P < 0.05). In CMT, QoL domains were 36% lower than control (P < 0.05), fatigue severity and mobility were 56% and 11% worse than controls, respectively (P < 0.05). Fatigue severity was negatively associated with HEI-2020 in CMT and controls (P < 0.05). In the present study, diet quality using RDI was lower in CMT compared to controls. In both CMT and controls, fatigue severity was associated with worse diet quality based on micronutrient and food group analysis.
Introduction
Diet and health are inextricably linked such that diet quality, the degree to which a diet conforms to a predetermined criteria for nutrient intake, 1 is associated with mortality and the prevalence of morbidities such as cardiorespiratory diseases in otherwise healthy adults. 2 Conversely, those with physical disabilities often have lower diet quality.3,4 Within neurological conditions such as multiple sclerosis, fatigue and mobility issues have been shown to prevent the purchase and preparation of fresh ingredients, 5 an important component of healthy eating as home cooking is associated with better diet quality, 6 and lower processed food intake. 7
Similar to multiple sclerosis, Charcot Marie Tooth disease (CMT) is a neurological condition with high levels of bodily fatigue that negatively impact daily life. 8 Specific to CMT however is the pattern of physical impairments, with a unique presentation of distal deformities, muscle weakness and sensory loss.9–11 Beyond these physical characteristics of CMT, are a number of lifestyle related comorbidities; high body mass index (BMI) and high adiposity are prevalent in CMT, 12 but there are no research informed nutritional guidelines for those with this condition. 13 In general terms, an integrated model of health is influenced by behaviours across the life course (including diet), which in turn are influenced by a variety of wider contextual social, economic, and organisational barriers and facilitators. 14 People who adopt healthy diets are more likely to be healthy and have improved quality of life (QoL), 2 a process facilitated by successful campaigns providing guidance such as, eating a healthy diet 15 or increasing vitamin D intake. 16 Within adults with CMT, limited condition specific knowledge of healthy eating behaviours, 17 a lack of dietary guidance, 18 and constraints on time 19 could contribute to poor diet quality, and as with other conditions a reliance on convenient, ultra-processed alternatives. 20 Alongside the physical disability, 21 psychosocial challenges may also contribute to lower access to high quality nutrition in those with CMT. 22 Understanding how the condition impacts dietary quality is an essential step in producing dietary advice and implementing healthy eating plans. 23
Aside from broad dietary guidelines, 13 dietary research within CMT has primarily involved nutritional supplementation to improve outcomes such as body composition or muscle mass; Curcumin, 24 ascorbic acid 25 and intermittent fasting 26 despite proving promising in rodent models, have however shown no benefits in human CMT, unless combined with exercise. 27 Recommendations for dietary supplements should be dependent on dietary deficiencies, 28 with condition specific dietary guidance rather than individual nutrient supplements. 29 There are for example, specific to CMT, a number of co-morbidities that could show some benefits from a balanced, research informed healthy diet; as adults with CMT have a high prevalence of impaired glucose tolerance, 30 bone fractures, 31 and metabolic syndrome consistent with a high prevalence of overweight and obesity. 32
The aim of the present study was therefore, to undertake a review of dietary intake in adults with CMT, to determine diet quality and nutrient intake within this population, and whether these may be associated with specific impairments such as fatigue and disability severity.
Materials and methods
Design
Ethical approval for the study was obtained from the faculty University Ethics Committee (Ethos approval-2022-48048-37914) and the research was carried out in accordance with the declaration of Helsinki. Participants were recruited through the research team's institutional social media and an email to those on the CMTUK mailing list between July and September 2023. Control participants were recruited by similar methods between July and September 2024, with targeted recruitment to ensure age and sex matching to CMT participants. For both groups, links to the survey were made available online. After participant information was provided on the survey landing page, participants provided their informed consent via a compulsory drop down selection. Those who responded to “I do not provide consent for my answers to be used in research” were directed to an exit page of the questionnaire. Consenting participants completed a questionnaire about their activities of daily living, daily fatigue, quality of life, and participant demographics. All aspects of the questionnaire were completed online (Qualtrics, London, UK). All questions required a compulsory answer. All questions were developed using previously adopted or externally validated questionnaires. The final question of the survey provided a study email address where participants were provided with an anonymous study code from which they could request to undertake the food diary. Participants were subsequently provided with instructions on how to complete the food diaries. All analysis was completed anonymously, with the participant ID used to link food diary and survey outcomes. The study was conducted following the Checklist for Reporting Results of Internet ESurveys (CHERRIES) guidelines. 33 Of 75 adults with CMT completing the survey, 25 completed 3-day food diaries; of 89 controls completing the survey 28 completed 3-day food diaries. The subsequent data is from the 25 CMT and 28 control participants who completed both the online survey and 3-day food diaries. Participation rate for CMT and control was 100% with all participants completing all questions within the survey. Multiple responses by participants were considered unlikely as all IP addresses from respondents were unique.
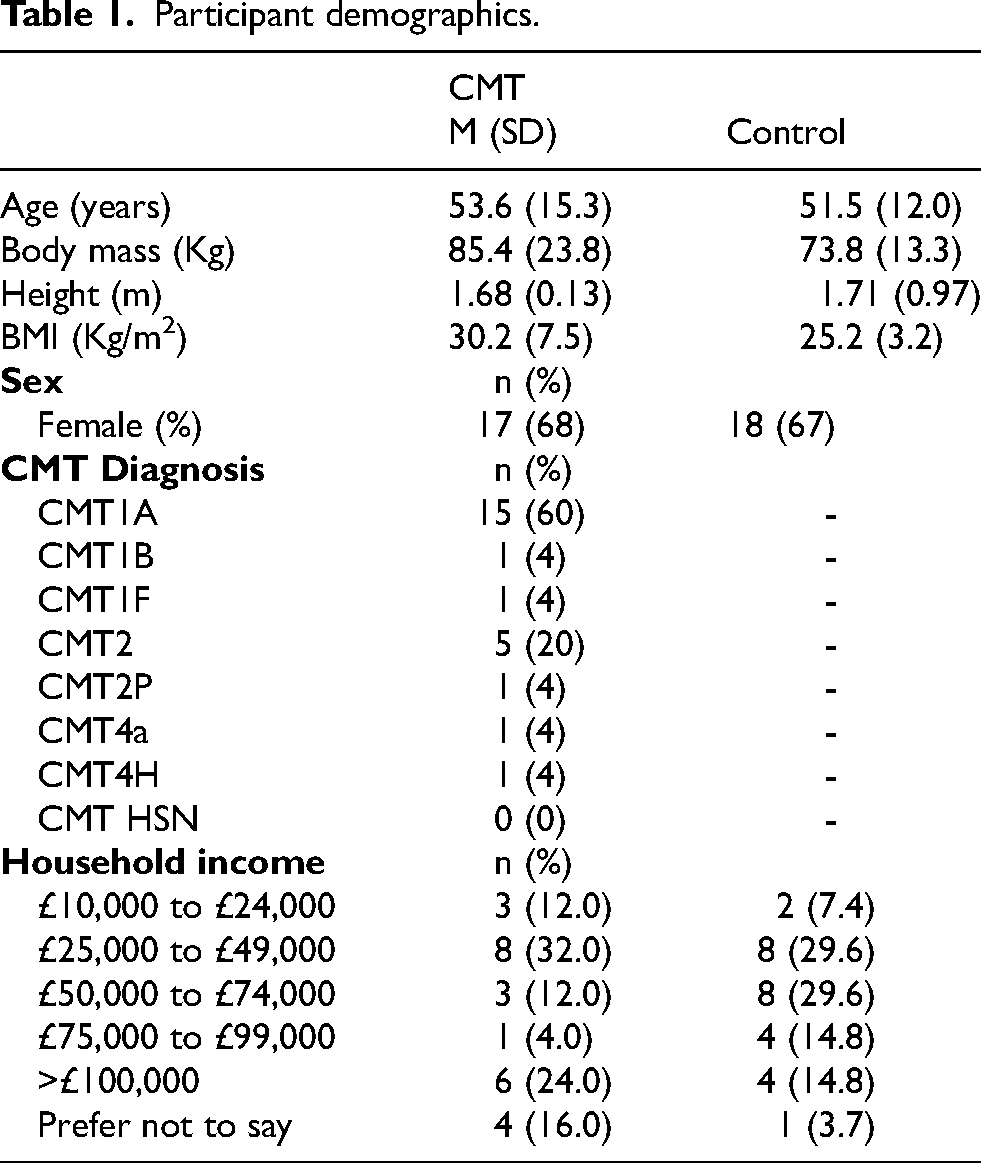
Participant demographics and condition
Participants completed drop-down selections for age, height, and body mass. Options were given for height in metres and feet and inches, and for body mass in kg and lbs. Subsequent participant demographic questions (household income, ethnicity and education level) were provided consistent with the UK census classification (Table 1). Participants identified via drop down menu their condition as CMT with a text box to self-report their specific diagnosis (Table 1).
Participant demographics.
Brooke and Vignos scale
A description of Lower and upper limb function was provided using the Brooke34,35 and Vignos 36 scales, respectively. The Brooke scale ranges from 1–6, whereby 1 means the participant is able to “start with arms at the sides and abduct the arms in a full circle until they tough above the head” and 6 means “Cannot raise hands to the mouth and has no function of hands”. 37 The Vignos scale ranges from 1–10, with 1 “Walk and climb stairs without assistance”, and 10 “Confined to a bed”. 37
Activities of daily living
The Barthel Index (BI) is a reliable, 38 disability specific, 10-item questionnaire to self-assess performance of activities of daily living. 39 The BI scoring system ranges from 0–20, with lower scores indicating increased disability. 38
Fatigue-Checklist individual strength
The checklist individual strength (CIS-Fatigue) was developed as a self-reported, multidimensional measure of fatigue consisting of 20 items, each with a 7-point Likert scale scoring. 40 There are four subscales; CIS-Fatigue Severity, measuring the subjective experience of fatigue (8 items); CIS-Concentration, measuring concentration problems (5 items); CIS-Motivation, measuring reduced motivation (4 items) and CIS-Activity, measuring the reduction of activities from fatigue (3 items). Reversed scoring is applied to some items. 41 Reliability of CIS has been previously reported as good (α = .82–92) 40 and has good discriminate validity. 42 We have previously adopted the CIS in adults with neuromuscular conditions. 43
Quality of life-SF36
All participants completed the SF-36v2 questionnaire, a reliable and validated measure, with eight domains of quality of QoL. 44 The constructs for the domains of QoL are SF36 Physical functioning (10 items), Role limitations due to physical health, Role limitations due to emotional problems (3 items), Energy/fatigue (4 items), Emotional well-being (5 items), Social functioning (2 items), Pain (2 items) and General health (5 items). All measures are scored out of 100, with higher scores representative of better health as we have described previously within adults with neuromuscular conditions. 43 For reference, the 36th item “health change” is included as a separate scoring criteria and omitted from the current cross-sectional analysis.
Dietary assessment
Participants were provided with a choice of either smart phone app (Libro, Nutritics. Dublin, Ireland) or paper-based food diaries as we have adopted previously. 45 All participants received written instructions on the procedures for each format and were asked to record all foods and drinks consumed both at home and outside. Participants were requested to record food intake over two weekdays and one weekend day to provide balanced representation of habitual diets. The paper diaries were coded and entered manually into the dietary assessment software by the PI, whilst smart phone records were exported directly into the dietary assessment software (Nutritics, Dublin, Ireland).
Each participants’ dietary outcomes are presented as both a percentage of UK recommended daily intake (RDI), and the relative number of participants that reach UK RDI. 46 Both of these analyses are performed based on the RDI for individual participants sex and age for: total energy intake, 3 macro nutrients (protein, fat and carbohydrate) and 28 micronutrients. In addition to the RDI, diet quality was assessed using two validated measures of overall diet quality: My nutrition index (MNI) and the healthy eating index (HEI). Finally, relative caloric contribution from processed food groups was also calculated using NOVA classification. 47
My nutrition index
MNI is a nutrient focused assessment of diet quality, with nutrients scored as a relative percentage of recommended daily intake (RDI) or equivalent, beyond RDI however MNI allows a overall score of diet quality based on nutrient intake. 48 In the present study all nutrients were based on age and sex specific RDI, 46 where no UK RDI recommendation is available alternatives were adopted, such as: cholesterol (NICE guidlines 49 ), manganese (US RDA 50 ), pantothenic acid (NIH 51 ) and vitamin E (US RDA 50 ). For adequacy nutrients, reaching RDI is awarded a maximum score of 100, with relative deficiencies presented as e.g., 50% of RDI = 50. For moderation components (cholesterol, free sugar, sodium, total fat and saturated fat), RDI is provided as a limit with ≥100% of RDI scoring 0. Values for nutrients and total scores over 90 are considered to be adequate. 52 Consistent with RDI 32 nutrients were assessed including total energy intake, 3 macronutrients and 28 micronutrients (Table 2).
Dietary intake.
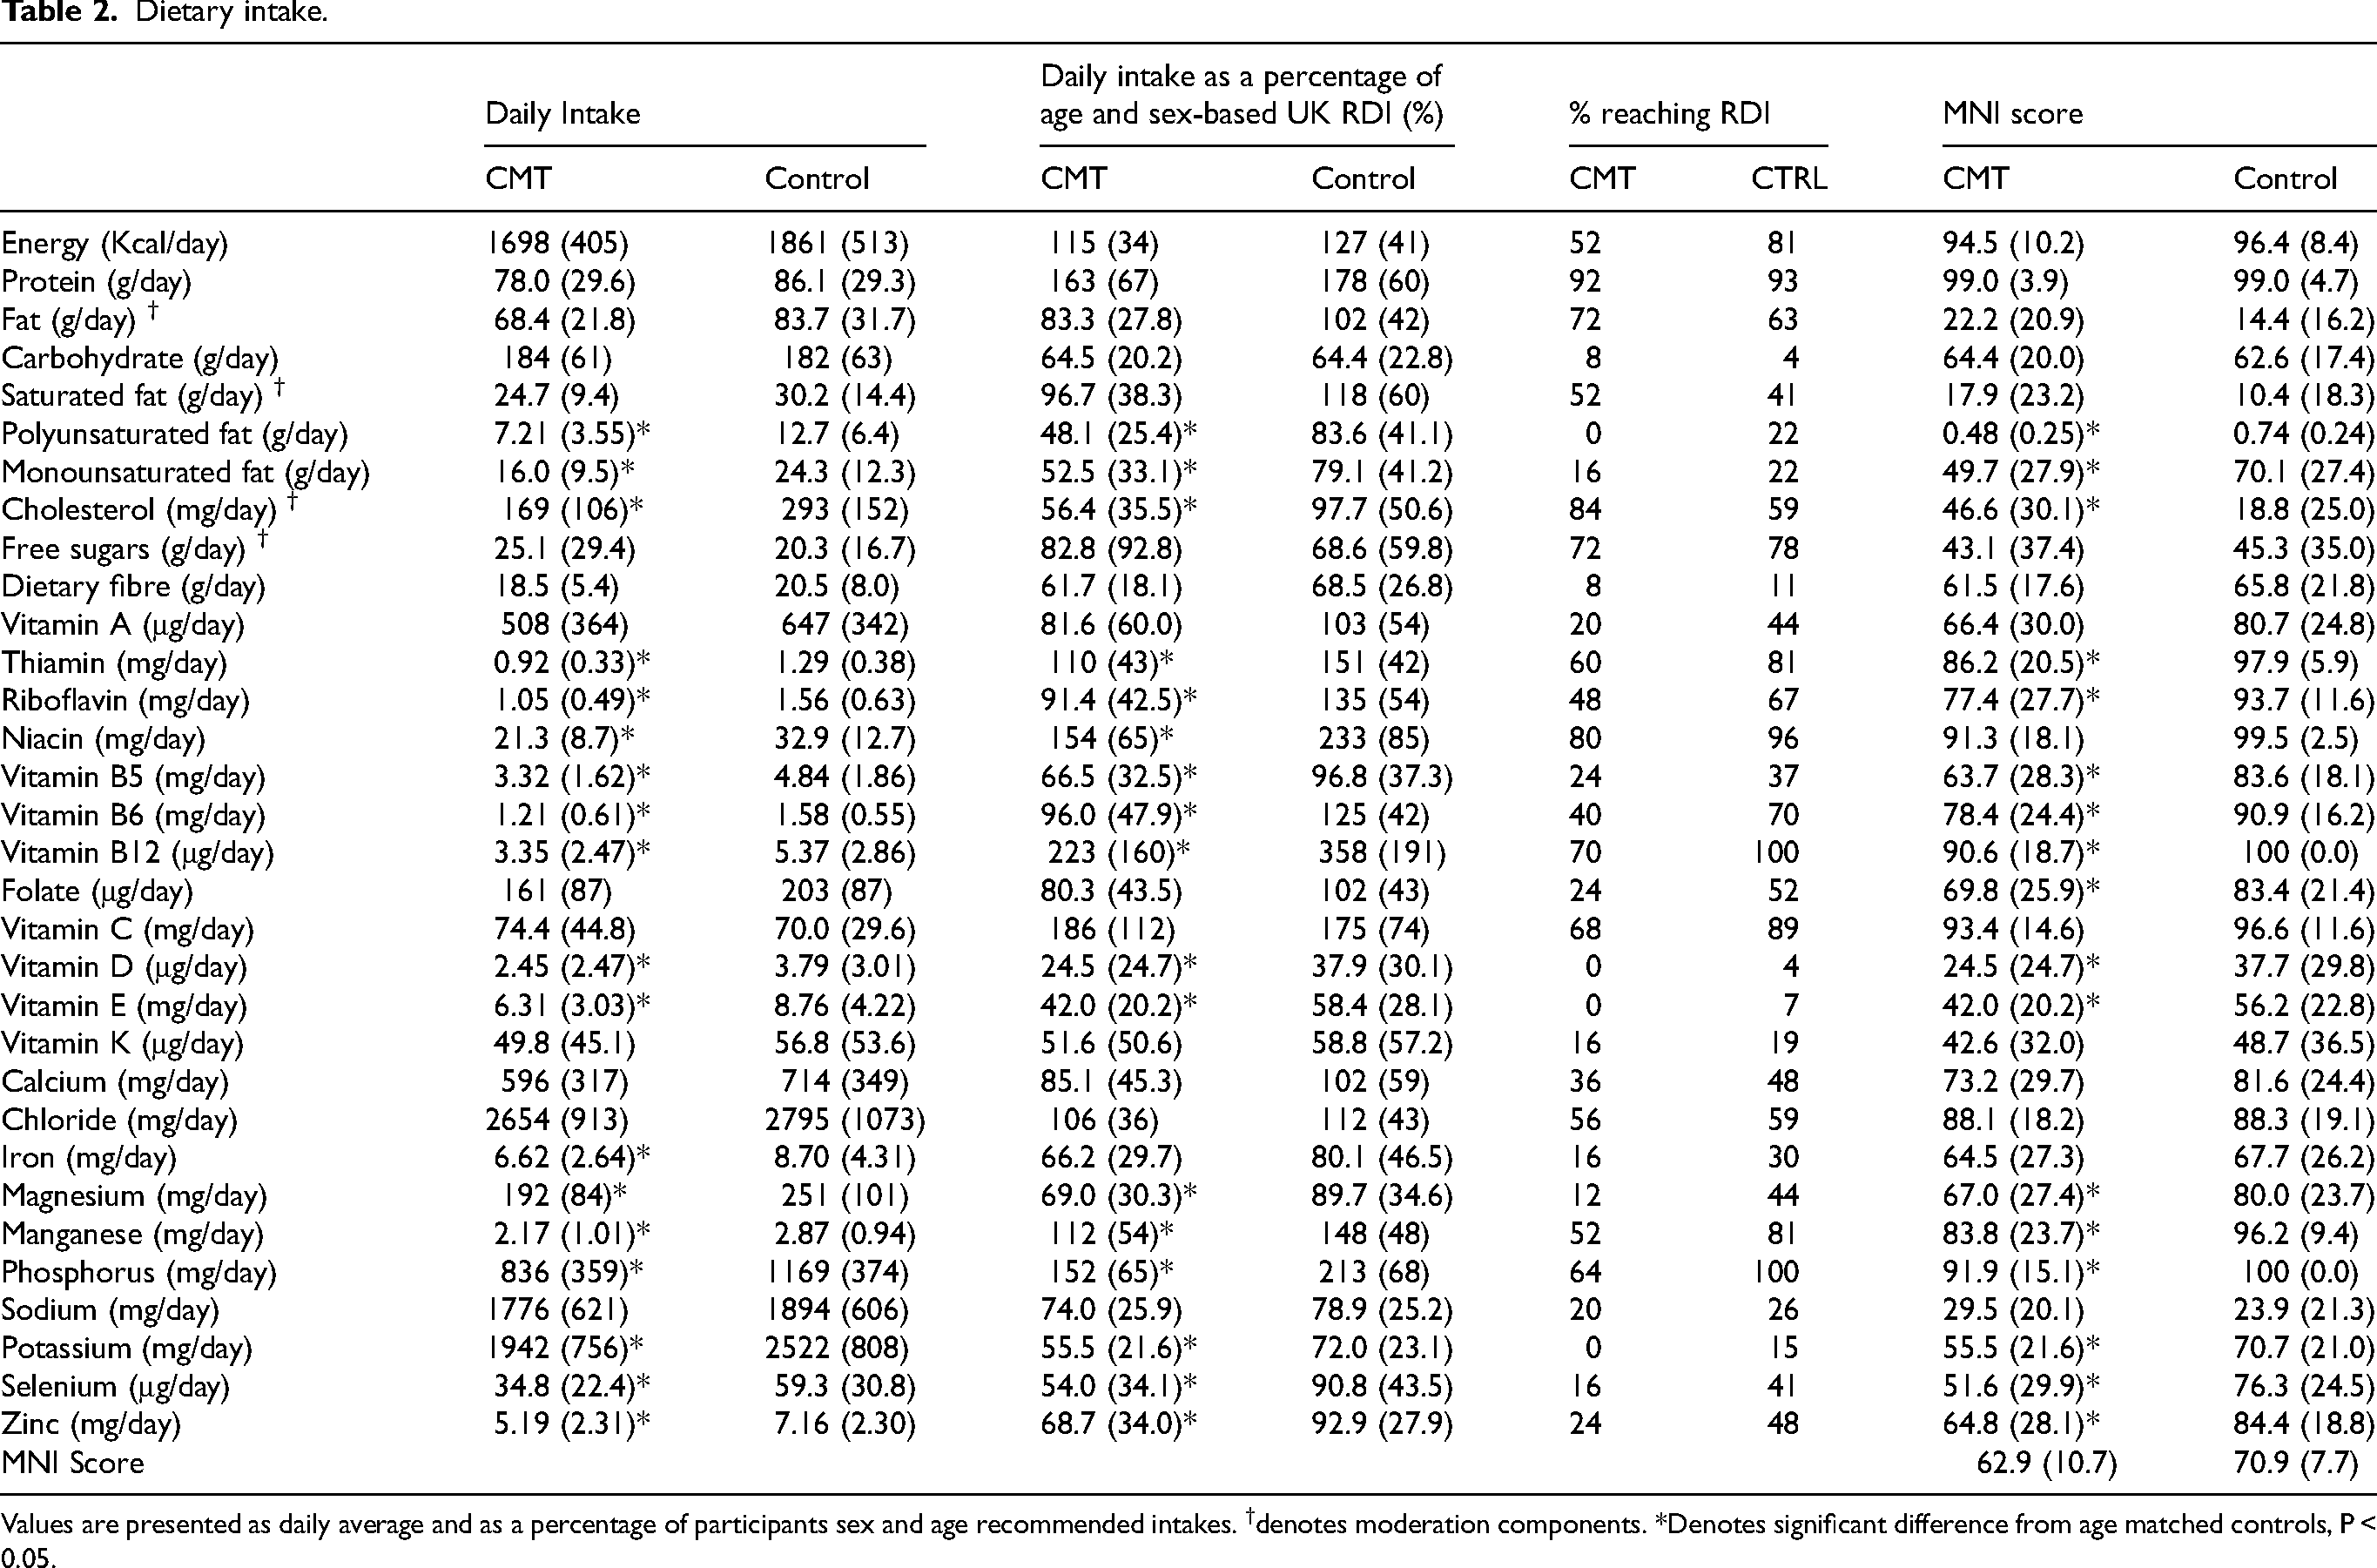
Values are presented as daily average and as a percentage of participants sex and age recommended intakes. †denotes moderation components. *Denotes significant difference from age matched controls, P < 0.05.
Healthy eating index
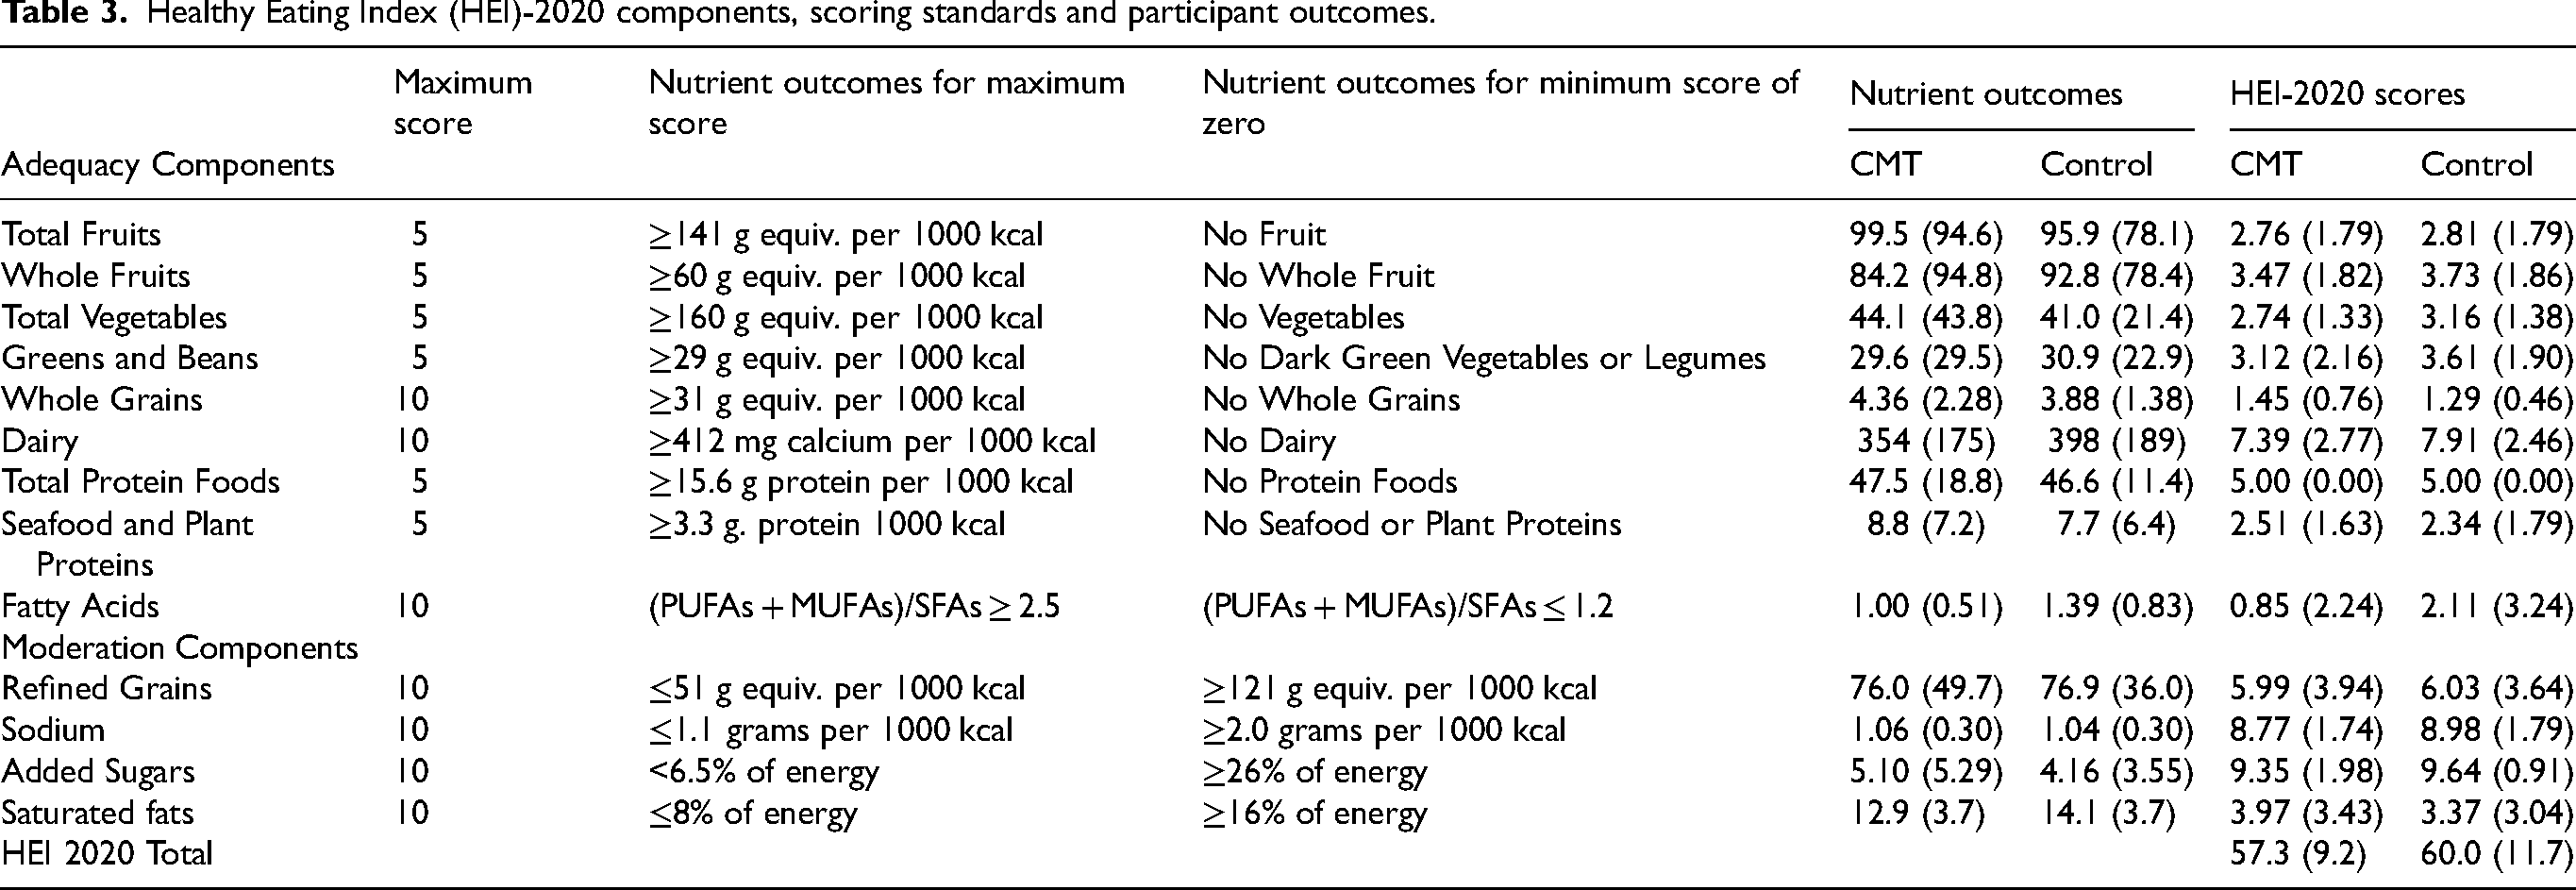
HEI is a food group measure of diet quality relative to caloric intake that has previously been correlated to health outcomes such as muscle mass and function in the elderly. 53 The HEI has been recently updated (HEI-2020) to better reflect dietary guidelines and variations across the lifespan, 54 and although initially developed based on USA guidelines, a metric equivalent of the HEI-2020 has been developed as provided in Table 3 consistent with previous. 55 In brief, nutrients are classed as adequacy or moderation components, whereby scores for adequacy components are provided for achieving upper targets, and exceeding minimal levels, whilst the reverse is the case for the moderation components. The HEI-2020 is scored out of 100 with higher scores equivalent to higher diet quality.
Healthy Eating Index (HEI)-2020 components, scoring standards and participant outcomes.
NOVA classification of ultra-processed foods
Consistent with NOVA classification, 47 foods were classified based on the degree of processing they have undergone as: 1) Unprocessed or minimally processed, 2) Processed culinary ingredients, 3) Processed foods, or 4) Ultra-processed foods. Each NOVA classification group is presented as a percentage contribution to daily caloric intake.
Statistics
All quantitative analyses were performed using IBM SPSS Statistics 24 software. As Barthel index, HEI, UPF, pain, QoL domains and a number of other outcomes were non-normally distributed (Shapiro Wilks <0.05) data were analysed using non-parametric statistics. Mann-Whitney U test was used to compare group differences, whilst Spearman's rank corelation was used to determine association between dietary outcomes (e.g., HEI, MNI) and survey outcomes (e.g., CIS-Fatigue, QoL). All data are presented as mean (SD) unless otherwise stated. Statistically significant differences and/or associations were accepted at ≤0.05.
Results
Participant outcomes
All participant outcomes (mobility, pain, fatigue, and QoL) were significantly worse in CMT compared to controls (Table 4, P < 0.05), other than role limitations due to emotional problems.
Participant outcomes.
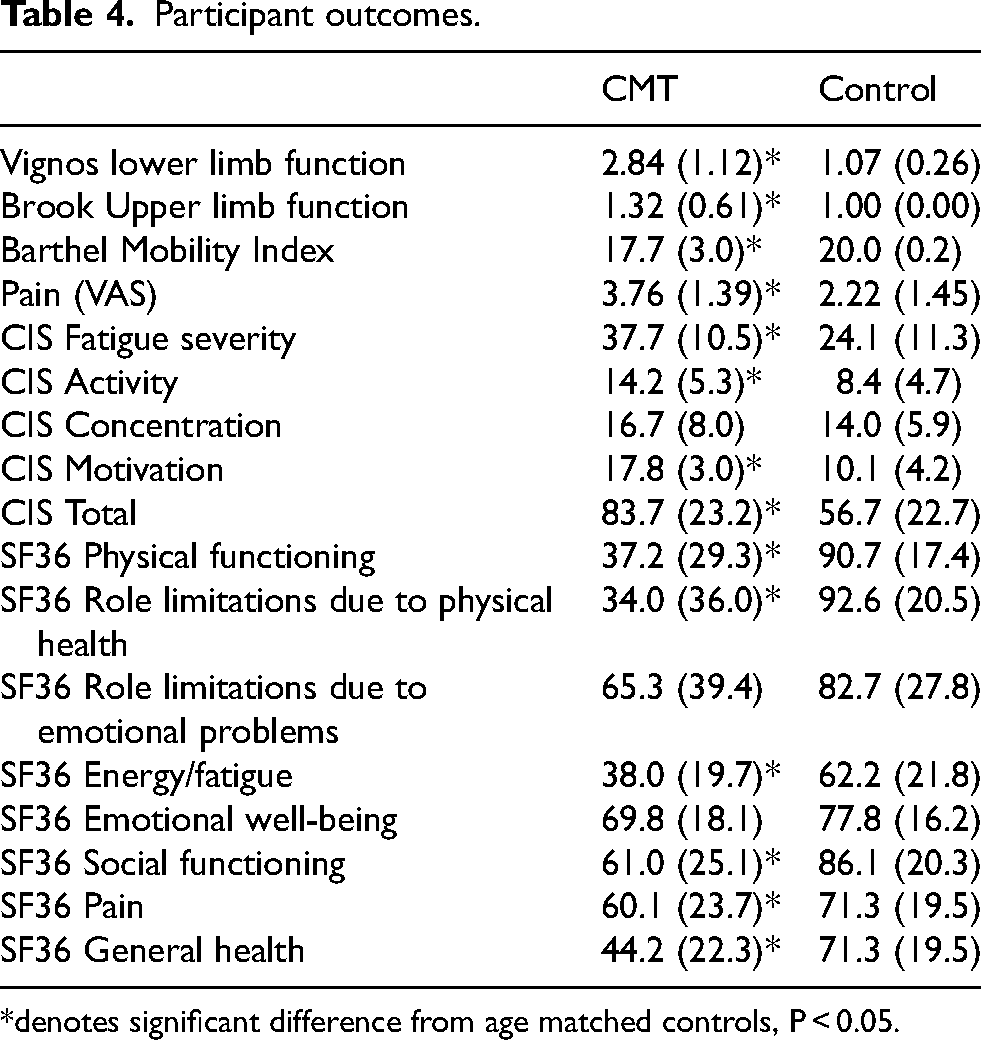
*denotes significant difference from age matched controls, P < 0.05.
Nutritional analysis
There was no difference in daily caloric intake between CTRL and CMT (Table 2), with similar caloric contributions from macronutrients with 19.4 (7.9)% for Protein, 36.8 (7.5)% for fat and 43.8 (8.0)% for Carbohydrates for CMT, and 19.1 (4.8)% Protein, 40.7 (7.7)% Fat, and 40.3 (8.9)% Carbohydrates in CTRL.
Of the 28 micronutrients identified in Table 2, 17 were lower in CMT compared to CTRL when expressed in absolute terms, relative to RDI, and as MNI scores (Table 2, P < 0.05).
RDI
CMT participants met none of the 32 nutrient RDI targets, with 16 sufficiency nutrients lower than controls based on RDI and MNI (P < 0.05, Table 2). Micronutrient intake as a percentage of RDI was significantly lower in CMT for polyunsaturated fats, monounsaturated fats, thiamin, riboflavin, niacin, vitamins B5, B6, B12, D, E, magnesium, manganese, phosphorus, potassium, selenium, and zinc (all P < 0.05, Table 2). None of the sufficiency micronutrients recorded 100% fulfilment by CMT participants (protein was the most fulfilled with 92% reaching RDI), 0% of CMT participants reached RDI for polyunsaturated fats, vitamin D, vitamin E, and potassium (Table 2). For CTRL participants 0% reached RDI for polyunsaturated fats only, whilst all CTRL participants reached 100% RDI for Vitamin B12 and phosphorus. Of the sufficiency micronutrients, vitamin D and E showed the greatest prevalence of under nutrition with 0–7% of participants reaching the RDI (Table 2).
Of the moderation components CMT participants had lower cholesterol intake compared to controls (P < 0.05, Table 2).
MNI
Within the CMT participants adequacy of intake (>90) was achieved for protein, energy, Niacin, Vitamin B12, vitamin C, and phosphorous (Table 2), whereas adequacy was reached by the CTRL participants for protein, energy, thiamin, riboflavin, niacin, vitamin B6, vitamin B12, vitamin C manganese, and phosphorous. Of the micronutrients, the lowest scoring MNI components were Vitamin D, E and K (Table 2).
There were no correlations between total MNI and any of the participant outcomes in either CMT or CTRL other than participant age (Table 5, P < 0.05).
Associations (R) between survey outcomes and diet quality indices.
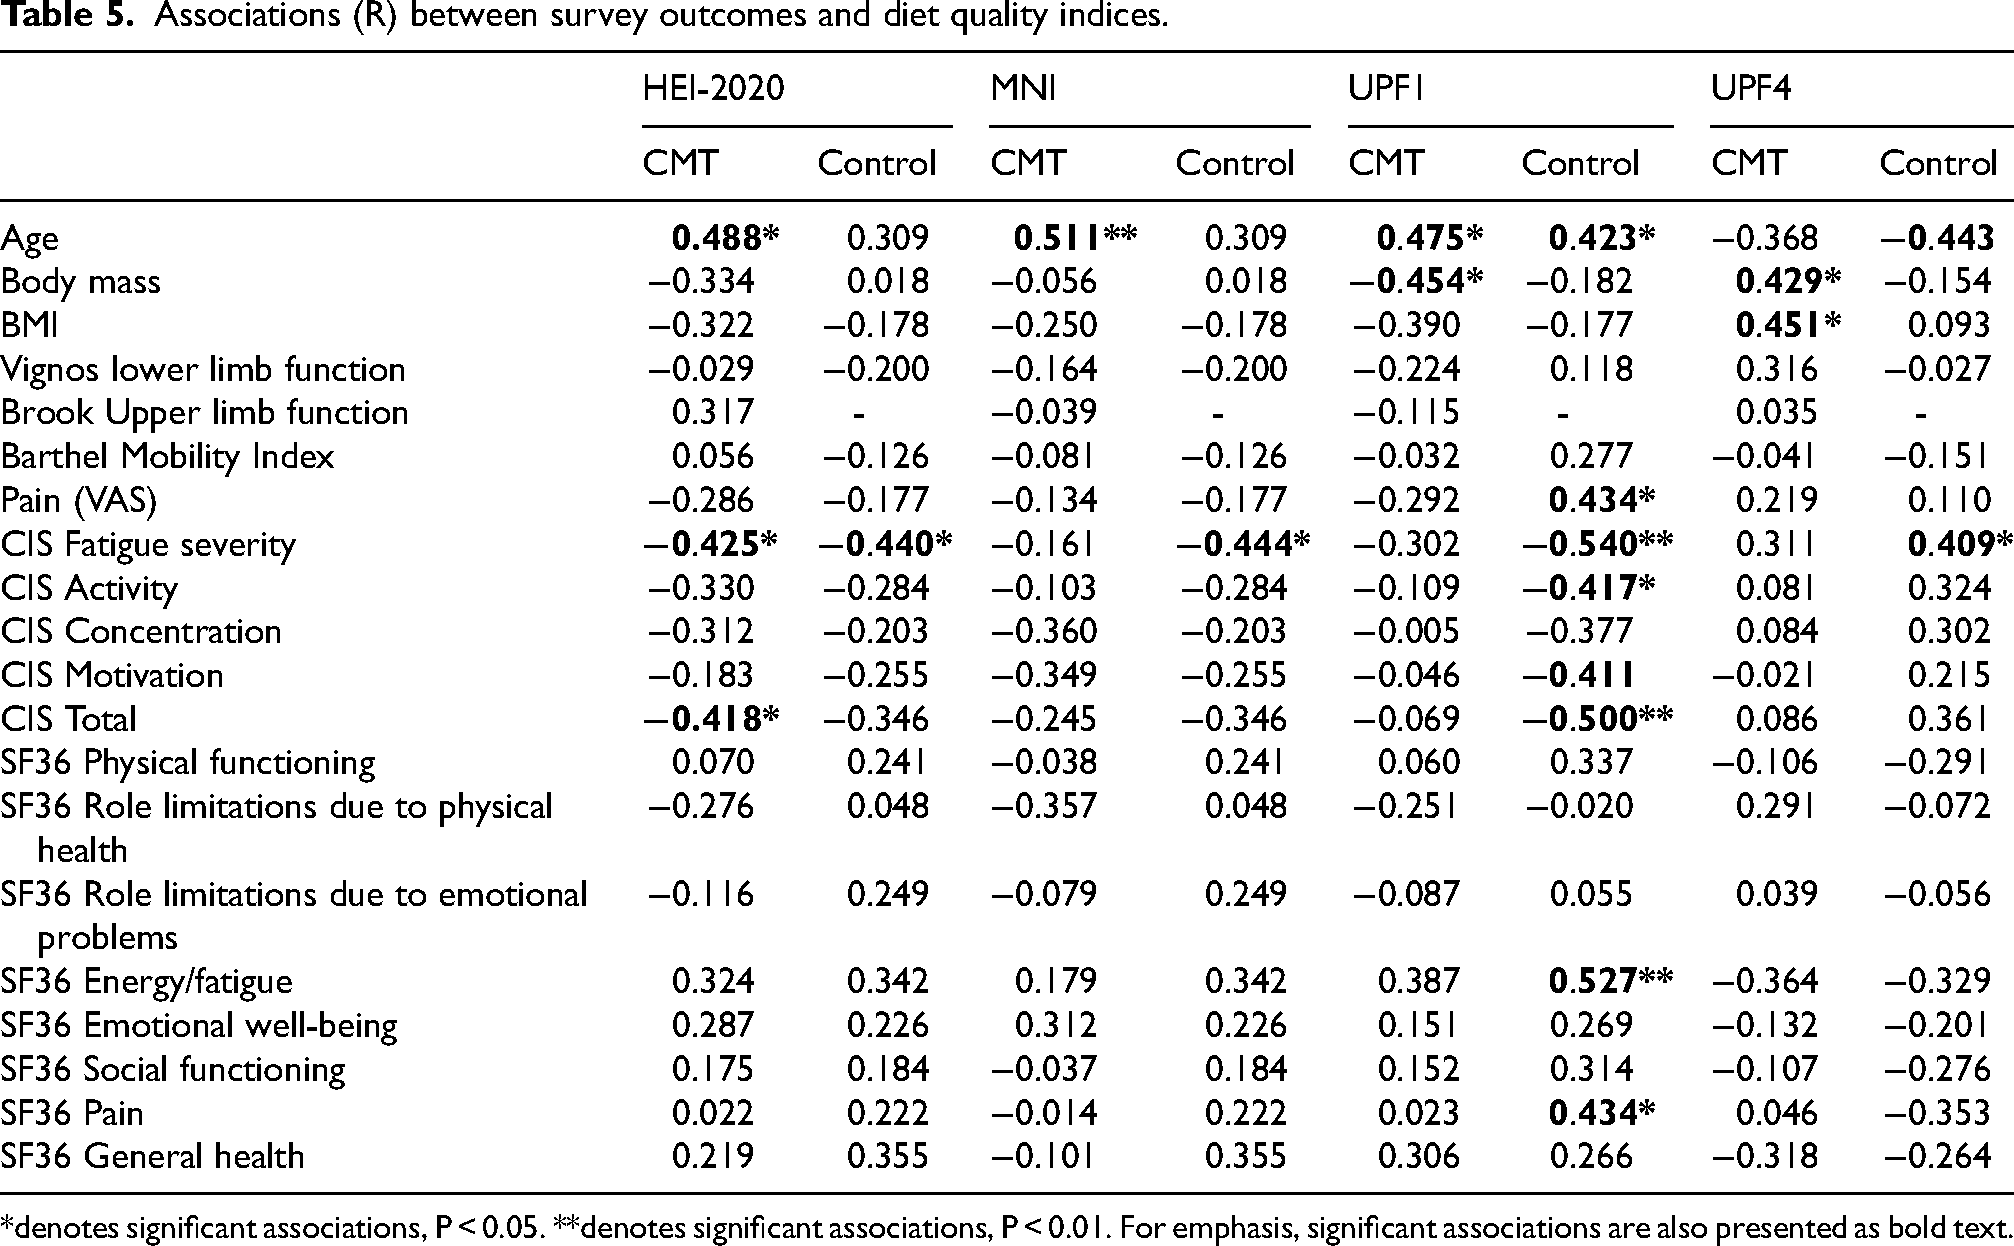
*denotes significant associations, P < 0.05. **denotes significant associations, P < 0.01. For emphasis, significant associations are also presented as bold text.
Healthy eating index-2020
Participants scored highest on protein, sodium and free sugars reaching >80% of the available points. The worst scoring domains were fatty acids and whole grains scoring 10% of available points, with saturated fats all scoring below 40% of available points (Table 3).
There was no difference in HEI scores for any domain between CMT and Control participants (Table 3).
Within CMT and Control participants, there were significant correlations between HEI-2020 and CIS-severity (Table 5, P < 0.05), with CMT participants also showing association between HEI score and CIS-total (Table 5, P < 0.05). There was no associations between HEI-2020 and any QoL domain, Vignos, Brooks or Barthel index scores (Table 5). Age was associated with HEI-2020 in CMT (P < 0.05, Table 5).
Ultraprocessed food
Compared to Controls, CMT participants had diets that had almost double the caloric content composed of ultraprocessed Food (UPF4, Table 6, P < 0.05), and 27% lower in minimally processed food (UPF1, Table 6, P < 0.05). UPF2 and UPF3 were also significantly lower in CMT compared to Controls (Table 6, P < 0.05).
Processed food contribution to daily caloric intake.
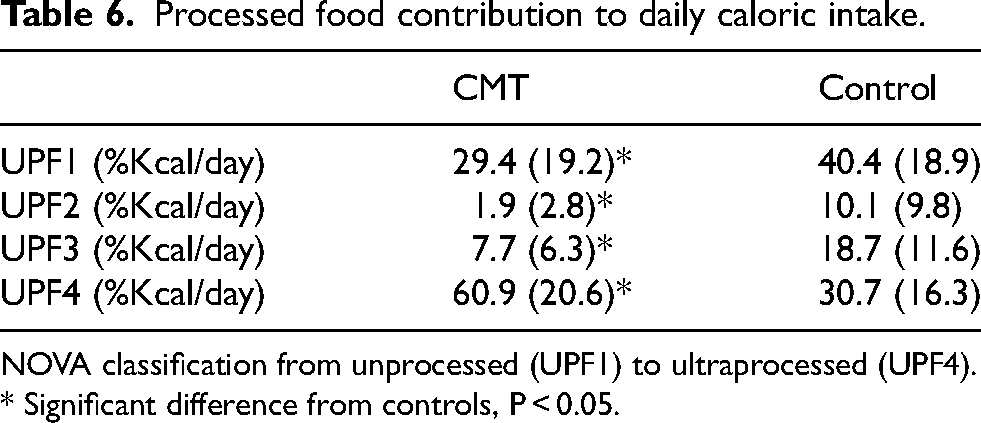
NOVA classification from unprocessed (UPF1) to ultraprocessed (UPF4). * Significant difference from controls, P < 0.05.
As there were no significant correlations between UPF2 or UPF3 and any experimental outcomes, these data are omitted from Table 6. In contrast, for CMT, UPF1 intake was associated with age, and negatively associated with body mass (Table 5, P < 0.05). Within the controls, UPF1 intake was significantly associated with age, pain, SF36 Fatigue, SF36 pain, whilst being negatively associated with CIS severity, CIS activity and CIS total (Table 5, all P < 0.05).
Within CMT, UPF4 intake was associated with body mass and BMI, whilst within Controls UPF4 intake was associated with fatigue severity, and negatively associated with age (Table 5, P < 0.05).
Sex differences in dietary outcomes
Data such as RDI, MNI and HEI are presented relative to either sex specific guidelines (RDI and MNI) or normalised to daily caloric intake (HEI), thus are expected to account for any possible sex difference in nutrient intake. For completeness however, within CMT participants: RDI for protein, and RDI and MNI for zinc were higher in women than men (P < 0.05), whilst Chloride intake was lower in women than men (P < 0.05). Within control participants: RDI B12, Iron, B5 were lower in women compared to men (P < 0.05), whilst HEI fish was higher in women than men (P < 0.05). For brevity, sex disaggregated data are not presented here but are provided within the open access data sheet.
Discussion
The main finding from the present study was that adults with CMT showed lower diet quality using nutrient-based diet indices (RDI and MNI), and a higher caloric contribution from ultra-processed foods than controls. Although CMT and controls showed similar HEI-2020 outcomes, within both groups there was a negative association between fatigue severity and diet quality assessed with the HEI-2020, whilst showing no association between other health outcomes (QoL, disability) and HEI-2020 or MNI.
The dietary outcomes in the present study were consistent with previous. The HEI-2020 from the present participants (CMT = 57.3, Control = 60.0) was similar to population values (31–59 years = 55.3; > 60 years = 59.5), with others (similar to the present results) describing increasing diet quality with age. 54 The present MNI scores (CMT = 63, Control = 70) were consistent to those published previously (66 52 ). It is also of note that associations have been reported between HEI and MNI, 48 thus the improving diet quality with age observed in the present study is not unexpected. In the controls from the present study, UPF1% was equivalent to 30.7% of daily food and drink caloric intake, which is consistent with the European average of 27%. 56 Together these comparisons to previous studies would suggest we have dietary outcomes consistent with broader population samples.
The CMT participants in the present study had more micronutrient inadequacy than controls, specifically, RDI was not met for 19 of 25 sufficiency micronutrients, compared to 14 sufficiency micronutrients not reaching RDI in the controls, with direct comparisons showing significantly lower micronutrient intake for 16 of the 25 sufficiency micronutrients in CMT compared to control participants. Of the moderation micronutrients, CMT did not exceed RDI in any moderation micronutrient, whereas control exceeded RDI intake for saturated fats. In contrast for the four moderation micronutrients, there was a significantly lower cholesterol intake in CMT compared to control. It should be noted that the total MNI score was not different between the groups, this likely reflects that despite worse sufficiency outcomes in CMT, moderation micronutrient intake scored better in CMT, likely as their daily caloric food intake was lower than the controls (albeit not significantly). Although no associations were observed between micronutrient intake (RDI or MNI) and fatigue, the lower micronutrient quality of CMT diet is consistent with the findings observed based on classification for food processing discussed below.
Diet quality, as assessed through ultraprocessed food intake, was worse in CMT compared to controls. Ultraprocessed food (UPF4) contributed almost double the dietary calories in CMT compared to controls, whilst CMT participants had lower caloric contributions of processed, unprocessed and minimally processed foods. It is likely that the higher intake of ultra-processed food contributed to the micronutrient patterns described above as ultra-processed foods are lower in micronutrients 7 (e.g., significantly lower B, D and E vitamins in the present CMT compared to controls). This greater intake of UPF4 in CMT is likely facilitated by convenience and their “ready to eat” nature, observations made previously from the general population.57,58 For those with CMT a higher consumption of UPF4 could reflect the direct impact of their disability on their ability to prepare unprocessed food, furthered by the present studies association between fatigue severity and the consumption of UPF4. In other clinical conditions, specifically the neurological condition multiple sclerosis, those more severely impacted by the condition consumed higher ultra-processed food intake. 20 Qualitative research within multiple sclerosis further identify fatigue and mobility as condition specific barriers for healthy food preparation and grocery shopping, 5 this is particularly relevant given that home cooking is associated with better diet quality 6 and lower UPF intake. 59 It is likely therefore that the greater ultra-processed food intake in CMT in the present study, similar to multiple sclerosis, 20 could reflect a lower capacity of some to prepare meals from unprocessed ingredients as a result of higher levels of fatigue. It is noteworthy however that there is no significant association between UPF4 and fatigue in the CMT participants. It would be prudent to not overstretch our interpretation of this finding given the high levels of fatigue, UPF4 intake and low micronutrient diet quality in CMT, but one possibility is that distal impairments may contribute to these associations as we discuss in the limitations section below.
In the present study the control participants showed significant correlation between minimally processed food intake and lower fatigue severity, and higher QoL outcomes for energy and pain. As with other diet quality indices, age correlated with UPF1%, suggesting improved diet quality with age (reflecting what was seen in HEI-2020 and MNI). The intake of ultraprocessed foods is associated with a range of adverse health outcomes, 60 similarly the intake of minimally and unprocessed food has been associated with higher diet quality and lower cardiometabolic disease risk. 61 There are some data associating minimally processed food intake with QoL in otherwise healthy populations, an association specifically credited to the dietary intake of leafy vegetables, 62 indeed some have previously made links between vegetable intake and lower fatigue, 63 whilst others have linked anti-inflammatory diets including unprocessed vegetables, fish and higher fibre diets, to reduced fatigue. 64 It is perhaps beyond the scope of the present study to focus too heavily on the findings within the control group, more so we reflect here on them as being unexceptional within previous observations.
The lack of difference in HEI-2020 between CMT and controls differed from the micronutrient and UPF observations above. In those without a neuromuscular conditions, weight related disability and food insecurity show significant correlation, 65 with a conceptual model identifying how physical disabilities can lead to restricted mobility that in turn leads to food insecurity. 66 In the present CMT participants however, there were no differences from controls for diet quality as assessed through HEI-2020, nor in any of its domains. Of interest however, was the significant negative correlation observed within the CMT participants between fatigue severity and HEI-2020 diet quality. In the present study, fatigue severity was 56% higher in CMT compared to controls, a finding consistent with others. 67 The overwhelming nature that some CMT participants describe fatigue is consistent with the lower diet quality seen in those with greater fatigue severity. Indeed, fatigue rather than being simply symptomatic of CMT, seems to dominate the daily life of those experiencing it. Indeed, coping strategies to deal with bouts of fatigue, daily exertion such as activity and work, need to be negotiated to “conserve energy levels” throughout the day. 8
The online questionnaire in the present study was composed to capture a broad range of participant outcomes that attempted to draw attention to some of the possible challenges that are faced by those with CMT in eating a healthy diet. As with all surveys there is a balance between participant engagement, survey length and the relevance of the outcomes to the aim; in the present study, based on previous observations in other neurological conditions, the focus was on fatigue 5 and disability impact as assessed through activities of daily living. Specifically, for QoL, we adopted a QoL score that would allow comparisons with a control population, rather than a CMT specific measure of QoL such as the CMT-Health Index. 68 Were we to focus entirely on within CMT associations in participant outcomes and diet quality in the future, we would strive to adopt more condition specific survey elements. Ultimately however as with every online survey, in an attempt to increase our participant recruitment, we must acknowledge a number of limitations. Limitation 1) Self-reporting body mass. Within a similar demographic to that of the present study, albeit non-clinical participants, there was 1.2 Kg bias of underreporting body mass in a web based survey, compared to measured body mass. 69 This is pertinent in the present study as underreporting of body mass is more prevalent in those with a BMI > 25 Kg/m2. 69 It should be noted that within the present population there is a similar distribution of those (13 controls, 16 CMT) with a BMI > 25 Kg/m2. Ultimately however, none of the daily food metrics are calculated relative to body mass, so the present conclusions are unlikely to have been altered were participants measured by the research team. Limitation 2) Condition severity was not reported in the present study. The CMT Neuropathy score (CMTNS2) is a reliable and valid measure of disease severity specific to CMT, adopting clinical assessments of motor and sensory impairments. 70 The inclusion of the CMTNS2 in the present study, may have shown associations to diet quality consistent to what we observed with fatigue. Unfortunately, the CMTNS2 includes physical assessments including vibration (through a tuning fork) and pin prick sensitivity, conducted by assessors who receive specific training. 71 In contrast in the present study we used previously validated measures of what an individual “can do” through the Barthel Index, which has been adopted previously in CMT to assess life impact rather than disease severity. 72 Future research should therefore build upon the observations from our online survey and food diary, to include physical assessment of those with CMT.
Limitation 3) The severity of impaired hand function was not specifically addressed in the present study. Within CMT hand function is 60% that of controls, 73 in other disabilities such as spinal cord injury, impairments in hand function has been identified through participant focus groups to affect healthy cooking behaviour. 74 Similarly, had we conducted in person assessments such as with the CMTNS2 as mentioned above, 70 we may have observed disability specific sensory or motor impairments that could have contributed to the lower diet quality in CMT. As with all research we therefore present our findings that fatigue contributes to lower diet quality in CMT, whilst acknowledging that other condition specific impairments, such as hand function or sensory symptoms, likely contribute to lower diet quality in adults with CMT.
Limitation 4) In the present study we present data from a heterogenous group of CMT participants, with the highest prevalence of CMT1. It is common for studies on fatigue, QoL and disability to include a CMT group overall, without disaggregating for CMT type.8,67,75 There are some data suggesting CMT type specific presentations of pain and QoL domains. 72 For disability, it appears to be diseases severity rather than CMT type that determines the level of physical impairments. 76 It is important to note therefore that (as with others) we present our findings from a mixed group of those with CMT, including a large prevalence of CMT1, focusing on associations between fatigue severity and diet outcomes without disaggregating for CMT type. Had we included more severe presentations of CMT, and even, more severe presentations of CMT1 participants, that although the main conclusions would not differ, differences from control would likely be greater.
In the present discussion, the authors have identified dietary factors that differed between CMT and controls, with potential contributing factors suggested. It should be acknowledged however that there are numerous studies in non-CMT populations identifying a role of poor diet quality in the worsening of symptoms and long term condition co-morbidities.3,60,77 Within CMT co-morbidities commonly linked with lifestyle factors such as T2D are known to worsen the clinical and neurophysiological phenotype, 30 whilst high BMI and adiposity are prevalent and associated with higher levels of disability in children with CMT. 12 Current therapeutic strategies for those with CMT include only the broadest nutritional advice. 13 Whether poor diet leads to worsened fatigue, or vice versa, there is certainly a need to explore the barriers and facilitators to the lower micronutrient, more processed diets in those with CMT.
Footnotes
Acknowledgements
The authors have no acknowledgments to report.
Ethical considerations
Ethical approval for the study was obtained from the faculty University Ethics Committee (Ethos approval-2022-48048-37914) and the research was carried out in accordance with the declaration of Helsinki.
Consent to participate
After participant information was provided on the survey landing page, participants provided their informed consent via a compulsory drop down selection. Those who responded to “I do not provide consent for my answers to be used in research” were directed to an exit page of the questionnaire.
Funding
The authors disclosed receipt of the following financial support for the research, authorship, and/or publication of this article: The authors were supported by research funding from Charcot Marie Tooth UK.
Declaration of conflicting interests
The authors declared no potential conflicts of interest with respect to the research, authorship, and/or publication of this article.